


Value stream mapping is a technique to identify and eliminate process waste. It is a special type of flow chart that uses symbols called “lean language” to describe and improve inventory and information flow. It helps us provide customers with the best value through a complete value creation process and minimize waste in the following aspects:
- Design (Concept To Customer)
- Build (Order To Delivery)
- Sustain (In-Use Through The Life Cycle To Service)
What is Value to Customers?
Value is what the customer is buying which is a capability provided to a customer. A product or services provided to a customer should be:
- Of The Highest Quality
- At The Right Time
- At An Appropriate Price As Defined By The Customer
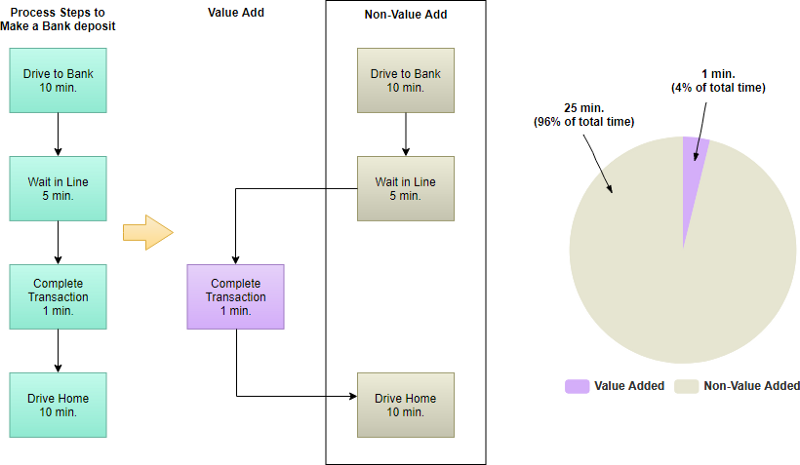
In reality, the activities that indeed create value for the customers are only a small portion of the whole work process. This is why businesses should focus on reducing wasteful activities as much as possible. By doing so, companies can identify significant opportunities to improve their overall performance.
What is Waste?
Daniel T. Jones (1995) identifies seven commonly accepted types of waste. These terms are updated from the Toyota production system’s original nomenclature:
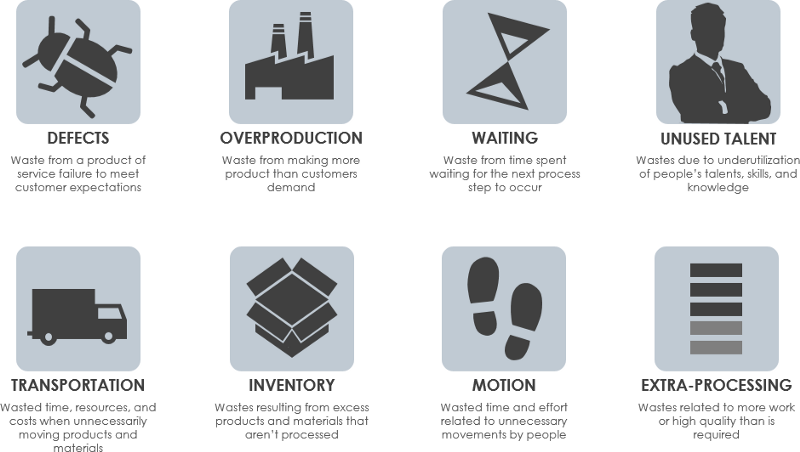
- Inventory: Purchasing And Storing Raw Materials, And Stocking Work In Progress To Wait For Future Processes Is A Waste.
- Waiting: In A Series Of Steps For Processing A Material If One Of The Steps Is Slow, Then It Accumulates Work In Progress Which Is A Waste.
- Defects: Finally, The Most Important And Prevalent Type Is Defects. Defects Are Not Acceptable To Customers. To Avoid This, A Quality Check Process, The Rework Process Should Be Established, Which Adds To Cost. Therefore Defects Are A Major Form Of Waste.
- Overproduction: Producing Items That Are In Excess Of Customer Demand.
- Motion: Unnecessary Movement Of Machineries And Movements Of Operators Can Cause Wear And Tear, Fatigue Respectively.
- Transportation: Any Unnecessary Movement Of Work In Progress Or Raw Materials Is A Form Of Waste. This May Cause Damages To Materials, And May Also Increase The Cycle Time Of Production And Thus Is A Waste.
- Over-Processing: Providing Features That Are Not Demanded By Customers, And Fine-Tuning To Levels More Than That Are Prescribed By Customers, Adds To The Cost Of Manufacturing Which Is A Waste.
What Is a Value Stream Analysis?
Value Stream Mapping (VSM) is a fundamental technique to identify waste and reduce process waste. It is an essential lean tool for an organization wanting to plan, implement, and improve while on its lean journey. It helps users create a solid implementation plan that will maximize their available resources and help ensure that materials and time are used efficiently. Value Stream Analysis is a powerful planning tool to optimize the result of eliminating waste.
VSM makes clear the time and effort being spent on non-value adding activities, the cost of doing business, and sets the stage for reducing waste and streamlining the process. The purpose of value stream mapping is to maximize value and minimize waste in several different ways including:
- Facilitating Clear Communication And Collaboration
- Encouraging Continuous Improvement Of A Process
- Enabling Culture Change Within An Organization
- Creating Visualizations Of Delays, Excess Inventory And Production Constraints
Value Added vs Non Value Added Operation
Eliminating wasteful activities is crucial for the success of your company. They can lower profitability, increase customer costs, decrease quality, and even employee satisfaction. For this reason, you need to identify the non-value adding activities and try to improve the process where they appear or ultimately eliminate them.
Don’t make a mistake. Not all wasteful activities can be eliminated from your work process. Some of them are a necessity.
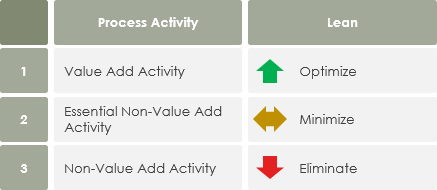
Monden (1994) identifies three types of operations:
- Non-Value Adding Operations (NVA): Actions That Should Be Eliminated, Such As Waiting.
- Necessary But Non-Value-Adding (NNVA): Actions That Are Wasteful But Necessary Under Current Operating Procedures.
- Value-Adding (VA): Conversion Or Processing Of Raw Materials Via Manual Labor.
In conclusion, value-added activities should be further optimized for seeking continuous improvement and growth of an organization, while the non-value added activities should be eliminated, or at least minimized as much as possible.
Value and Non-Value Added Example — Deposit Money in ATM
From Current State Value Stream Map to Future State Value Stream Map
As mentioned before, the Value Stream Analysis is a planning tool to optimize the results of eliminating waste. If you create a current state map only, you have missed the purpose of VSM. The future state map is a picture of the lean transformation process for a specific value stream. Before you create a future state map, you should have already created a current state value stream map.
Thus, Value Stream Analysis visually maps the flow of steps, delays, and information required to deliver a product or service; this is called a “Current State” Map. A future state map identifies improvement to be made to the value stream that will shorten the overall lead time.
To create an effective future state map, the following must be considered:
- Select A Product For Value Stream Mapping
- Create A Current Value Stream Map
- Eliminate Waste And Creates A More Efficient Future State Map
- Create An Implementation Plan
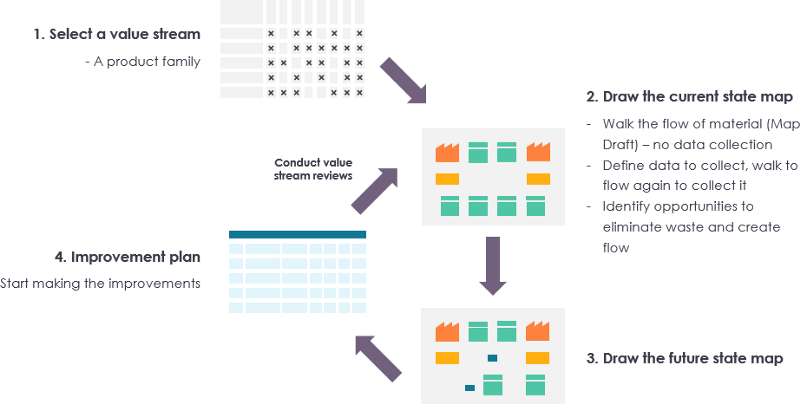
Finally, you should create a value stream implementation plan to achieve the future state. You are now armed with a plan for a lean value stream that you can use for tracking/measuring your improvements throughout the year. Ensure that you have a “value stream manager” or project manager driving the plan to completion.
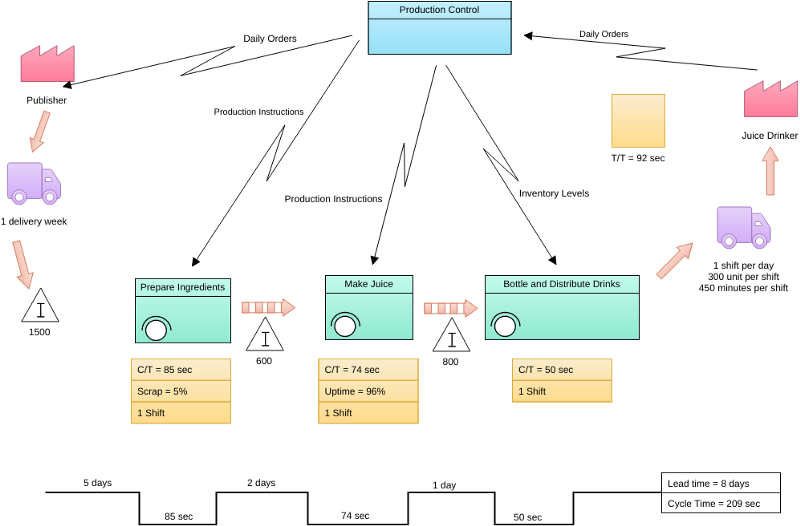
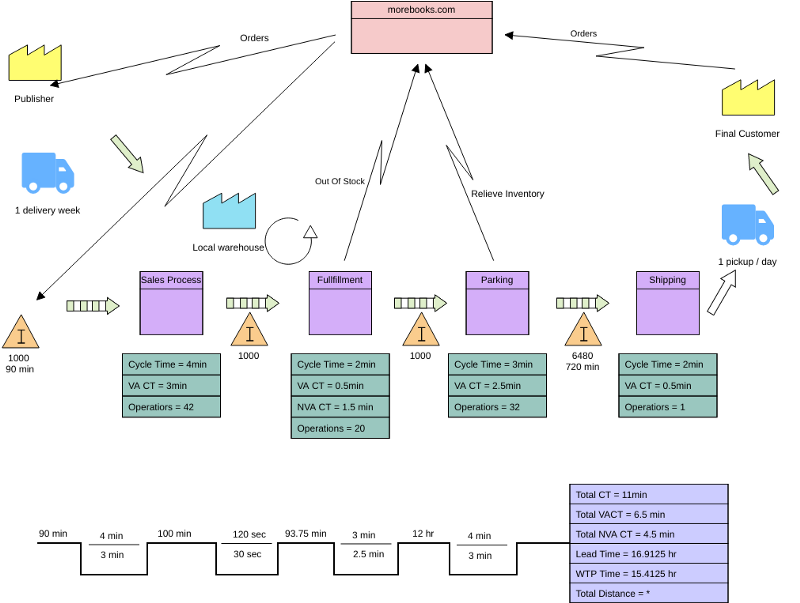
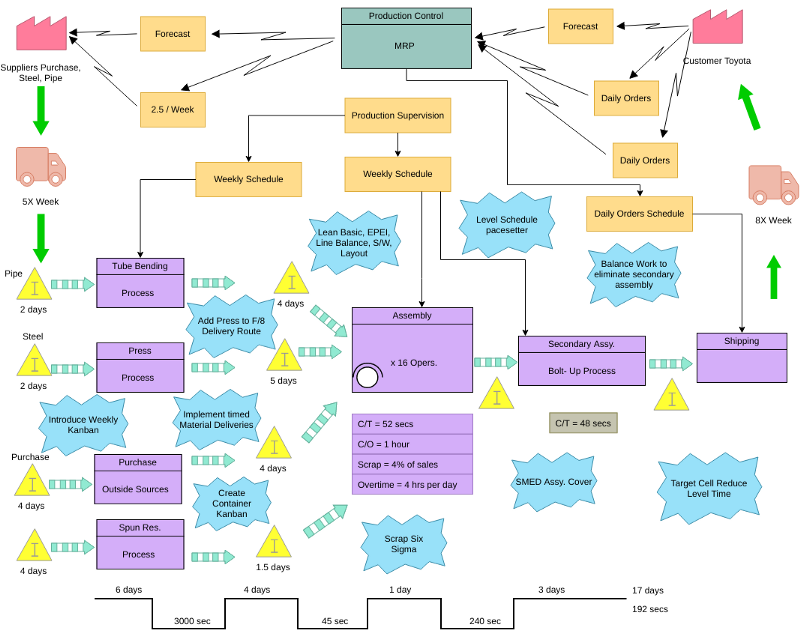
Value Stream Analysis Example — Production Control

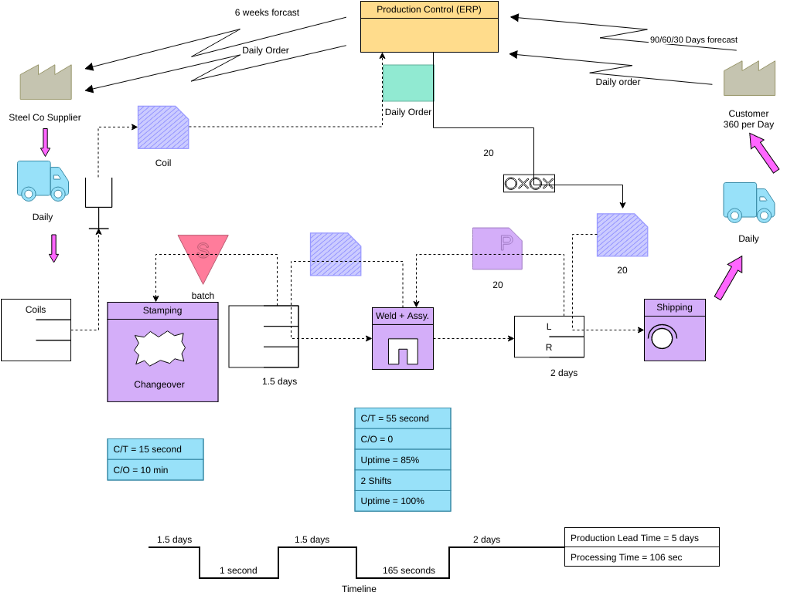
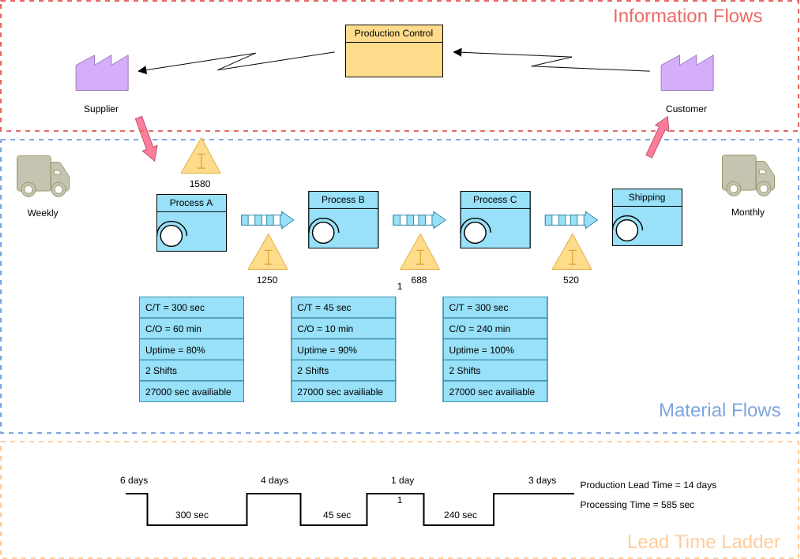
Value Stream Mapping — Other Example
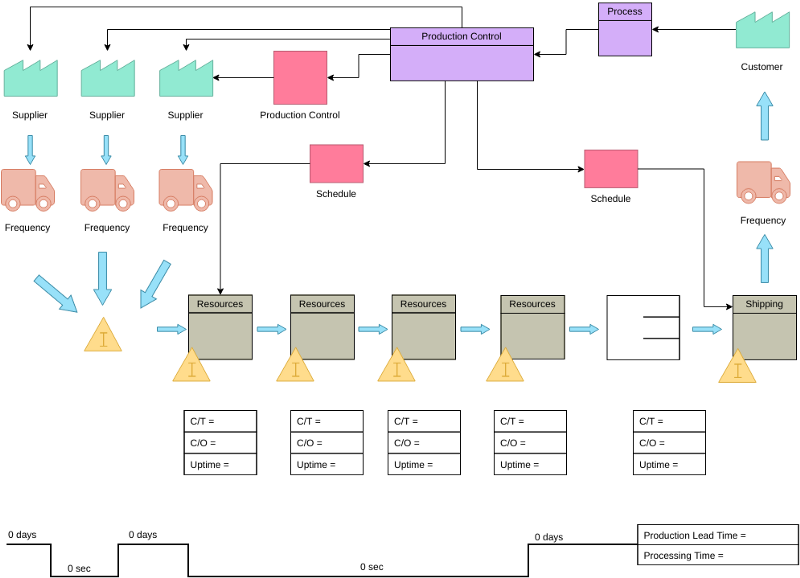
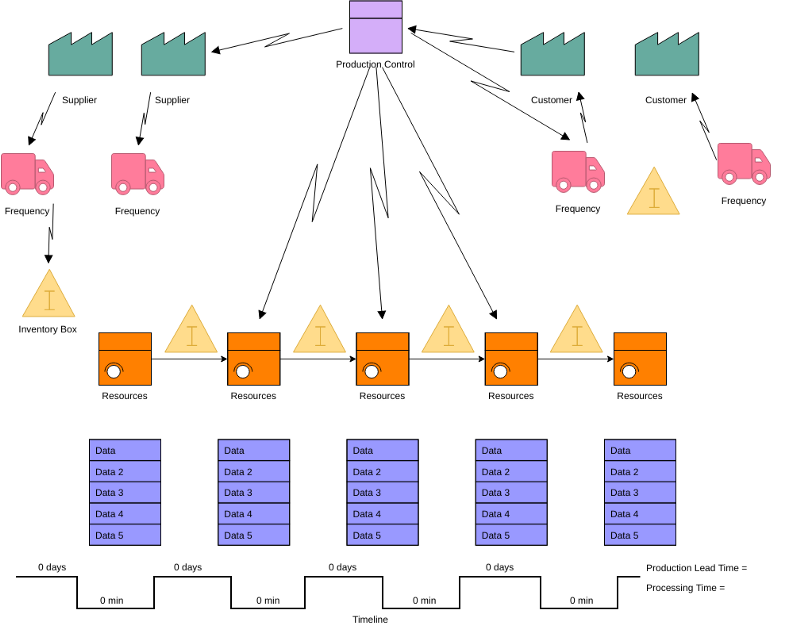
Value stream maps can be created by following the steps below:
- The first step in value stream mapping is drawing of the PROCESS BOXES for the different process steps, starting from the supplier side going up to the customer side in the information flows area.
- The Second Step draw the different types of process boxes for different kind of production steps under the information flow section called Material flows.
- The third step in value stream mapping is DATABOXES just under each of the process (or production steps), in which data is captured of each of the process steps drawn in the map. Information that might be interesting for VSM design can be put here.
- The fourth step is to draw the CONNECTION METHODS between the process boxes.
- Step fifth step describes linking CUSTOMERS AND SUPPLIERS to the process.
- Step five is the LEAD TIME LADDER on the bottom of the VSM, which shows different aspects of time in the value stream.
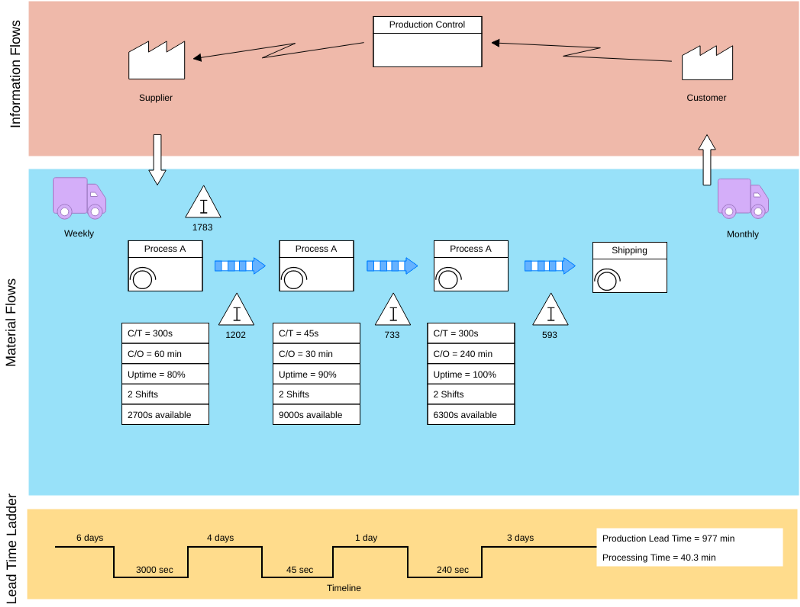
The example below shows what a typical value stream map might look like:

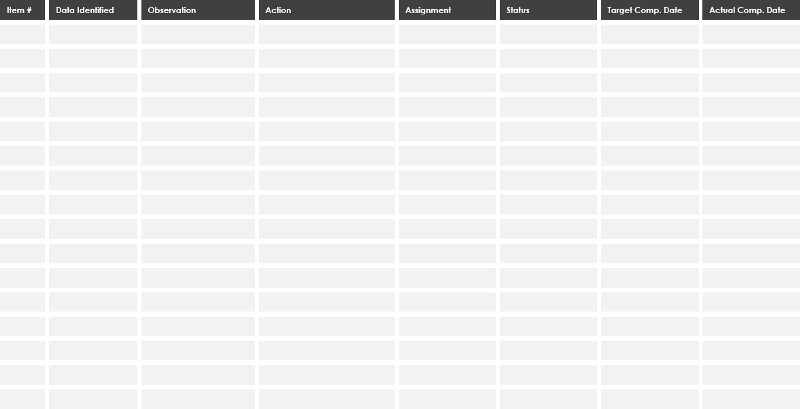
Developing a Continuous Implementation Plan
VSM helps users create a solid implementation plan that will maximize their available resources and help ensure that materials and time are used efficiently. Based on the information the future map provided, we can now develop an implementation plan for the actions needed to get from the current state to the future state. Here is a generic template provided as following:
Components of Value Stream Mapping
Symbols / Description

Customer/Supplier: represents the Supplier when in the upper left, the customer when in the upper right, the usual endpoint for material

Dedicated Process Flow: a process, operation, machine or department, through which material flows. It represents one department with a continuous, internal fixed flow.

Shared Process: a process, operation, department, or 11 Shared Process: a process, operation, or department that other value stream families share.

Data Box: it contains significant information/data required for analyzing and observing the system.

Work Cell: indicates that multiple processes are integrated into a manufacturing work Cell.

Inventory: show inventory between two processes

Shipments: represents the movement of raw materials from suppliers to the Receiving dock/s of the factory. Or, the movement of finished goods from the Shipping dock/s of the factory to the customers

Push Arrow: represents the “pushing” of material from one process to the next process.

Supermarket: an inventory “supermarket”.

Material Pull: supermarkets connect to downstream processes with this “Pull” that indicates physical removal.

FIFO Lane: First-In-First-Out inventory. Use It when processes are connected with a FIFO system that limits input.

Safety Stock: represents an inventory “hedge” (or safety stock) against problems such as downtime, to protect the system against sudden fluctuations in customer orders or system failures.

External Shipment: shipments from suppliers or to customers using external transport

Production Control: this box represents a central production scheduling or control department, person or operation.

Manual Info: a straight, thin arrow shows the general flow of information from memos, reports, or conversation. Frequency and other notes may be relevant.

Electronic Info: this wiggle arrow represents electronic flow 14 such as electronic data interchange (EDI), the Internet, Intranets, LANs (local area network), WANs (wide area network). You may indicate the frequency of information/data interchange, the type of media used ex. fax, phone, etc. and the type of data exchanged.

Production Kanban: it triggers the production of a predefined number of parts. It signals a supplying process to provide parts to a downstream process.

Withdrawn Kanban: it represents a card or device that instructs a material handler to transfer parts from a supermarket to the receiving process. The material handler (or operator) goes to the supermarket and withdraws the necessary items.

Signal Kanban: used whenever the on-hand inventory levels in the supermarket between two processes drop to a trigger or minimum point. It is also referred to as “one-per-batch” Kanban.

Kanban Post: a location where Kanban signals reside for pickup. Often used with two-card systems to exchange withdrawal and production Kanban.

Sequence Pull: represents a pull system that gives instruction 15 to subassembly processes to produce a predetermined type and quantity of product, typically one unit, without using a supermarket.

Load Leveling: a tool to batch Kanban to level the production volume and mix over some time.

Go See Production: the gathering of information through visual means

Verbal Information: represents verbal or personal information flow

Kaizen: used to highlight improvement needs and plan kaizen workshops at specific processes that are critical to achieving the Future State Map of the value stream.

Operator: represents an operator. It shows the number of operators required to process the VSM family at a particular workstation.

Other Information: other useful or potentially useful information.

Timeline: shows value-added times (Cycle Times) and nonvalue added (wait) times. Use this to calculate Lead Time and Total Cycle Time.
Value Stream Map Terminology
- C/T (Cycle Time): Processor Cycle Time = Time To Complete A Task.
- P/T Or C/O (Changeover Time): The Non-Value-Added Time Required To Convert A Line From One Product To Another Changeover Time Or Setup Time To Begin A New Task.
- VA (Value Added Task): Value-Added Time Or The Time Needed To Complete A Required Task.
- NVA (None Value Added Task): Non-Value-Added Time = PT — VAT.
- L/T (Lead Time): Lead Time, Or The Total Time From When A Task Is Started Within A Work Center Until It Leaves The Work Center.
- FTT (First Time Through): First Time Quality Or First Time Through Quality Yield.
- T/T (Takt Time): The Average Unit Production Time Needed To Meet Customer Demand.
- Capacity: A Metric That Indicates How Many Parts Per Day Your Slowest Process Can Handle.
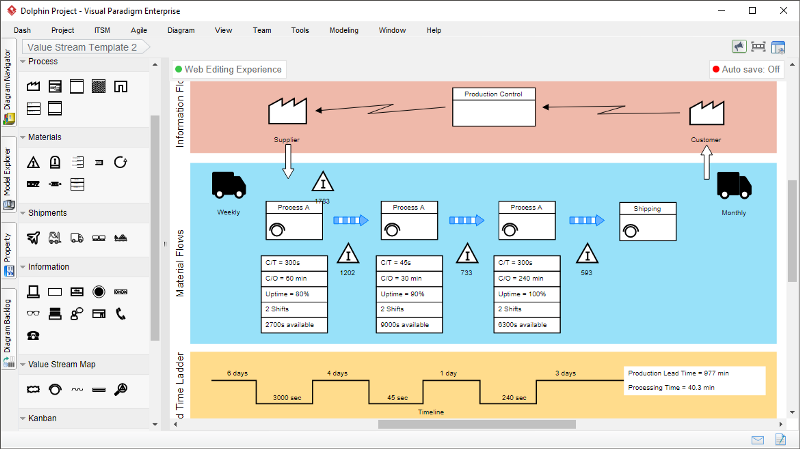
Value Stream Mapping Tool
Looking for VSM software? Visual Paradigm value stream mapping software can easily and quickly create professional value stream mapping. The value stream mapping tool comes with a rich set of value stream mapping symbols. With a drag and drop VSM editor and a powerful feature set, you can easily create professional value stream maps.
Learn by Examples — Value Stream Mapping Templates
You can try and edit them online by clicking on the example link below:
This post is also available in Deutsch, Español, فارسی, Français, English, Bahasa Indonesia, 日本語, Polski, Portuguese, Ру́сский, Việt Nam, 简体中文 and 繁體中文.