


PERT Chart is acronym for (Program Evaluation and Review Technique). A PERT chart is a project management tool used to schedule, organize, and coordinate tasks within a project. It is basically a method to analyze the tasks involved in completing a given project, especially the time needed to complete each task, and to identify the minimum time needed to complete the total project.
What is a PERT Chart?
The main objective of PERT is to facilitate decision making and to reduce both the time and cost required to complete a project. PERT is intended for very large-scale, one-time, non-routine, complex projects with a high degree of inter-task dependency, projects which require a series of activities, some of which must be performed sequentially and others that can be performed in parallel with other activities.
PERT is a method of analyzing the tasks involved in completing a given project, especially the time needed to complete each task, and to identify the minimum time needed to complete the total project.
PERT in project management has been around for a while, but it in fact was developed in the U.S. Navy. In 1957, its Special Projects Office created the PERT chart to assist in its Polaris nuclear submarine project. Since then, it’s found a home in all manner of industries, even the 1968 Winter Olympics in Grenoble.
PERT Chart Notations
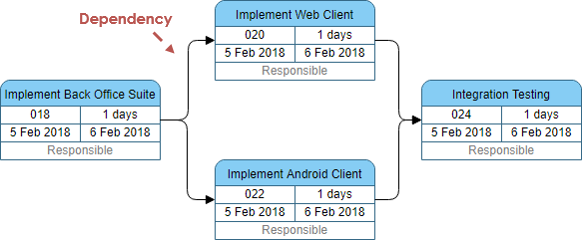
Task
In Visual Paradigm, a Task has:
- Task Name
- Task ID
- Duration
- Start Date and End Date
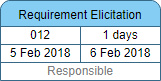
Dependency
Links connect project tasks to indicate the time dependency relationship among them, that is, when the preceding task is completed, the succeeding task can start.
Enhanced PERT Chart Features
Visual Paradigm enhanced the basic PERT chart notation by adding two powerful project management features:
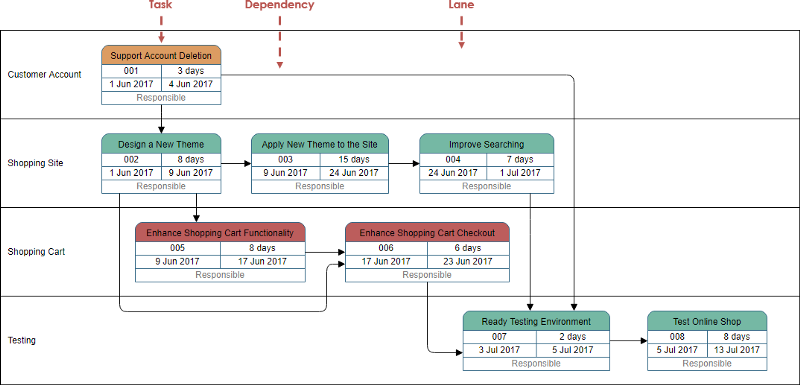
- Lanes — for partitioning tasks based on categories like the party who is responsible for what (tasks) in the PERT Chart.
- Automated Task Assignment and Management — for assigning tasks in the PERT Chart to the Visual Paradigm’s Task Manager — Tasifier.
Lane
A lane allows you to arrange your Pert Chart into horizontal zones separated by lines. Each zone represents the responsibilities of the particular class, worker or any concepts which the group of tasks it is responsible for.
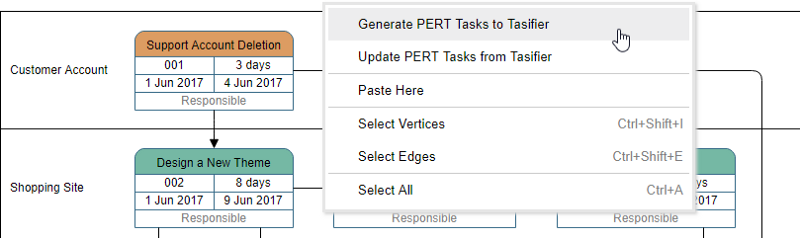
Assign PERT Tasks to Tasifier
In addition to the functions of an ordinary PERT Chart, the Enhanced PERT Chart tool embedded four major features for integrating with different processes with Tasifier, the Task Management tool:
- Selection of Responsible person (associate the task who responsible for)
- Task to Task Manager (Visual Paradigm Tasifier)
When to Draw PERT Chart
Project managers can use PERT charts to solve the following problems:
- Plan a realistic timetable for project completion.
- Identify critical path — since the path leads to the minimum time the project requires, any delays to these tasks will impact the completion of the overall project.
- Identify tasks that can be carried out concurrently.
- Identify tasks that need to be compressed if the overall project time needs to be reduced.
- Identify slack time where certain tasks are not as time-critical to the overall deadline.
How to Draw a PERT Chart?
PERT planning involves the following steps:
- Identify the specific activities and milestones.
- Determine the proper sequence of the activities.
- Construct a PERT diagram.
- Estimate the time required for each activity.
- Determine the critical path.
- Update the PERT chart as the project progresses.
PERT Chart Examples
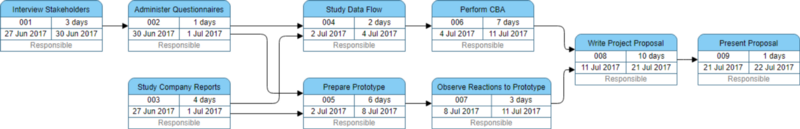
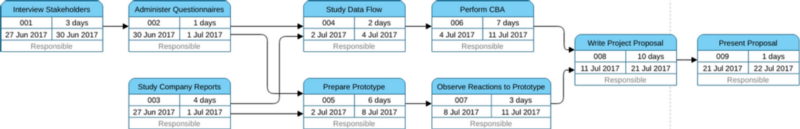
Project Preparation Example — The following PERT Chart shows:
Suppose a systems analyst is trying to set up a realistic schedule for the data gathering and proposal phases of the systems analysis and design life cycle. The systems analyst looks over the situation and lists activities that need to be accomplished along the way, and formed a PERT Chart as follows:
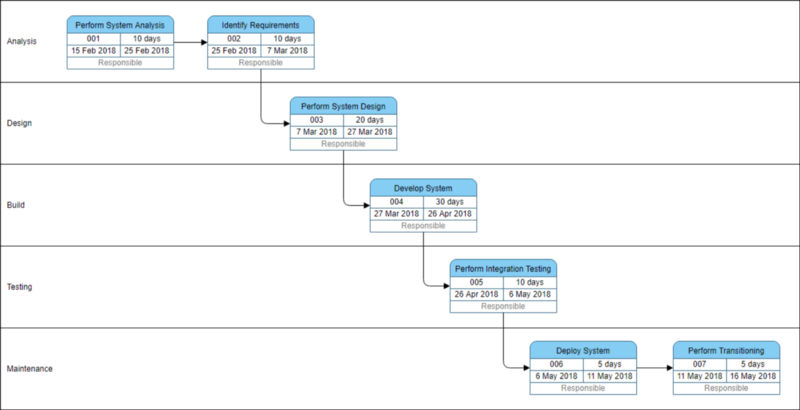
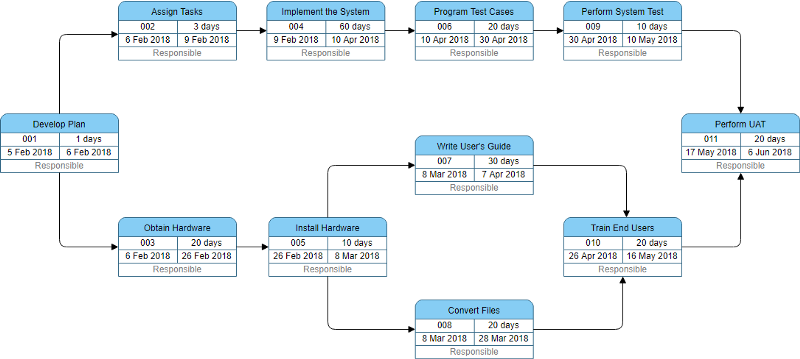
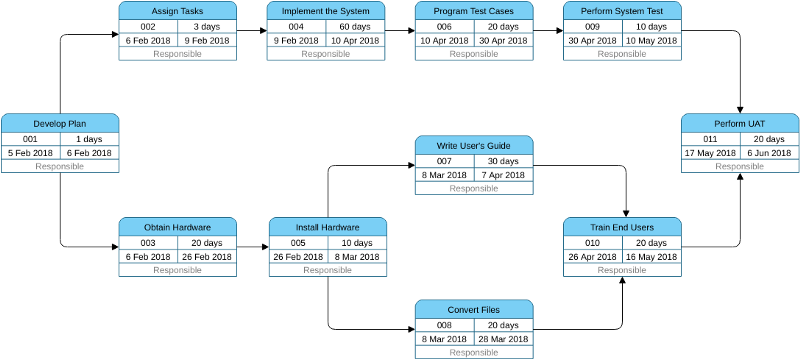
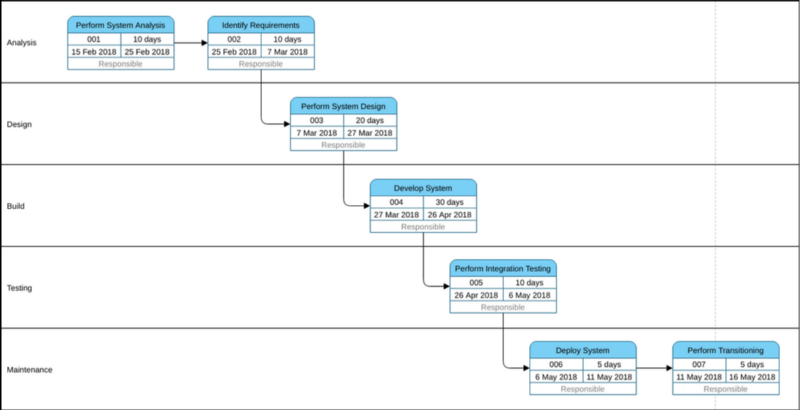
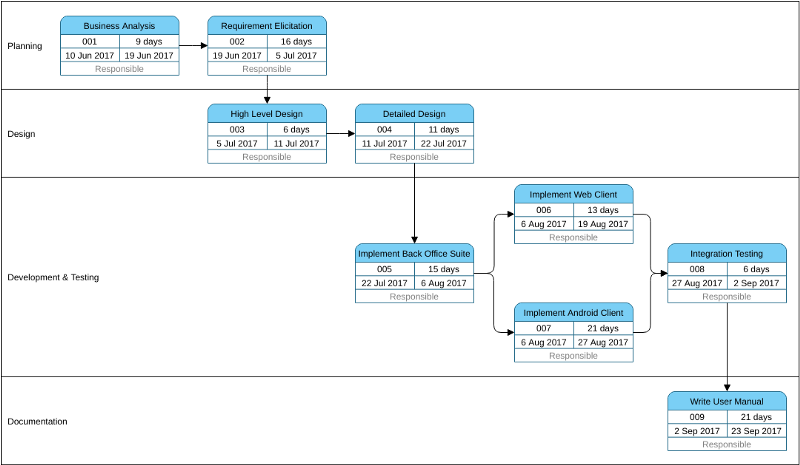
Software Development Template — The PERT Chart example below shows:
A generic template for software project management from analysis, design, build and test with phase in the lane.
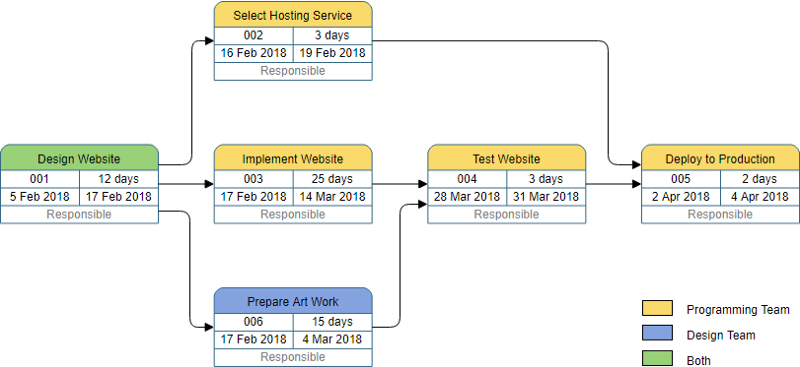
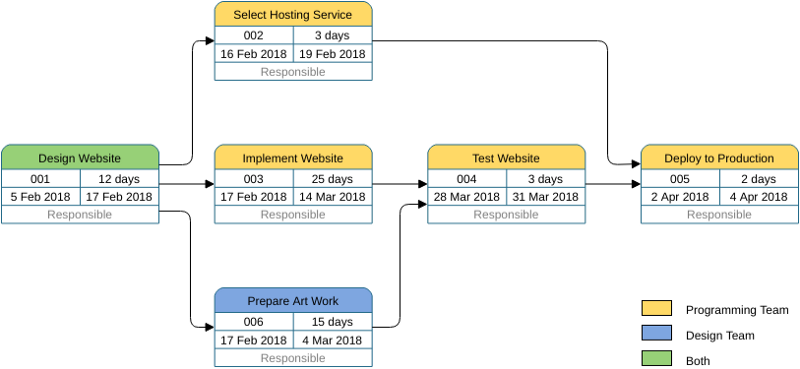
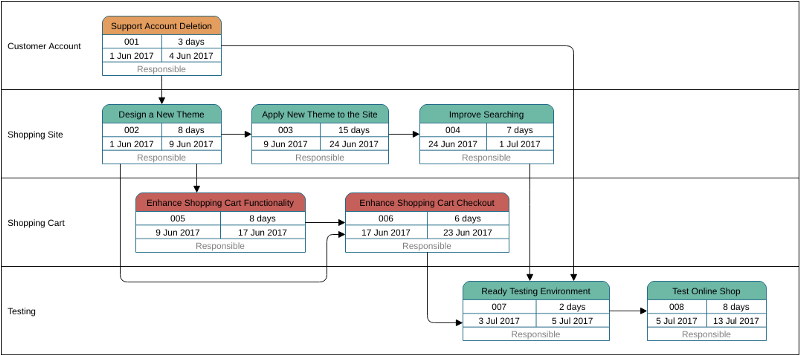
Website Creation Example — The following PERT Chart example below shows:
The PERT Chart shows the tasks involved in the process for creating a website, which includes, select hosting services, design website, writing HTML, artwork design, and etc.
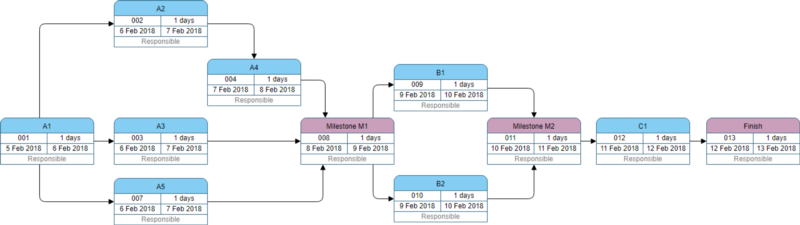
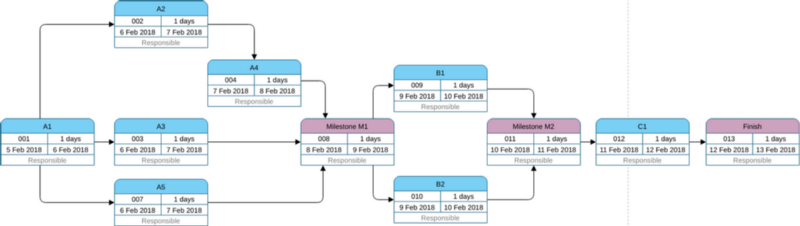
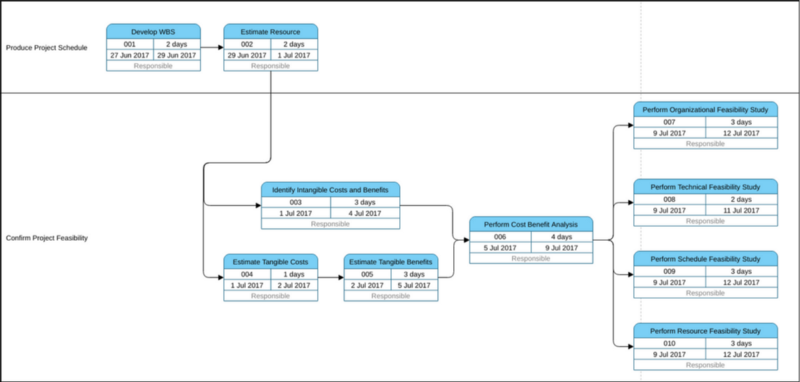
PERT Template — Task with Milestones:
PERT Chart Example — Project Management:
Pert Chart Templates
Develop PERT Chart from Structure Task List
Enhanced Pert Chart for Task Management Automation
More About Pert Chart
This post is also available in Deutsch, Español, فارسی, Français, English, Bahasa Indonesia, 日本語, Polski, Portuguese, Ру́сский, Việt Nam, 简体中文 and 繁體中文.