


Introduction
In today’s fast-paced business environment, clear communication of complex processes is essential for organizational success. Traditional flowcharts often become unwieldy when dealing with multi-layered operations, making it difficult for stakeholders to grasp both the big picture and intricate details simultaneously. Enter stepwise flowcharts—a revolutionary approach to process visualization that segments workflows into logical, color-coded phases while maintaining precise flow elements, decision nodes, and action steps.
This comprehensive guide will walk you through everything you need to know about stepwise flowcharts, from understanding their fundamental concepts to creating professional diagrams using Visual Paradigm’s AI-powered tools. Whether you’re a business analyst, product manager, customer support leader, or software engineer, mastering this visualization technique will transform how you document and communicate processes within your organization.
What Is a Stepwise Flowchart?
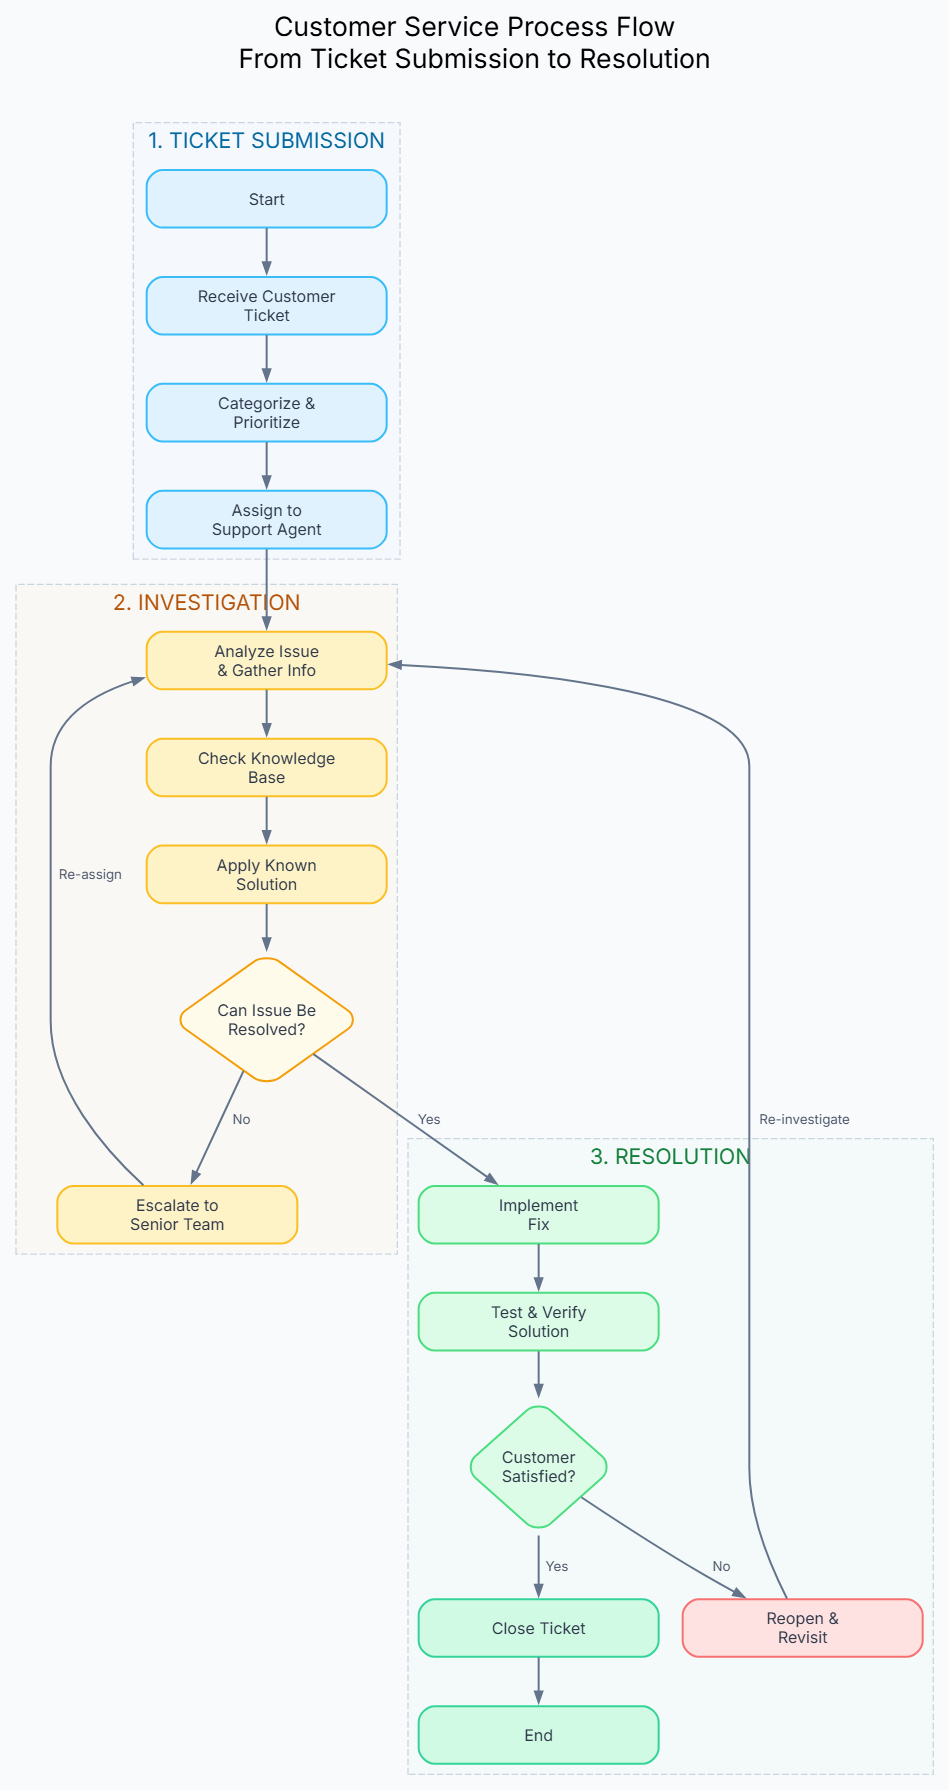
Traditional flowcharts can sometimes become cluttered and difficult to parse when dealing with multi-layered operations. To solve this challenge, Visual Paradigm invented the stepwise flowchart—a specialized layout that segments a complete process into logical phases or clusters before filling them in with precise flow elements, decision nodes, and action steps.
By grouping process steps into distinct operational zones, readers can instantly grasp the macro-structure of a workflow without getting lost in the details. This makes the stepwise flowchart an exceptional tool for business analysts, product managers, customer support leaders, and software engineers looking for a reliable process workflow visualization tool.
Key Characteristics
- Phased Organization: Processes are divided into distinct, color-coded operational clusters
- Visual Hierarchy: Each phase is clearly labeled and visually separated
- Decision Integration: Decision points are seamlessly integrated within phases
- Scalable Detail: You can see both high-level structure and granular steps simultaneously
Real-World Example: Customer Service Process Flow
To see how powerful this feature is in practice, let’s look at a real-world scenario generated entirely through a simple conversational prompt in our AI assistant: “Generate a stepwise flowchart for a customer service process.”
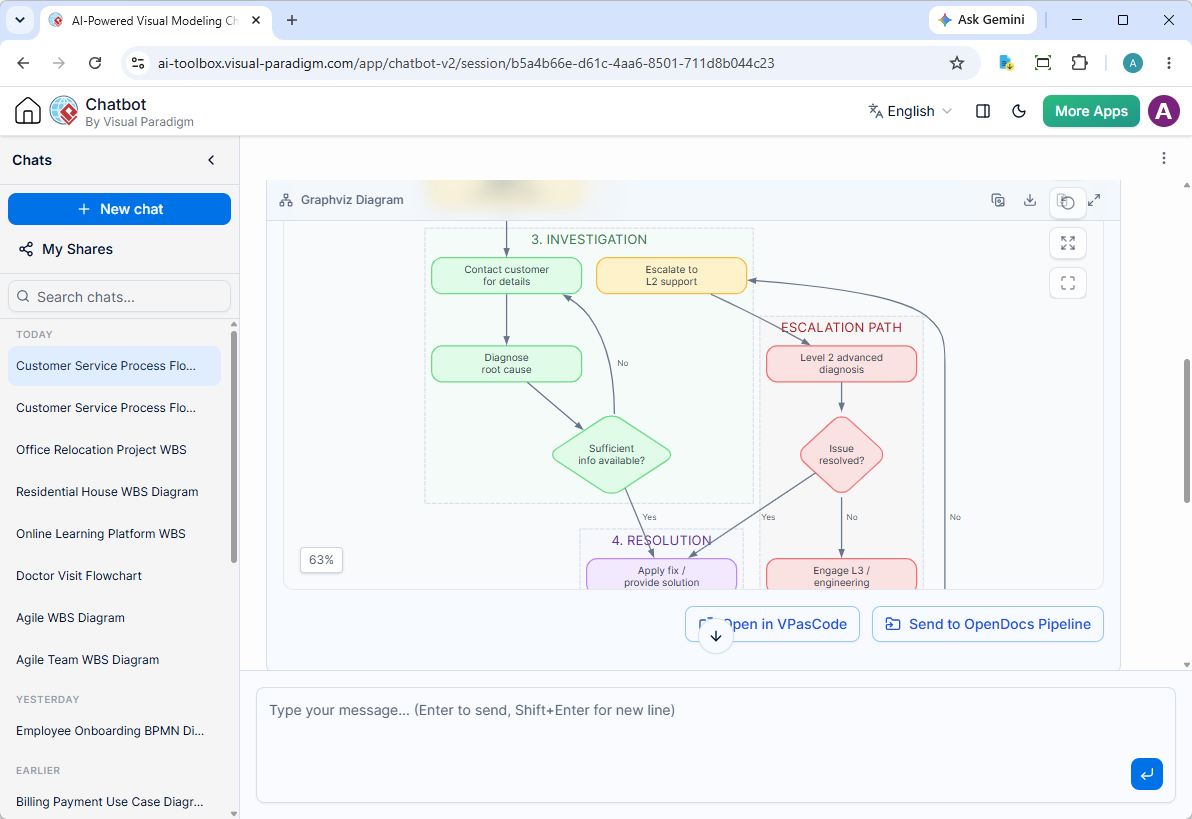
The resulting diagram organizes the end-to-end customer support lifecycle into distinct, color-coded operational clusters:
- 1. Ticket Submission: Captures initial customer contact via web, email, or phone, logging the inquiry directly into the CRM system.
- 2. Triage & Assignment: Automatically categorizes priority levels (P1 to P4) and routes the ticket to the appropriate available agent.
- 3. Investigation: Involves contacting the customer for further details, running root-cause diagnoses, and routing unresolved issues through specific escalation paths if initial information is insufficient.
- 4. Resolution: Applies fixes, implements solutions, and verifies success directly with the customer.
- 5. Closure: Triggers automated satisfaction surveys, updates internal knowledge base articles, and officially closes the ticket.
- 6. Escalation Path: Manages advanced Level 2 diagnoses and Level 3 engineering interventions for complex technical hurdles.
You can review the live interactive chat session where this workflow was created by visiting the Visual Paradigm AI Chatbot Share Session.
Detailed Case Study: Service Outage Timeline
Let’s examine a more complex example that demonstrates decision points and escalation paths in action. This flowchart was generated using the following prompt:
Prompt: “Generate a timeline flowchart for the July 15 outage showing:
- 14:30: Monitoring alert
- 14:32: On-call notified
- 14:35: Initial diagnosis
- 14:45: Rollback initiated
- 15:00: Service restored
Include decision points and escalation paths”
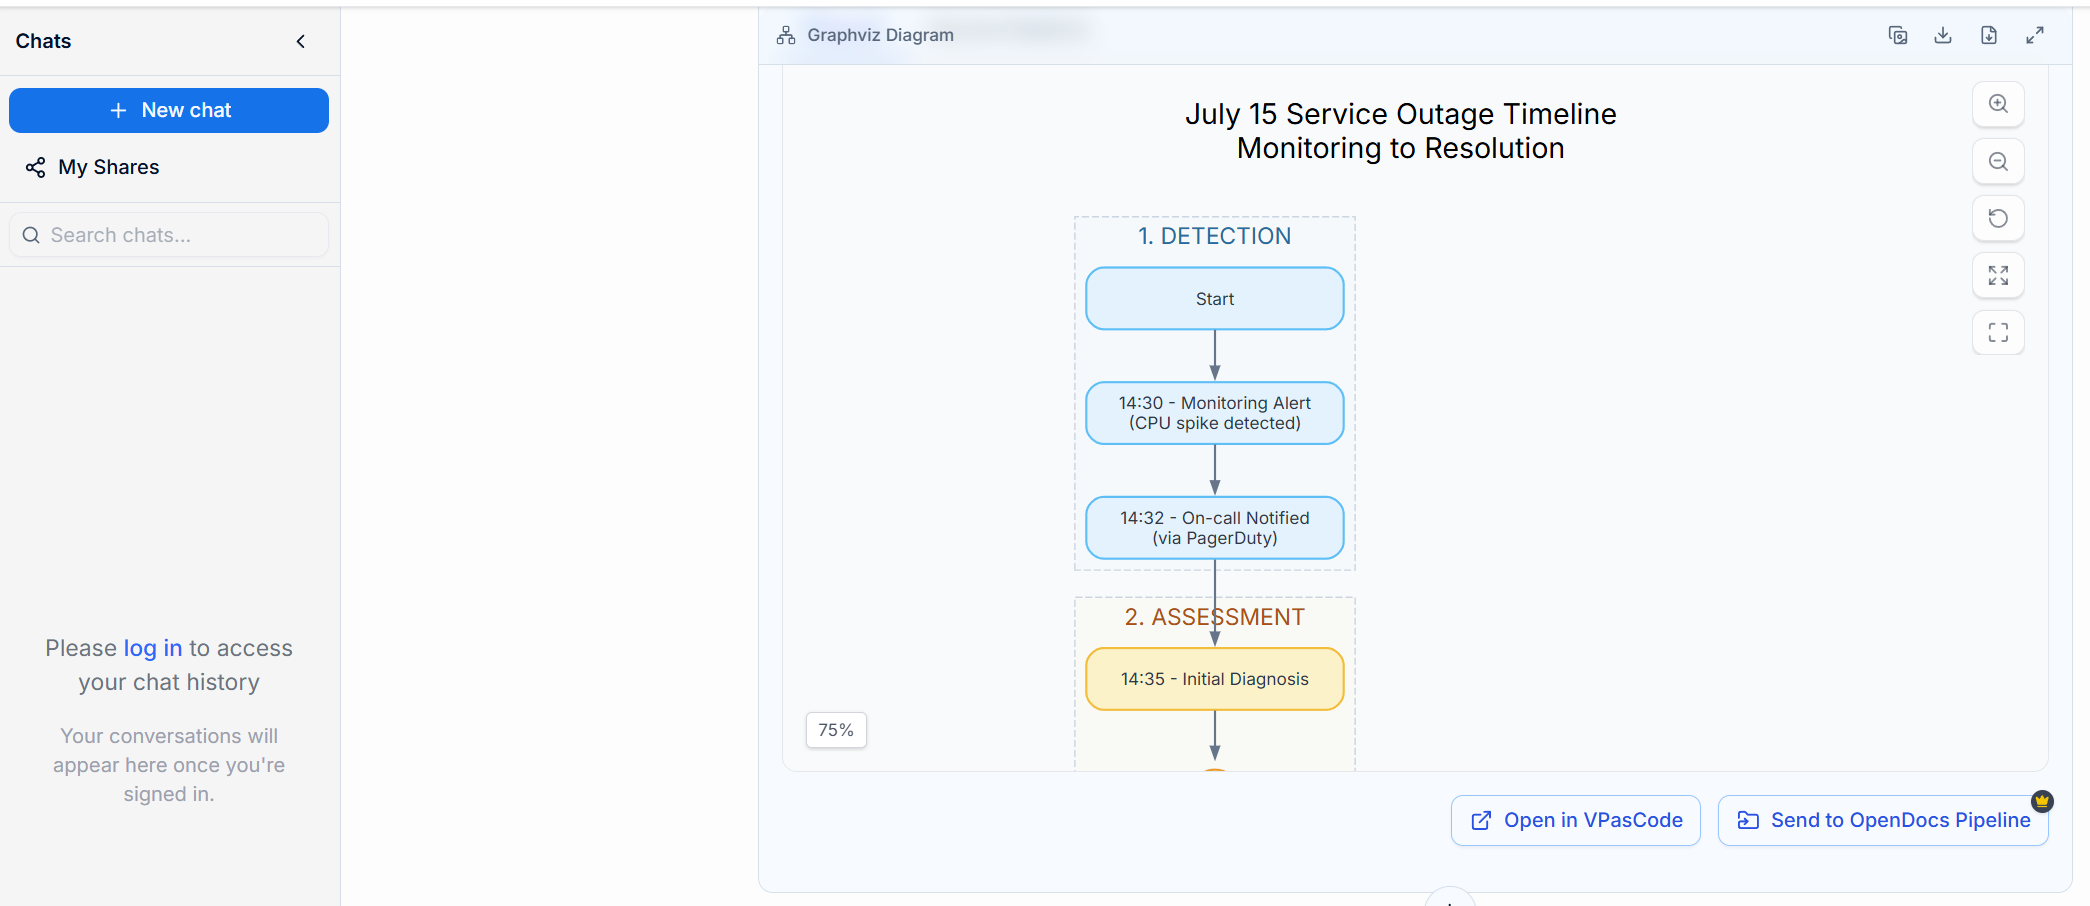
This comprehensive diagram demonstrates five distinct phases:
Phase 1: Detection (Blue)
- 14:30 – Monitoring Alert triggered by CPU spike detection
- 14:32 – On-call engineer notified via PagerDuty
Phase 2: Assessment (Yellow)
- 14:35 – Initial Diagnosis begins
- Decision Point: Confirmed Outage?
- No → False Alarm (log for review)
- Yes → Proceed to escalation
Phase 3: Escalation (Purple)
- Decision Point: Critical Severity?
- Yes → Escalate to Senior Engineer (14:38)
- No → Direct to root cause analysis
- 14:40 – Root Cause Identified (Faulty deployment v2.1.3)
- Decision Point: Rollback or Hotfix?
Phase 4: Resolution (Green)
- 14:45 – Rollback Initiated (Revert to v2.1.2)
- 14:50 – Verification Checks (Health endpoints)
- Decision Point: Verification Passed?
- No → Re-check and return to root cause
- Yes → 15:00 Service Restored
Phase 5: Follow-Up (Pink)
- 15:05 – Post-Mortem Initiated (RCA documentation)
- Resolved
Understanding the Source Code
Here’s the Graphviz code that generates this professional diagram:
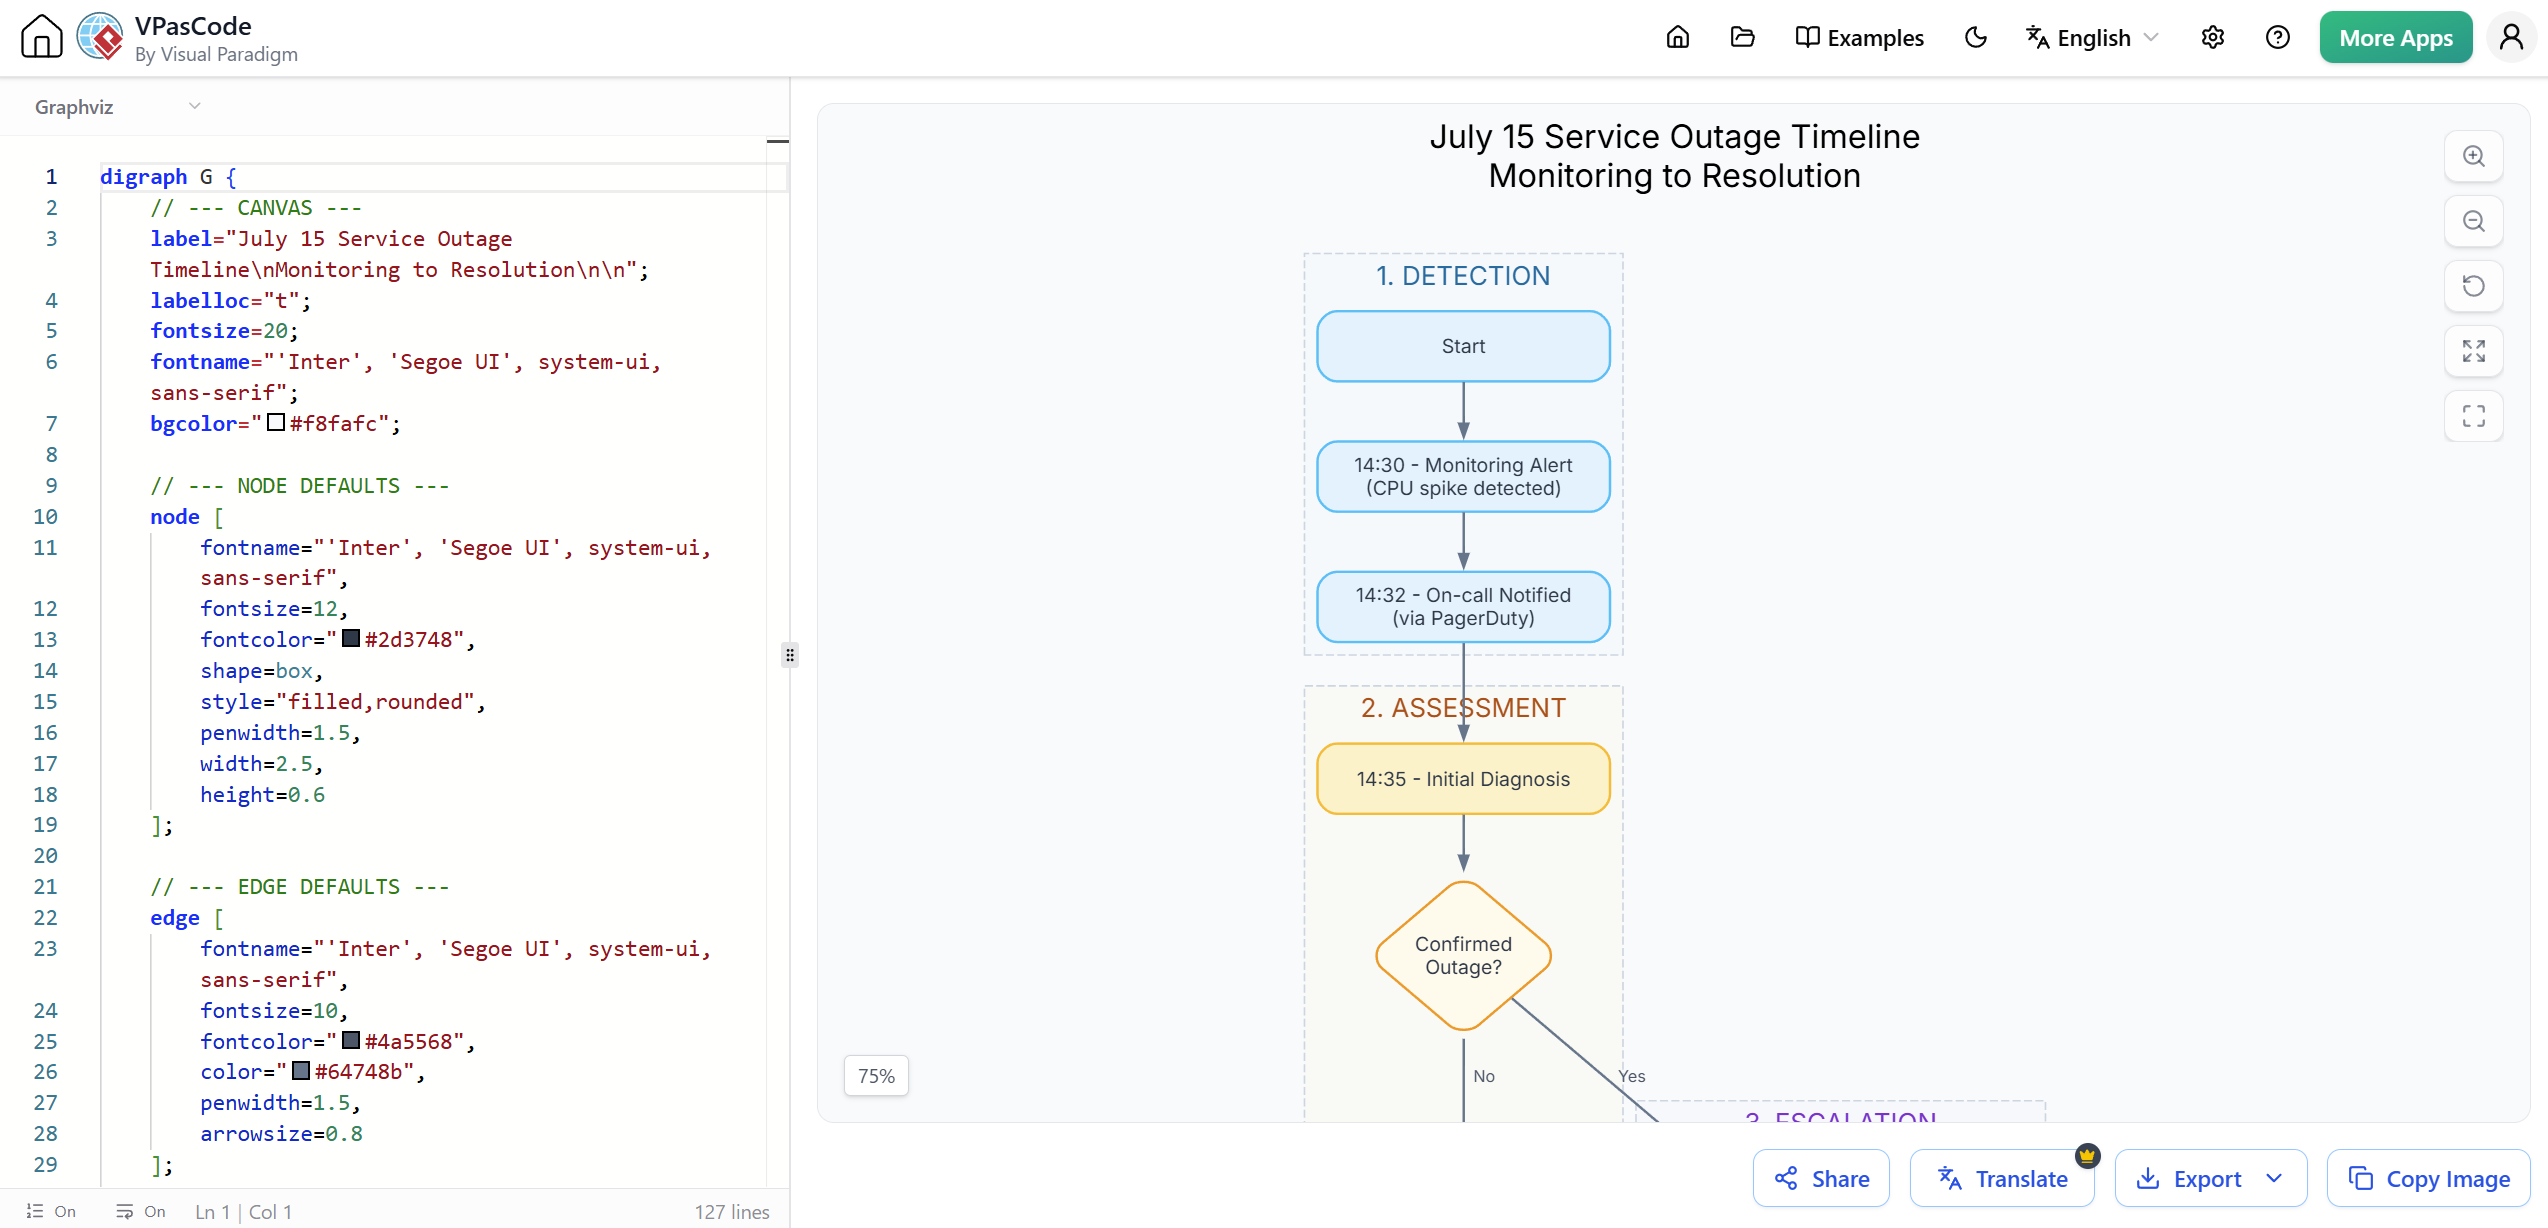
digraph G {
    // --- CANVAS ---
    label="July 15 Service Outage Timeline\nMonitoring to Resolution\n\n";
    labelloc="t";
    fontsize=20;
    fontname="'Inter', 'Segoe UI', system-ui, sans-serif";
    bgcolor="#f8fafc";

    // --- NODE DEFAULTS ---
    node [
        fontname="'Inter', 'Segoe UI', system-ui, sans-serif",
        fontsize=12,
        fontcolor="#2d3748",
        shape=box,
        style="filled,rounded",
        penwidth=1.5,
        width=2.5,
        height=0.6
    ];

    // --- EDGE DEFAULTS ---
    edge [
        fontname="'Inter', 'Segoe UI', system-ui, sans-serif",
        fontsize=10,
        fontcolor="#4a5568",
        color="#64748b",
        penwidth=1.5,
        arrowsize=0.8
    ];

    // --- PHASE 1: DETECTION ---
    subgraph cluster_0 {
        style=dashed;
        color="#cbd5e1";
        bgcolor="#e0f2fe22";
        label="1. DETECTION";
        fontcolor="#0369a1";
        fontsize=16;

        Start [label="Start", fillcolor="#e0f2fe", color="#38bdf8"];
        Monitoring [label="14:30 - Monitoring Alert\n(CPU spike detected)", fillcolor="#e0f2fe", color="#38bdf8"];
        Oncall [label="14:32 - On-call Notified\n(via PagerDuty)", fillcolor="#e0f2fe", color="#38bdf8"];
    }

    // --- PHASE 2: ASSESSMENT ---
    subgraph cluster_1 {
        style=dashed;
        color="#cbd5e1";
        bgcolor="#fef3c722";
        label="2. ASSESSMENT";
        fontcolor="#b45309";
        fontsize=16;

        Triage [label="14:35 - Initial Diagnosis", fillcolor="#fef3c7", color="#fbbf24"];
        Dec1 [label="Confirmed\nOutage?", shape=diamond, fillcolor="#fffbeb", color="#f59e0b", width=1.4, height=1.4];
        FalseAlarm [label="False Alarm\n(Log for review)", fillcolor="#fee2e2", color="#f87171"];
    }

    // --- PHASE 3: ESCALATION ---
    subgraph cluster_2 {
        style=dashed;
        color="#cbd5e1";
        bgcolor="#f3e8ff22";
        label="3. ESCALATION";
        fontcolor="#7e22ce";
        fontsize=16;

        Dec2 [label="Critical\nSeverity?", shape=diamond, fillcolor="#f3e8ff", color="#c084fc", width=1.4, height=1.4];
        SeniorEng [label="14:38 - Escalate to\nSenior Engineer", fillcolor="#f3e8ff", color="#c084fc"];
        RootCause [label="14:40 - Root Cause Identified\n(Faulty deployment v2.1.3)", fillcolor="#f3e8ff", color="#c084fc"];
        Dec3 [label="Rollback or\nHotfix?", shape=diamond, fillcolor="#f3e8ff", color="#c084fc", width=1.4, height=1.4];
    }

    // --- PHASE 4: RESOLUTION ---
    subgraph cluster_3 {
        style=dashed;
        color="#cbd5e1";
        bgcolor="#dcfce722";
        label="4. RESOLUTION";
        fontcolor="#15803d";
        fontsize=16;

        Rollback [label="14:45 - Rollback Initiated\n(Revert to v2.1.2)", fillcolor="#dcfce7", color="#4ade80"];
        Verify [label="14:50 - Verification Checks\n(Health endpoints)", fillcolor="#dcfce7", color="#4ade80"];
        Dec4 [label="Verification\nPassed?", shape=diamond, fillcolor="#dcfce7", color="#4ade80", width=1.4, height=1.4];
        Restore [label="15:00 - Service Restored\n(All systems green)", fillcolor="#d1fae5", color="#34d399"];
    }

    // --- PHASE 5: FOLLOW-UP ---
    subgraph cluster_4 {
        style=dashed;
        color="#cbd5e1";
        bgcolor="#fce7f322";
        label="5. FOLLOW-UP";
        fontcolor="#be185d";
        fontsize=16;

        PostMortem [label="15:05 - Post-Mortem Initiated\n(RCA documentation)", fillcolor="#fce7f3", color="#f472b6"];
        End [label="Resolved", fillcolor="#fce7f3", color="#f472b6"];
    }

    // --- FLOW ---
    Start -> Monitoring;
    Monitoring -> Oncall;
    Oncall -> Triage;
    Triage -> Dec1;

    Dec1 -> FalseAlarm [label="  No"];
    FalseAlarm -> End;
    Dec1 -> Dec2 [label="  Yes"];

    Dec2 -> SeniorEng [label="  Yes"];
    Dec2 -> RootCause [label="  No"];
    SeniorEng -> RootCause;
    RootCause -> Dec3;

    Dec3 -> Rollback [label="  Rollback"];
    Dec3 -> Rollback [label="  Hotfix"];

    Rollback -> Verify;
    Verify -> Dec4;
    Dec4 -> Restore [label="  Yes"];
    Dec4 -> RootCause [label="  No - Re-check"];
    Restore -> PostMortem;
    PostMortem -> End;
}
Beginner’s Tutorial: Creating Your First Stepwise Flowchart
Step 1: Access the Visual Paradigm AI Chatbot
Start by navigating to the Visual Paradigm AI Chatbot Tool. This conversational interface allows you to create professional diagrams through simple text prompts.
Step 2: Craft Your Prompt
Be specific about what you want. Here are some effective prompt structures:
Basic Structure:
"Generate a stepwise flowchart for [process name] showing:
- Phase 1: [activities]
- Phase 2: [activities]
- Include decision points for [specific decisions]
- Show escalation paths for [scenarios]"
Example Prompts:
- Pizza Ordering Process:
"Generate a stepwise flowchart diagram for a Pizza ordering process" - Employee Onboarding:
"Create a stepwise flowchart for employee onboarding showing: - Day 1: Orientation and paperwork - Week 1: Training and system setup - Month 1: Mentoring and integration Include decision points for background check approval" - Software Deployment:
"Generate a stepwise flowchart for software deployment pipeline:
- Code commit
- Automated testing
- Staging deployment
- Production release
Include rollback scenarios and approval gates"
Step 3: Review and Refine
The AI will generate your initial diagram. Review it carefully and request modifications through conversation:
- “Add more detail to Phase 2”
- “Change the color scheme to blue tones”
- “Add a decision point for budget approval”
- “Include a parallel process for quality assurance”
Step 4: Edit in VPasCode
For advanced customization, click the Open in VPasCode button below the diagram viewer. This transitions your workflow into the diagram-as-code platform where you can:
- Fine-tune the text code directly
- Adjust colors, fonts, and layouts
- Add custom styling
- Export professional-grade images
Changes render immediately on the live viewer, making iteration fast and efficient.
Step 5: Document and Share
Need to incorporate your flowchart into comprehensive technical documentation? Use the Send to OpenDocs Pipeline feature:
- Click on the Send to OpenDocs Pipeline option
- Open the Pipeline pane inside OpenDocs
- Drag your workflow directly onto your documentation page
This seamless integration ensures your diagrams stay synchronized with your documentation.
Key Enhancements & Ecosystem Integration
Generating your workflow is only the beginning. Visual Paradigm provides a complete ecosystem to help you refine, edit, and publish your diagrams seamlessly across your organization.
1. Iterative Touch-ups Through Conversation
Rarely is a perfect diagram created in a single pass. With the Visual Paradigm AI Diagramming Chatbot, you can easily converse with the assistant to request real-time modifications, adjustments, or additions to your layout.
Example Conversation:
- You: “Add a parallel QA validation step in Phase 4”
- AI: Updates diagram with QA checkpoint
- You: “Make the escalation path more prominent with red coloring”
- AI: Adjusts color scheme
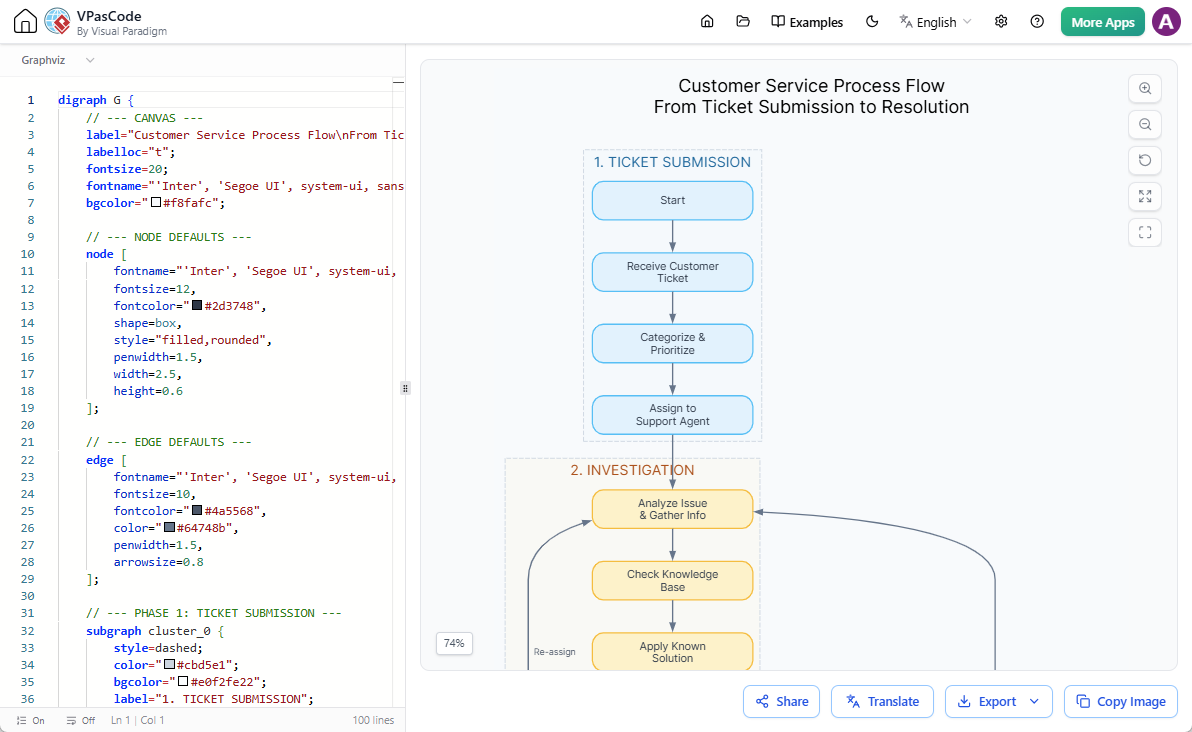
2. Direct Editing in VPasCode
Thanks to deep integration with VPasCode, you are never locked into a static image. Simply click on the Open in VPasCode button located directly below the diagram viewer. This transitions your workflow into our robust diagram-as-code platform, allowing you to fine-tune the text code instantly. Changes render immediately on the live viewer, and you can export professional-grade images with effortless ease.
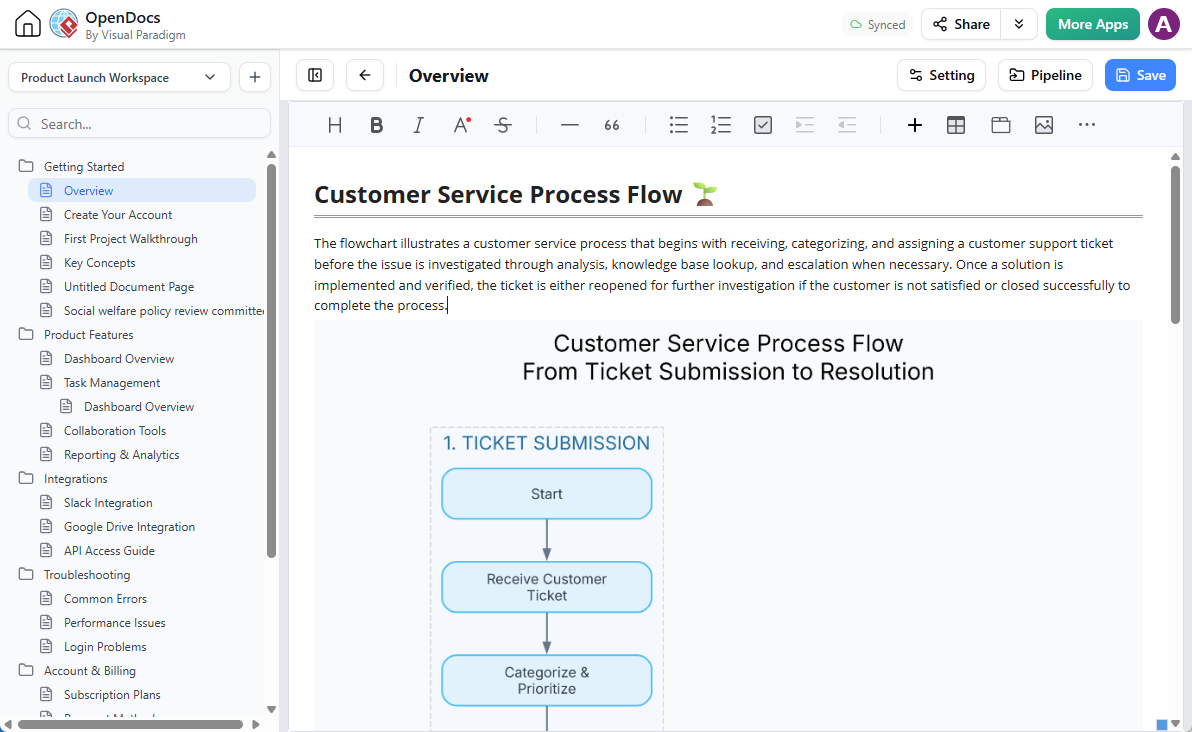
3. Send Diagrams to Visual Paradigm OpenDocs
Need to incorporate your newly generated flowchart into comprehensive technical documentation? You can send your diagram straight to OpenDocs for advanced knowledge management. Just click on the Send to OpenDocs Pipeline option, open the Pipeline pane inside OpenDocs, and drag your workflow directly onto your documentation page.
Important Note: Choosing Between Stepwise and Conventional Flowcharts
Our intelligent AI diagramming tool supports multiple visualization formats to suit your specific presentation needs. While the default AI assistant handles conventional flowcharts (Mermaid-based) brilliantly, generating a phased, structured layout requires a specific instruction.
When to Use Stepwise Flowcharts:
- Multi-phase processes with clear stage gates
- Complex workflows requiring visual separation
- Incident response and escalation procedures
- Customer journey maps with distinct touchpoints
- Project lifecycles with defined phases
When to Use Conventional Flowcharts:
- Simple linear processes
- Quick decision trees
- Basic algorithms
- Single-department workflows
- High-level overviews without detailed phases
If you want to build a clustered process map, make sure to explicitly specify that you need to generate a stepwise flowchart in your input prompt.
If you prefer traditional, linear workflows, you can learn more by exploring our earlier release: Next-Gen AI Flowchart Generator Announcement.
Best Practices for Effective Stepwise Flowcharts
1. Limit Phases to 5-7 Maximum
Too many phases can overwhelm viewers. Group related activities logically to maintain clarity.
2. Use Consistent Color Coding
Assign colors meaningfully:
- Blue for detection/initial phases
- Yellow/Orange for assessment
- Purple for escalation
- Green for resolution
- Pink/Red for follow-up/closure
3. Balance Detail and Readability
Include enough detail to be useful, but avoid cluttering. Use concise labels and consider supplementary documentation for extensive details.
4. Clearly Mark Decision Points
Use diamond shapes for decisions and label all branches (Yes/No, True/False, etc.) clearly.
5. Include Time Stamps When Relevant
For incident timelines or time-sensitive processes, include specific timestamps as shown in the outage example.
6. Define Escalation Paths Explicitly
Make it crystal clear when and how issues escalate, including roles and responsibilities.
7. Test with Stakeholders
Validate your flowchart with actual process participants to ensure accuracy and completeness.
Conclusion
Stepwise flowcharts represent a significant evolution in process visualization, offering the perfect balance between high-level structure and detailed workflow mapping. By organizing complex processes into distinct, color-coded phases, they enable stakeholders at all levels to understand workflows quickly and accurately.
With Visual Paradigm’s AI-powered diagramming tools, creating professional stepwise flowcharts has never been easier. Whether you’re documenting customer service processes, mapping incident response procedures, or designing deployment pipelines, the combination of conversational AI, diagram-as-code flexibility, and seamless documentation integration provides everything you need for effective process communication.
Start experimenting with stepwise flowcharts today by visiting the Visual Paradigm AI Chatbot. Begin with simple prompts, iterate through conversation, and watch as your process documentation transforms from static diagrams into dynamic, living resources that drive organizational clarity and efficiency.
Remember: the best flowchart is one that communicates effectively. Choose stepwise layouts when complexity demands structure, and don’t hesitate to leverage AI assistance to bring your process visualization visions to life.
References
-
- Visual Paradigm. “Unified Platform Features.” https://www.visual-paradigm.com/features/unified-platform/
- Visual Paradigm Blog. “Mastering the Visual Paradigm Unified Platform: The Ultimate Guide to a Seamless Creative Ecosystem.” https://blog.visual-paradigm.com/mastering-the-visual-paradigm-unified-platform-the-ultimate-guide-to-a-seamless-creative-ecosystem/
- Cybermedian. “Beyond Silos: The Ultimate Guide to the Visual Paradigm Unified Platform.” https://www.cybermedian.com/beyond-silos-the-ultimate-guide-to-the-visual-paradigm-unified-platform/
- Visual Paradigm Updates. “Introducing Visual Paradigm 18.1: A New Era of Unified Ecosystems and AI-Driven Innovation.” https://updates.visual-paradigm.com/releases/introducing-visual-paradigm-18-1-a-new-era-of-unified-ecosystems-and-ai-driven-innovation/
This post is also available in Deutsch, Español, فارسی, Français, English, Bahasa Indonesia, 日本語, Polski, Portuguese, Ру́сский, Việt Nam, 简体中文 and 繁體中文.