
What is Diagram-as-Code?
Why Use Diagram-as-Code?
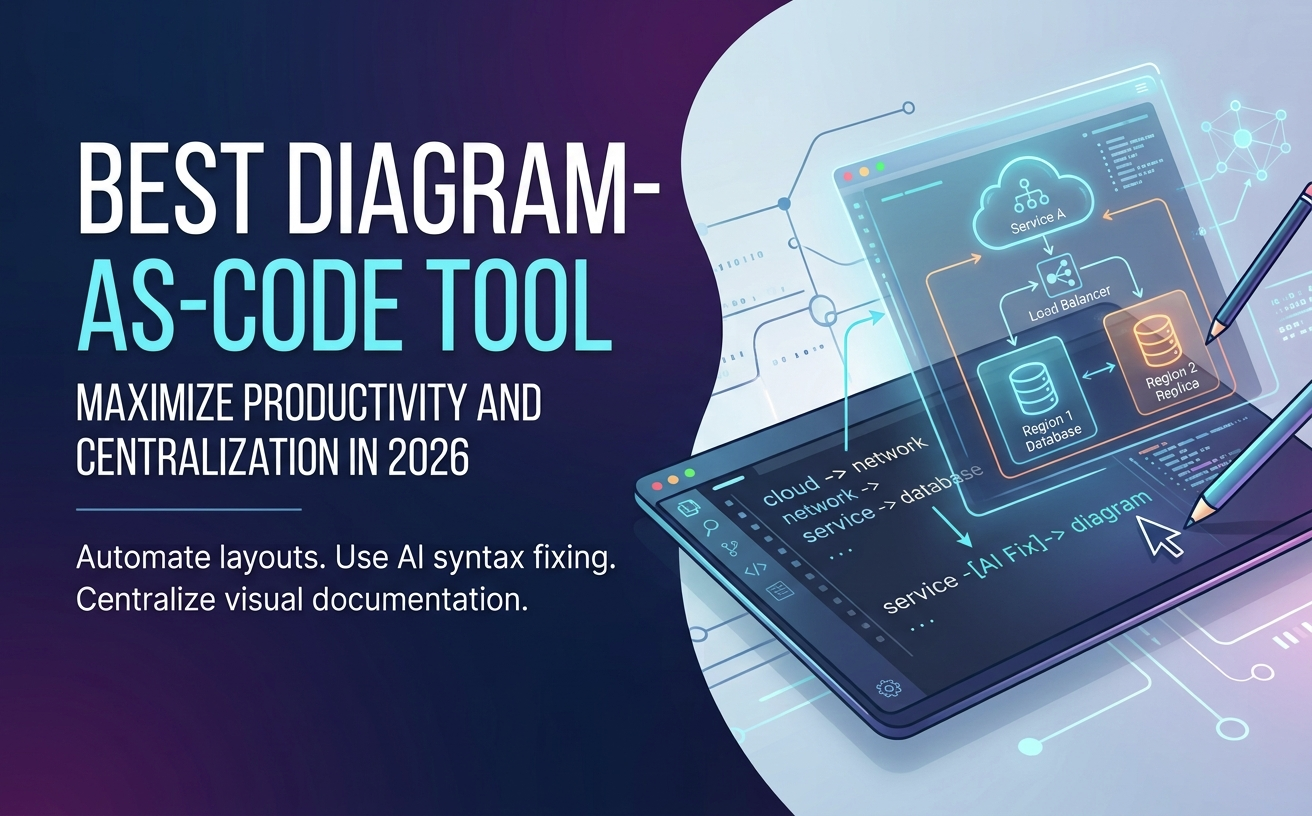
- AI-Powered Automation: Large Language Models (LLMs) natively understand and produce structured diagram syntax from simple natural language prompts, radically speeding up visual documentation.
- Automated, Consistent Layouts: Eliminates tedious manual shape positioning, alignment, and line-snapping. The rendering engine computes optimal spacing automatically, letting engineers stay focused on system logic.
- Seamless Developer Workflow & Version Control: Because diagrams exist as standard plain-text code, they integrate natively into Git repositories. Teams can track revision histories, conduct code reviews, perform diffs, and bundle visual architecture directly beside application codebases.
- Unified Multi-Language Documentation: Modern platforms can parse structured configurations (YAML/JSON), databases (SQL), or application code directly, making system visualization effortless across varied technical stacks.
What Are the Best Diagram-as-Code Tools in 2026?
While the market features several specialized engines, modern teams require platforms that blend comprehensive standard support, real-time feedback, and automated error recovery.
1. Visual Paradigm VPasCode (Top Recommendation)
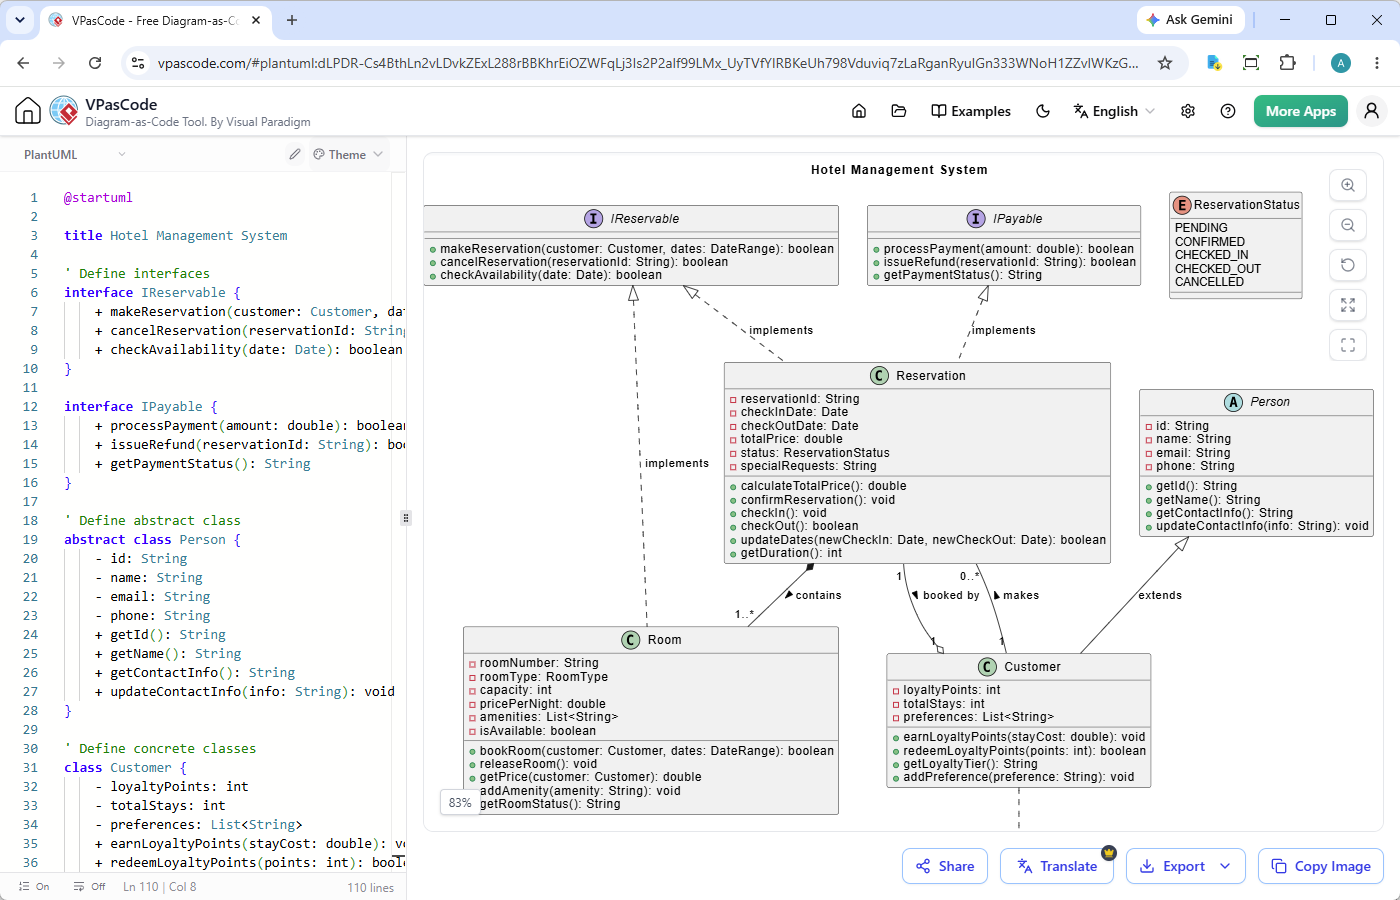
Visual Paradigm VPasCode is an all-in-one, multi-engine diagram-as-code platform designed to bridge code, visual design, and software documentation. Rather than locking teams into a single proprietary syntax, VPasCode acts as a unified hub supporting popular standards like PlantUML, Mermaid, Graphviz, Markmap, and ECharts.
Try it now at: https://www.vpascode.com/editor/
Key Features
- Universal Multi-Engine Support: Full rendering capabilities for PlantUML, Mermaid, Graphviz, Markmap, and ECharts within a single unified workspace.
- Automatic Code Format Detection: Paste raw snippet text into the editor, and VPasCode automatically identifies the language, parses the content, and renders the diagram instantaneously.
- AI Code Error Fixing & Learning: Instantly repair broken syntax with a single click. VPasCode highlights side-by-side code diffs and explains the exact nature of the syntax repair so developers learn in real time.
- Native AI Diagram Translation: Translate text labels across complex diagrams into any major global language without destroying layout integrity or breaking syntax structures.
- Broad Polyglot & Data Parsing: Generates dynamic visual output directly from structured data (JSON, YAML, XML, CSV, TOML), database scripts (SQL), and source code (Java, TypeScript, Go, Rust, C#, Python, C/C++, PHP, Ruby, Kotlin, Swift, and more).
- OpenDocs Enterprise Integration: One-click push to Visual Paradigm OpenDocs for seamless embedding into enterprise document workflows.
- Free Real-Time Editor & Flexible Export: Free browser rendering, live previews, URL/QR sharing, and vector/raster image exports (SVG, PNG).
Who It’s For
- Software architects, developers, technical writers, and enterprise engineering teams requiring a unified platform for multi-DSL diagrams, source code visualization, and AI-assisted documentation.
Limitations
- Advanced AI automation features (AI Error Fixing & Translation) require an active Visual Paradigm Online Combo Edition or Desktop Professional Edition license.
2. Mermaid
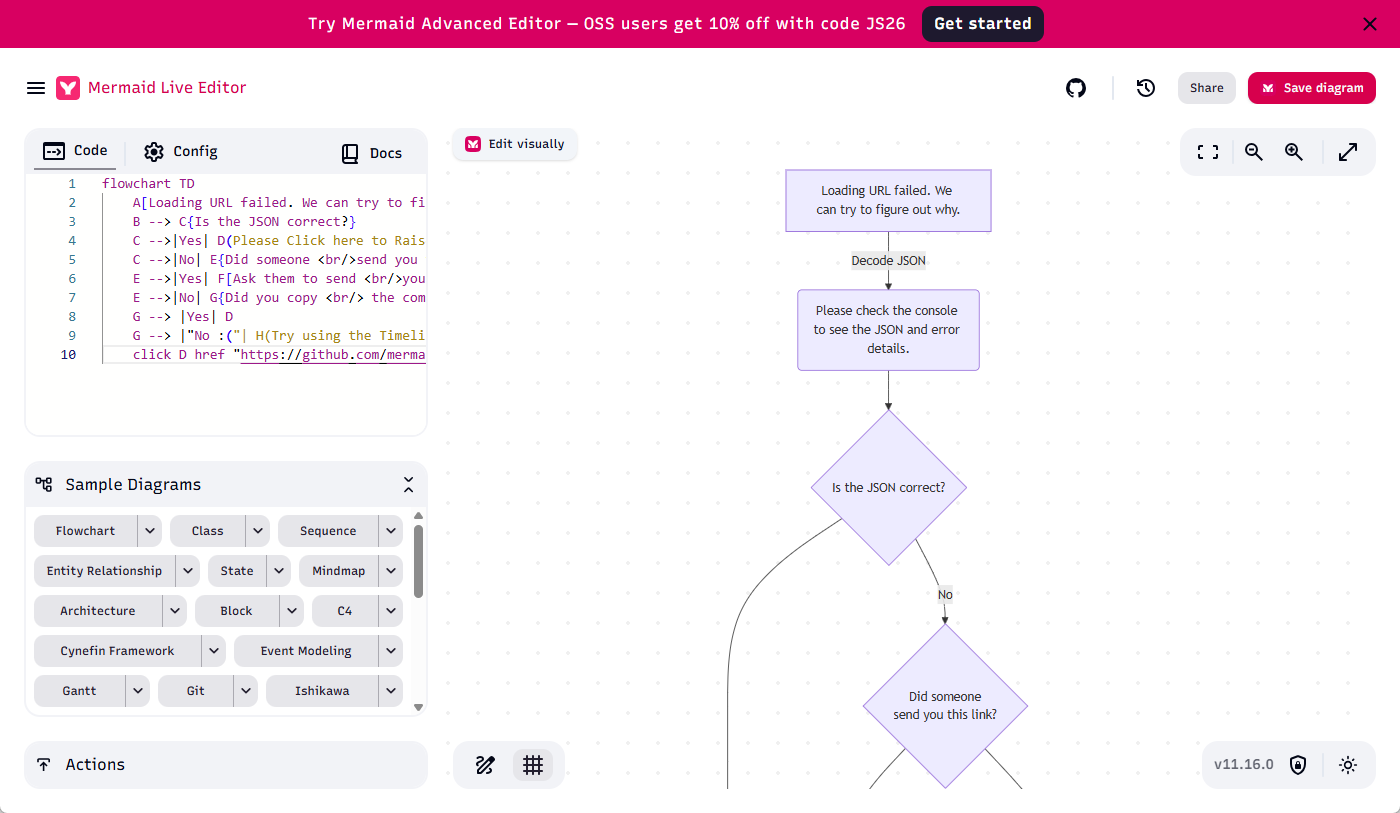
Mermaid is a widely adopted open-source JavaScript-based diagramming tool that uses Markdown-inspired text definitions to generate simple diagrams.
Key Features
- Open-source (MIT License) with broad community support.
- Direct inline rendering on GitHub, GitLab, and Notion markdown pages.
- Supports flowcharts, sequence diagrams, Gantt charts, and Git graphs.
Who It’s For
- Developers creating basic markdown documentation directly within repository READMEs.
Limitations
- Strict, rigid rendering styles with limited custom styling.
- Manual error debugging with no automated syntax recovery options.
- Requires precise syntax formatting; syntax mismatches completely break render output.
3. PlantUML
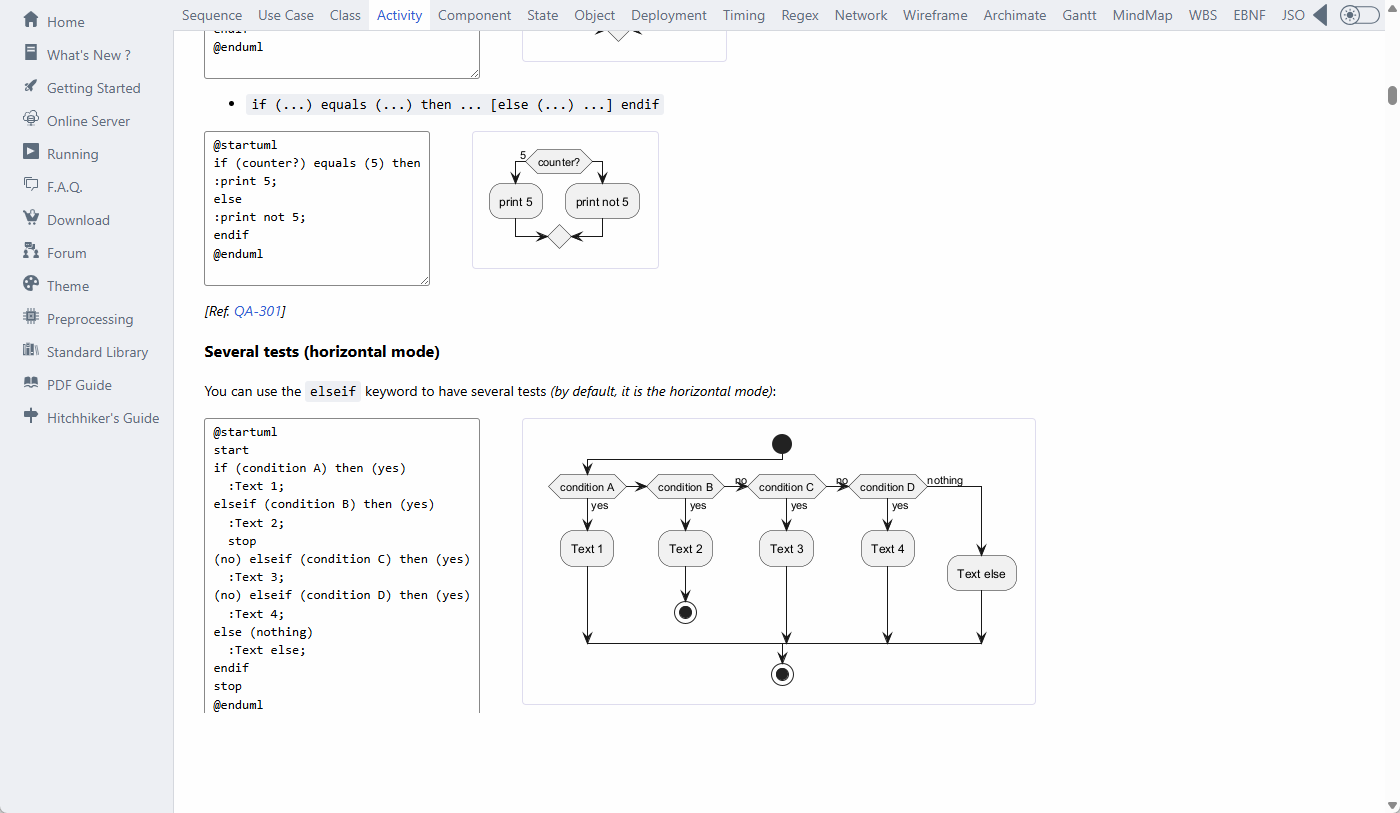
PlantUML is an established open-source engine built primarily for modeling Object-Oriented software architectures and standard UML diagrams.
Key Features
- Comprehensive coverage for formal structural and behavioral UML specifications (Class, Sequence, State, Component, Use Case).
- Supports extensions for C4 modeling, ArchiMate, and network topology mapping.
Who It’s For
- Systems architects who need strict adherence to formal UML notation standards.
Limitations
- Outdated visual output styles requiring manual skinparam configurations for modern looks.
- Verbose syntax structure with a steep learning curve for non-technical users.
- No native web-based management platform or built-in workflow utilities.
4. D2
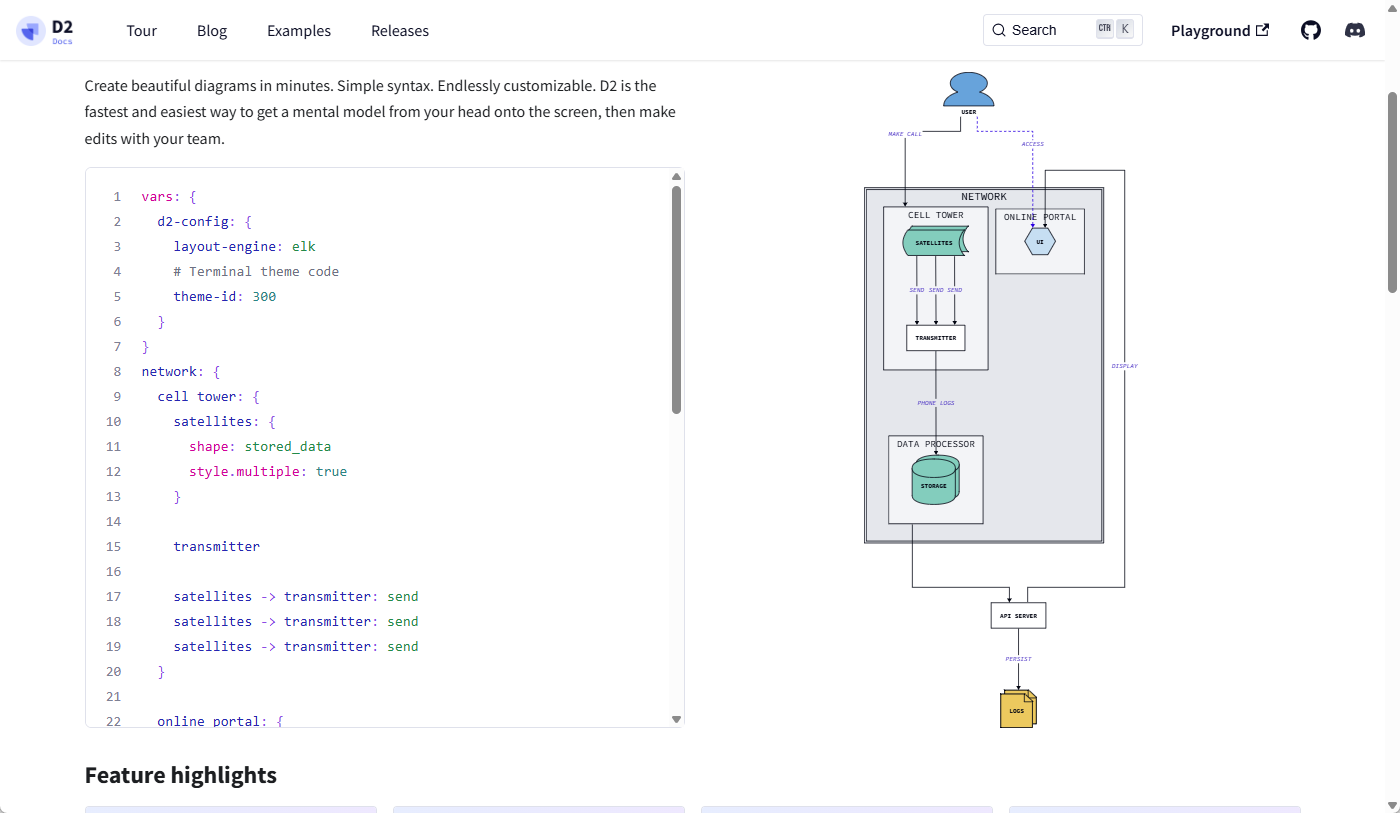
D2 (Declarative Diagramming) is a modern diagram-as-code scripting language designed to improve on layout control and visual presentation.
Key Features
- Clean, modernized syntax tailored specifically for software architecture diagrams.
- Supports specialized outputs including animated steps, interactive tooltips, and LaTeX formatting.
Who It’s For
- Engineering teams seeking custom declarative styling for technical architecture graphs.
Limitations
- Isolated domain-specific language (DSL) with zero support for legacy PlantUML or Mermaid scripts.
- Lacks native AI error-fixing and multilingual translation capabilities.
5. Diagrams (Python)
Diagrams allows cloud architects to draw system architecture graphs by writing executable Python code rather than domain-specific text files.
Key Features
- Open-source Python library with built-in cloud icons (AWS, Azure, GCP, Kubernetes).
- Allows programmatic generation of architecture graphs inside automation scripts and CI/CD pipelines.
Who It’s For
- DevOps engineers and Python developers automating cloud infrastructure documentation.
Limitations
- No web-based visual editor or live side-by-side editing interface.
- Strictly constrained to infrastructure and cloud architectural diagrams.
Diagram-as-Code Feature Comparison Matrix
| Feature / Capability | VPasCode | Mermaid | PlantUML | D2 | Diagrams (Python) |
|---|---|---|---|---|---|
| Supported Syntaxes / DSLs | PlantUML, Mermaid, Graphviz, Markmap, ECharts (Unified) | Mermaid DSL only | PlantUML DSL only | D2 DSL only | Python Code only |
| Automatic Code Detection | Yes (Instant Auto-Detect) | No | No | No | No |
| AI Syntax Error Fixing | Yes (Auto-Fix + Side-by-Side Diff) | No | No | No | No |
| AI Diagram Translation | Yes (Multi-Language Label Translation) | No | No | No | No |
| Data & Code Visualization | JSON, YAML, XML, SQL, Java, Python, Go, Rust, C++, etc. | Limited | Limited | No | No |
| Free Web Editor & Rendering | Yes (Browser-Based) | Yes (Live Editor) | Basic Server Only | Yes (Playground) | No (CLI/Code Only) |
Essential Features to Look For in a Diagram-as-Code Tool
1. Multi-Format & DSL Versatility
Many teams run into “syntax lock-in” when choosing a diagram tool. A developer working on a database schema might prefer PlantUML ERDs, while a frontend team uses Mermaid flowcharts. A superior platform like VPasCode eliminates vendor lock-in by supporting multiple syntaxes (PlantUML, Mermaid, Graphviz, ECharts) under one unified environment.
2. AI-Assisted Error Recovery & Syntax Intelligence
A major frustration with code-based diagramming is hitting cryptic syntax errors that prevent rendering. Look for intelligent environments capable of auto-detecting syntax and offering one-click AI Code Error Fixing. Tools that provide side-by-side code diffs and diagnostic explanations turn rendering failures into learning opportunities.
3. Native Source Code & Data Parsing
Modern visual documentation shouldn’t require manual typing from scratch. Elite tools analyze structured data files (JSON, YAML, CSV, SQL schemas) or popular programming languages (Java, TypeScript, Python, Go, Rust) and automatically map them into readable architectural visuals.
4. Localization & Global Collaboration
For distributed international teams, communicating complex software designs across language barriers can be difficult. Having native AI diagram translation integrated directly into the workspace allows teams to translate diagram text natively without altering syntax structure or disrupting visual alignment.
5. Documentation Pipeline Integration
Standalone visual diagrams lose utility if isolated from project documentation. Ensure your chosen tool interfaces smoothly with enterprise documentation hubs (such as Visual Paradigm OpenDocs), enabling effortless publishing, sharing via secure URLs, and embedding across organizational knowledge bases.
Supported Diagram Types Breakdown
When selecting a platform, verifying diagram type support is critical. By unifying both PlantUML and Mermaid engines, platform options like VPasCode offer complete coverage across all engineering use cases:
| Domain | Supported Diagram Standards & Types |
|---|---|
| Software Architecture & Modeling | Class, Sequence, Object, Component, Deployment, Package, Use Case, C4 Architecture, ArchiMate |
| Process & Workflow Mapping | Flowcharts, Activity Diagrams, State Machines, User Journey Maps, Kanban, Swimlanes, Requirements Diagrams |
| Data & Infrastructure Modeling | Entity Relationship Diagrams (ERD, Chen ERD), SQL Schemas, Network Topologies, Wardley Maps |
| Project Management & Analytics | Gantt Charts, Work Breakdown Structures (WBS), Mind Maps, Timelines, Ishikawa (Fishbone) Diagrams, Venn Diagrams, Quadrants, ECharts Data Visualizations |
How to Choose the Right Tool for Your Team
- Assess Syntax Familiarity: If your team uses diverse syntax formats across legacy and modern projects, choose a unified platform like VPasCode that parses PlantUML, Mermaid, and Graphviz simultaneously.
- Evaluate Developer Productivity Tools: Choose tools equipped with real-time previewing, automatic format detection, and AI error-fixing to eliminate debugging friction.
- Prioritize Workflow Integration: Test how easily diagrams migrate into project documentation, repository READMEs, and enterprise portals like OpenDocs.
Related posts:
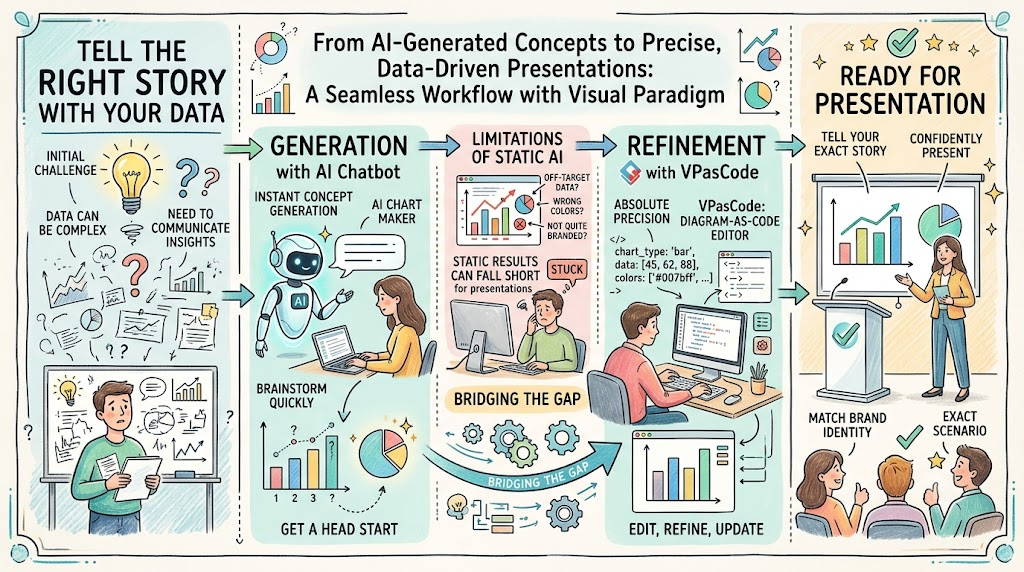 VPasCode: The Ultimate Guide to AI Chart Generation and Code-Driven Data Visualization
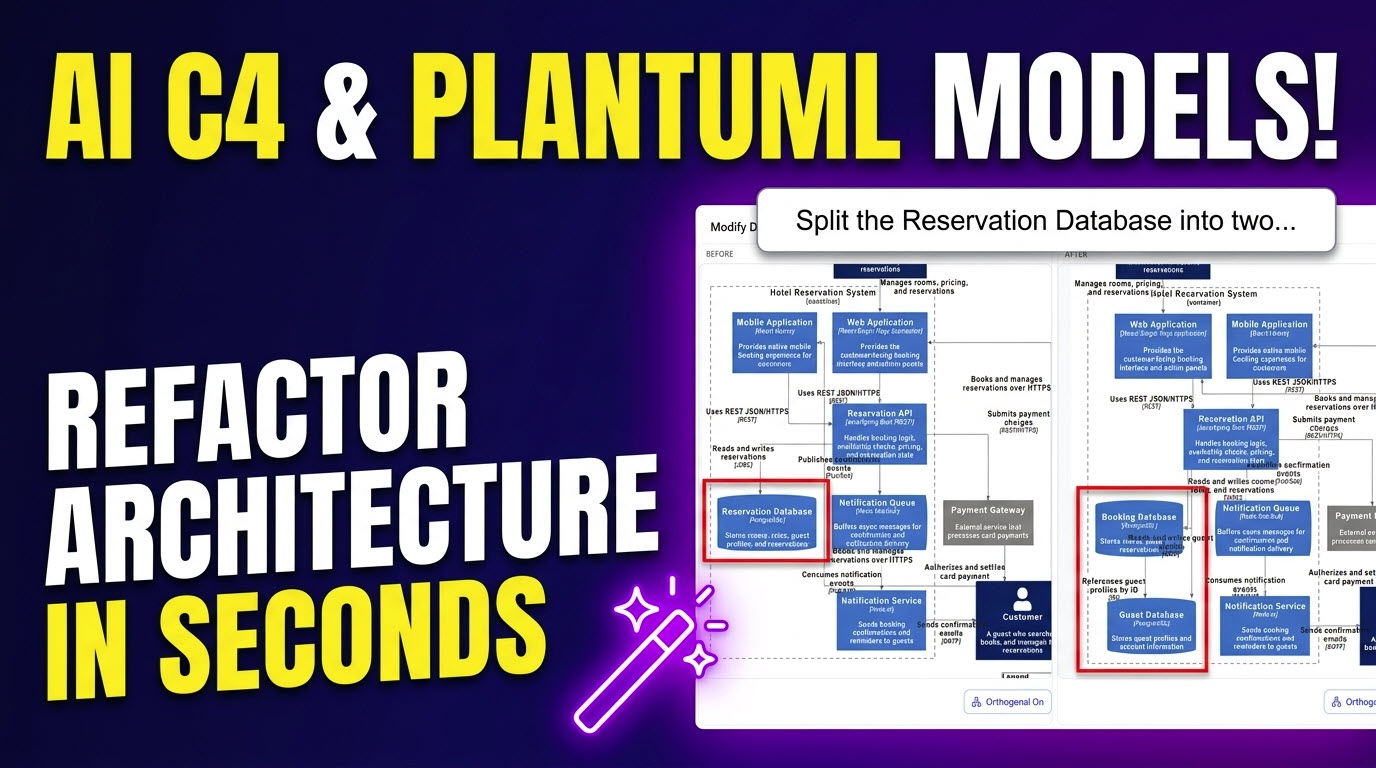 Architecting Systems with AI: Generating PlantUML & C4 Models in VPasCode
 From Prompt to Architecture: The Complete Guide to Visual Paradigm’s AI-Powered VPasCode Update
 Introducing Visual Paradigm AI Chatbot: A Smarter Way to Create Diagrams