
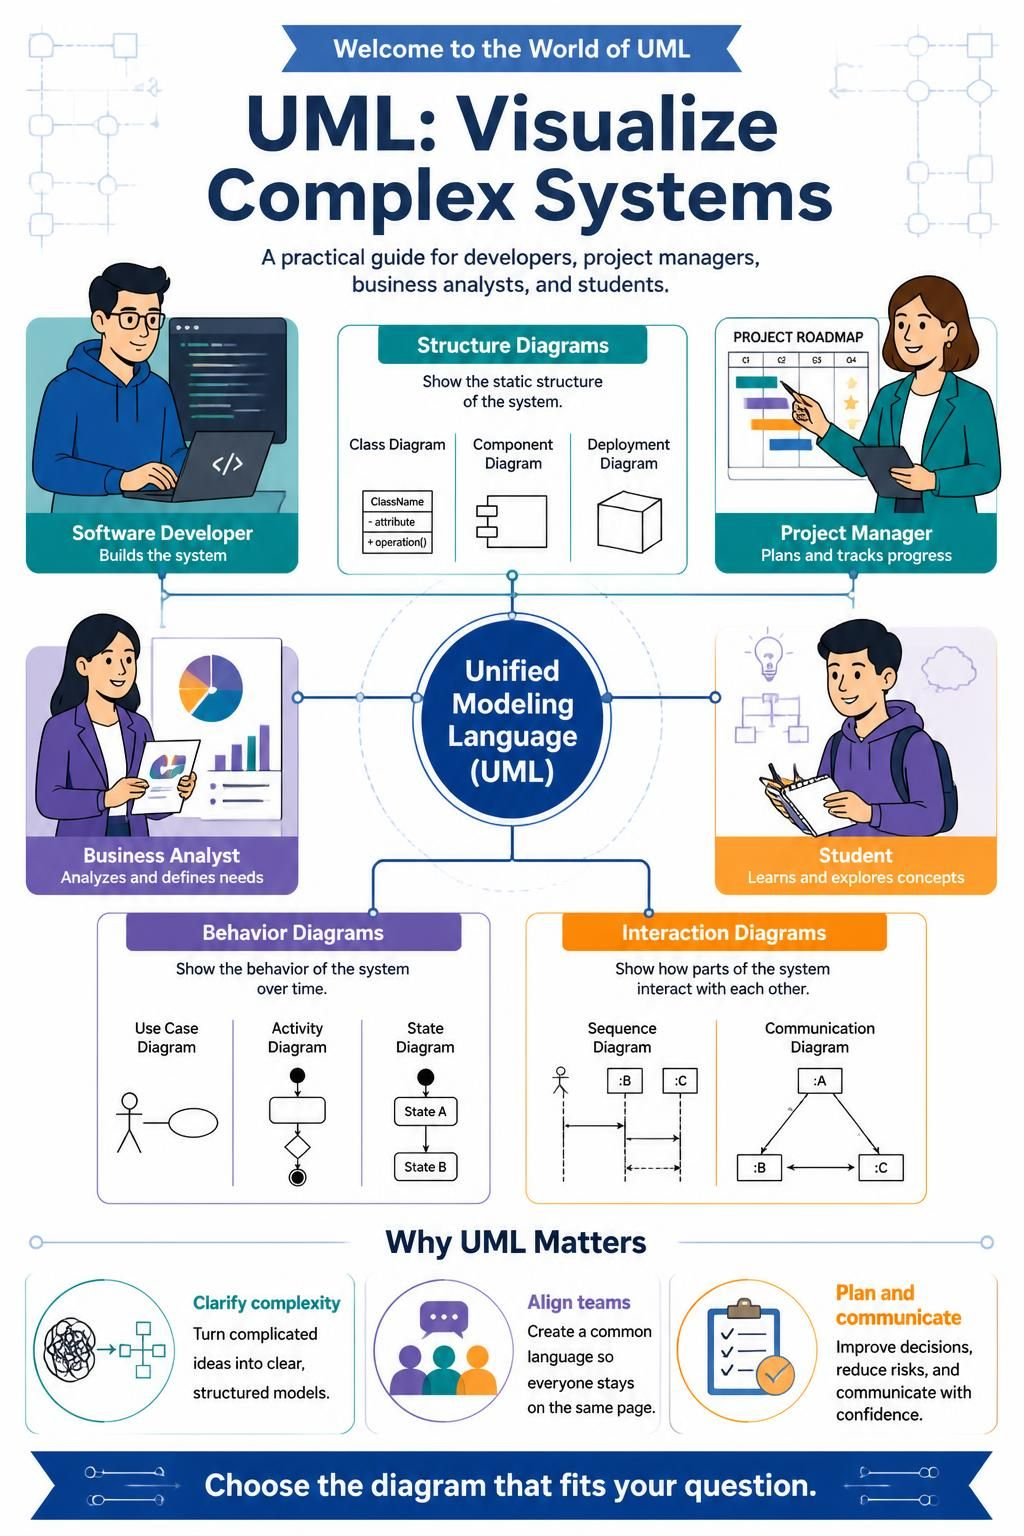
Welcome to the world of UML. Whether you are a software developer, a project manager, a business analyst, or a student, understanding how to visualize complex systems is a superpower. This guide breaks down what UML is, why it matters, and how to use its various diagram types effectively—without tying you to any specific software tool.
1. What is UML?
Unified Modeling Language (UML) is a standardized visual language used to model complex systems. Think of it as a blueprint for software, databases, or business processes.
Instead of reading thousands of lines of code or dense documentation, UML allows you to see:
-
Relationships: How different parts of a system connect.
-
Characteristics: The attributes and properties of components.
-
Behaviors: How the system acts and changes over time.
Why Use UML?
-
Simplify Complexity: It breaks vast, intricate systems into bite-sized, understandable components.
-
Eliminate Rework: By visualizing architecture before coding begins, you catch errors early.
-
Bridge the Gap: It creates a common language for technical teams (developers) and non-technical stakeholders (management, clients), ensuring everyone is on the same page from day one.
-
Manage Scope: For project managers, it helps define requirements clearly, reducing the risk of “scope creep” and future surprises.
2. The Two Main Categories of UML Diagrams
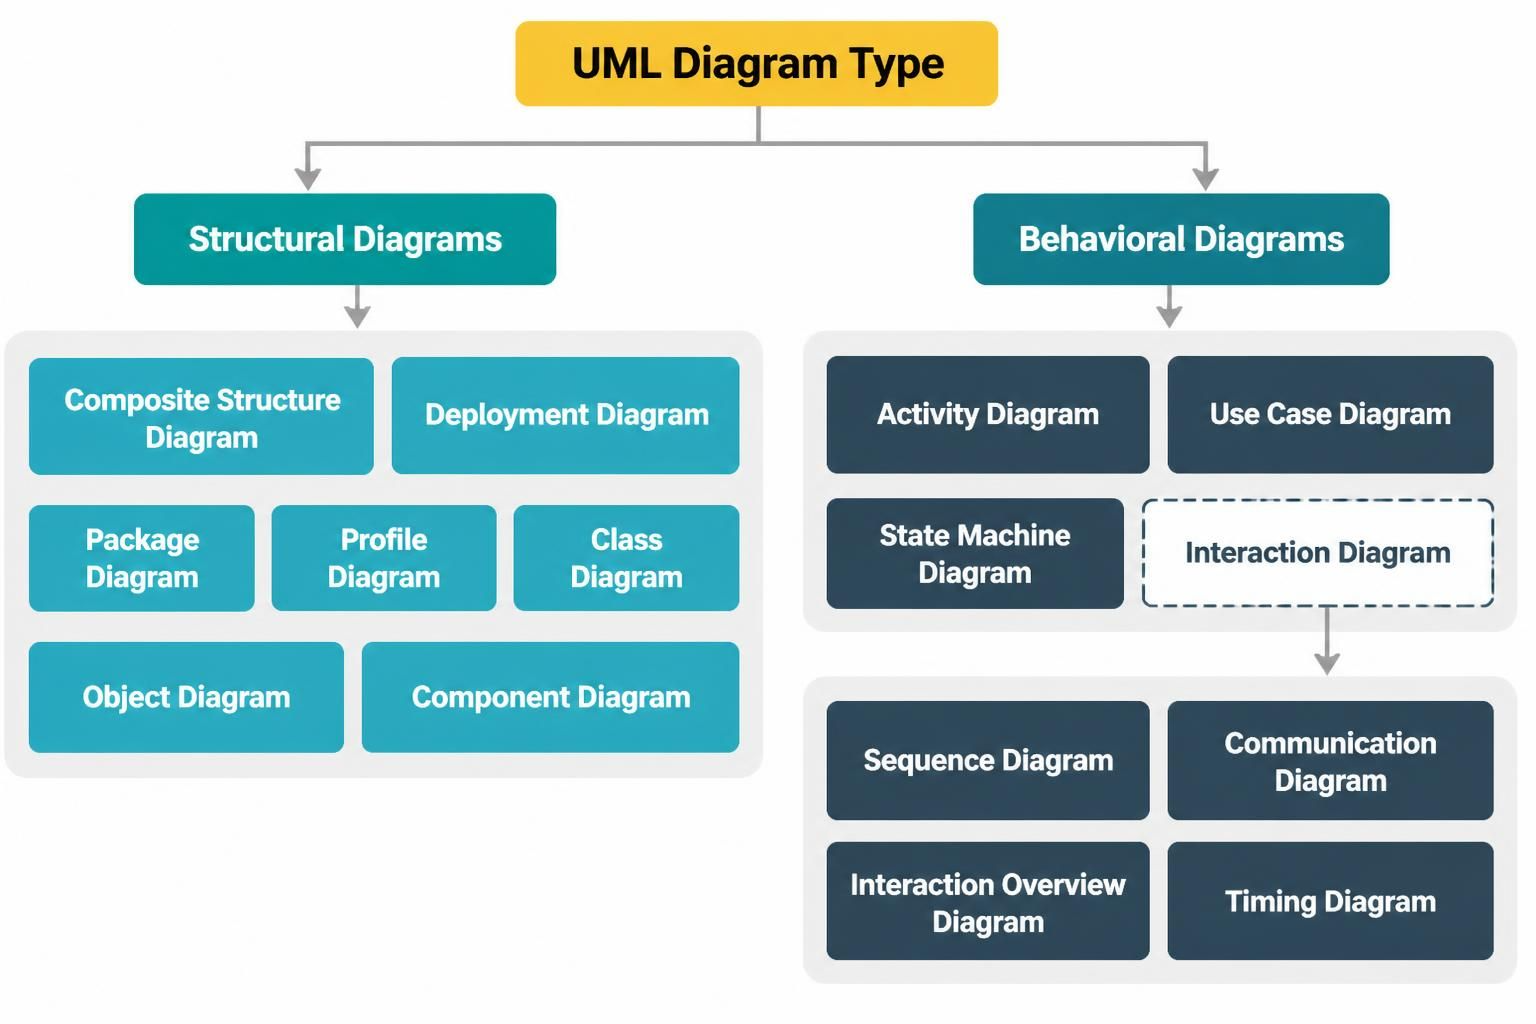
UML diagrams are divided into two major families. Understanding the difference is key to choosing the right diagram for your needs.
| Category | Focus | Question it Answers |
|---|---|---|
| Structural Diagrams | Static Structure | What is in the system? (Attributes, hierarchies, implementation) |
| Behavioral Diagrams | Dynamic Behavior | How does the system work? (Interactions, changes over time, workflows) |
There are 14 standard diagram types across these two categories. Below is a breakdown of each.
3. Behavioral Diagrams (The “How”)
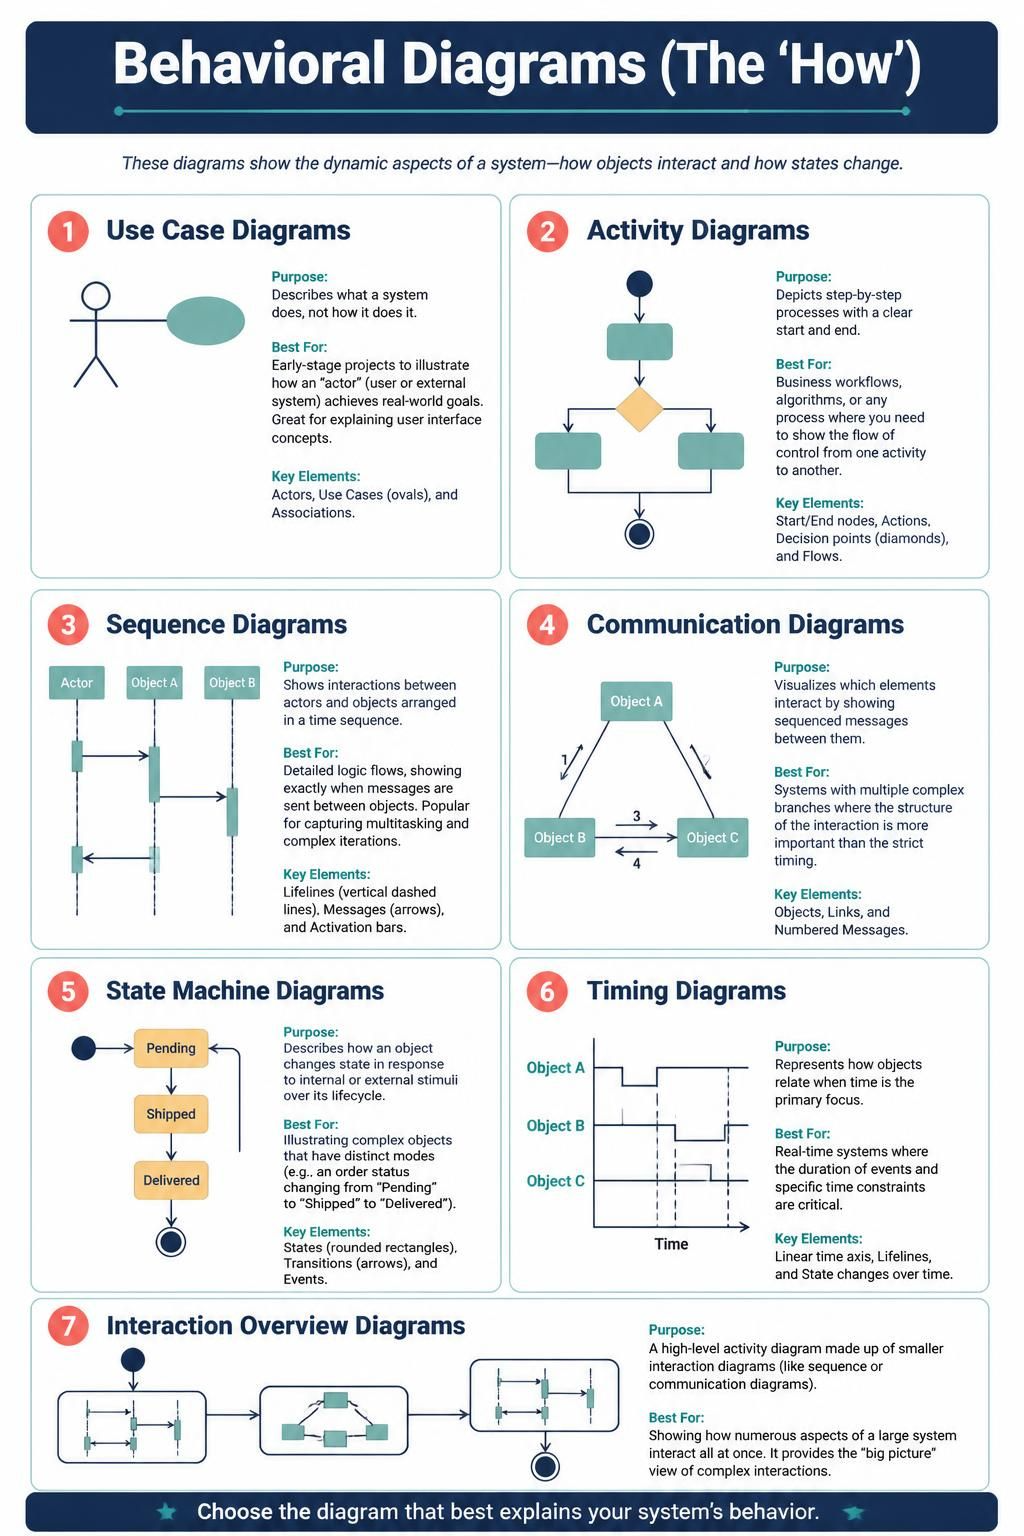
These diagrams show the dynamic aspects of a system—how objects interact and how states change.
1. Use Case Diagrams
-
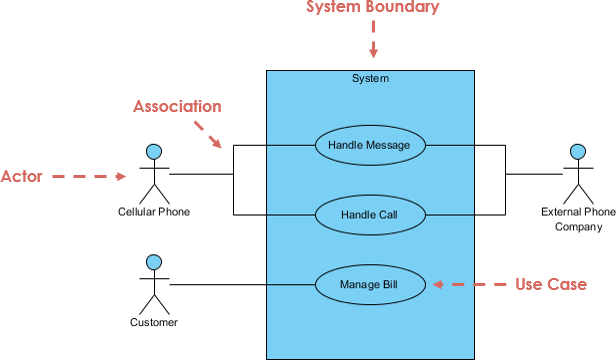
Purpose: Describes what a system does, not how it does it.
-
Best For: Early-stage projects to illustrate how an “actor” (user or external system) achieves real-world goals. Great for explaining user interface concepts.
-
Key Elements: Actors, Use Cases (ovals), and Associations.
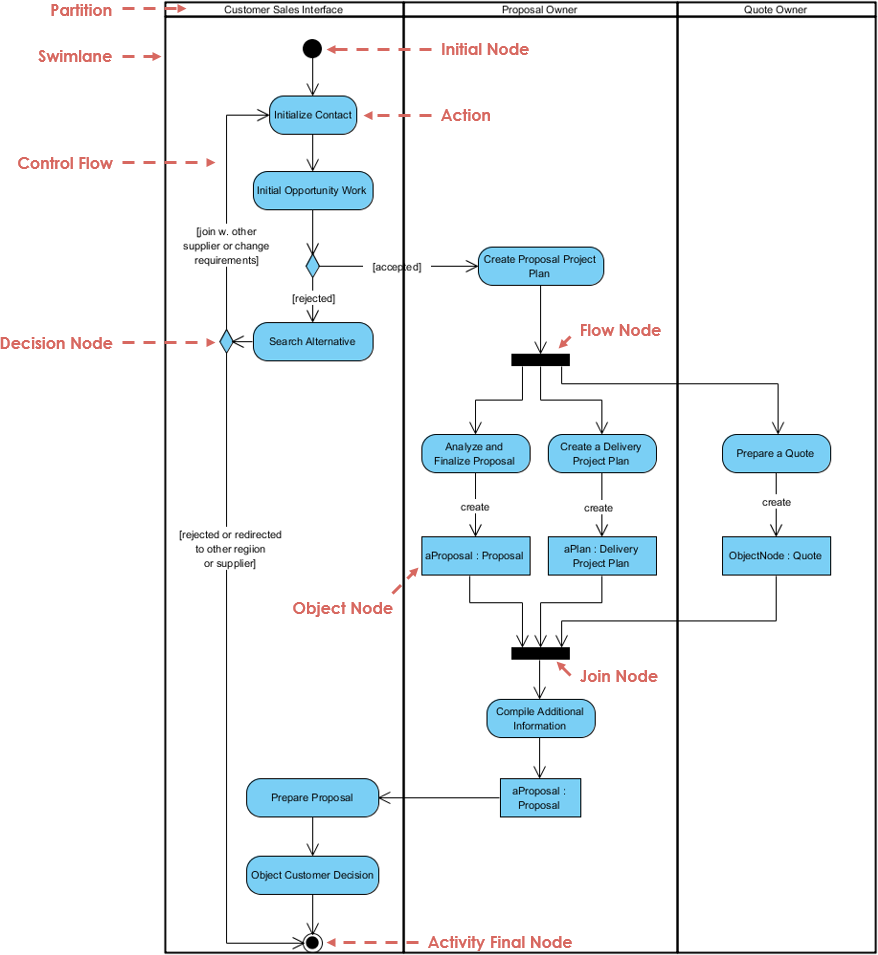
2. Activity Diagrams
Purpose: Depicts step-by-step processes with a clear start and end.
-
Best For: Business workflows, algorithms, or any process where you need to show the flow of control from one activity to another.
-
Key Elements: Start/End nodes, Actions, Decision points (diamonds), and Flows.
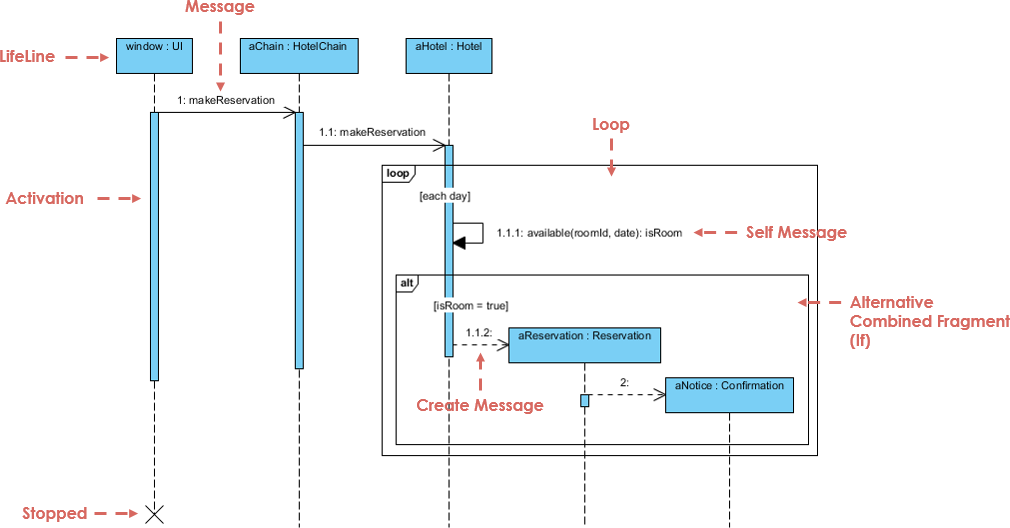
3. Sequence Diagrams
-
Purpose: Shows interactions between actors and objects arranged in a time sequence.
-
Best For: Detailed logic flows, showing exactly when messages are sent between objects. Popular for capturing multitasking and complex iterations.
-
Key Elements: Lifelines (vertical dashed lines), Messages (arrows), and Activation bars.
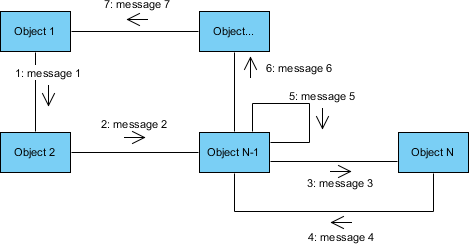
4. Communication Diagrams
-
Purpose: Visualizes which elements interact by showing sequenced messages between them.
-
Best For: Systems with multiple complex branches where the structure of the interaction is more important than the strict timing.
-
Key Elements: Objects, Links, and Numbered Messages.
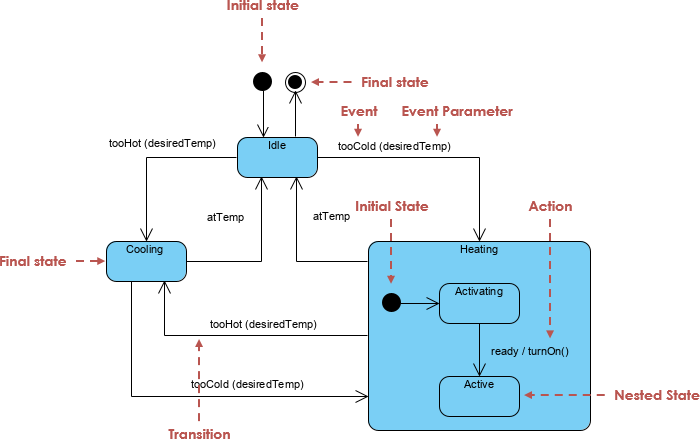
5. State Machine Diagrams
-
Purpose: Describes how an object changes state in response to internal or external stimuli over its lifecycle.
-
Best For: Illustrating complex objects that have distinct modes (e.g., an order status changing from “Pending” to “Shipped” to “Delivered”).
-
Key Elements: States (rounded rectangles), Transitions (arrows), and Events.
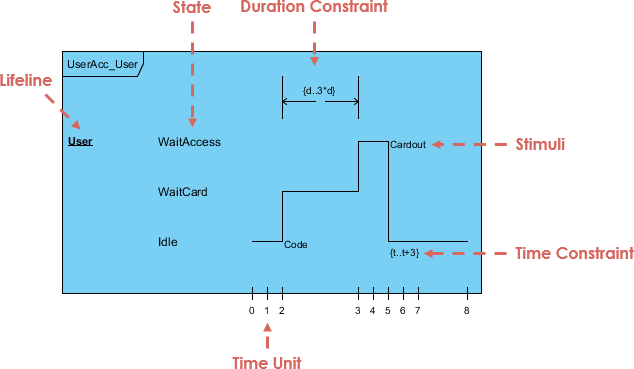
6. Timing Diagrams
-
Purpose: Represents how objects relate when time is the primary focus.
-
Best For: Real-time systems where the duration of events and specific time constraints are critical.
-
Key Elements: Linear time axis, Lifelines, and State changes over time.
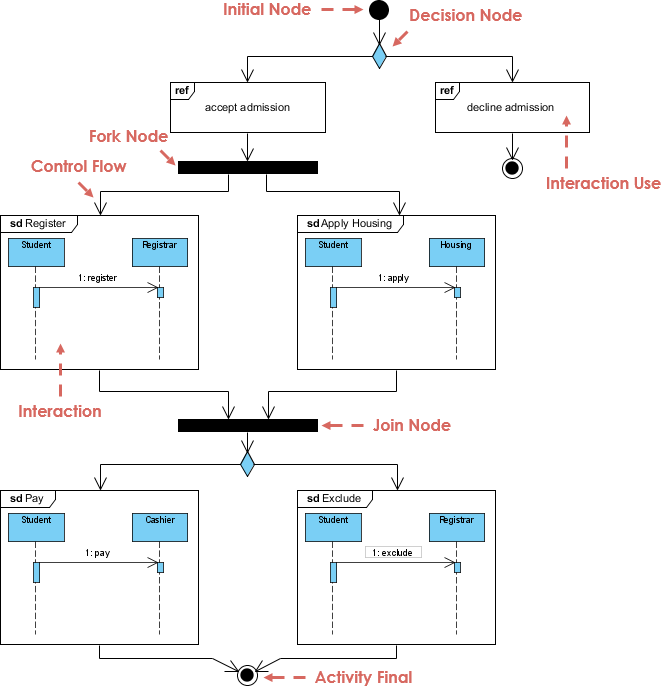
7. Interaction Overview Diagrams
-
Purpose: A high-level activity diagram made up of smaller interaction diagrams (like sequence or communication diagrams).
-
Best For: Showing how numerous aspects of a large system interact all at once. It provides a “big picture” view of complex interactions.
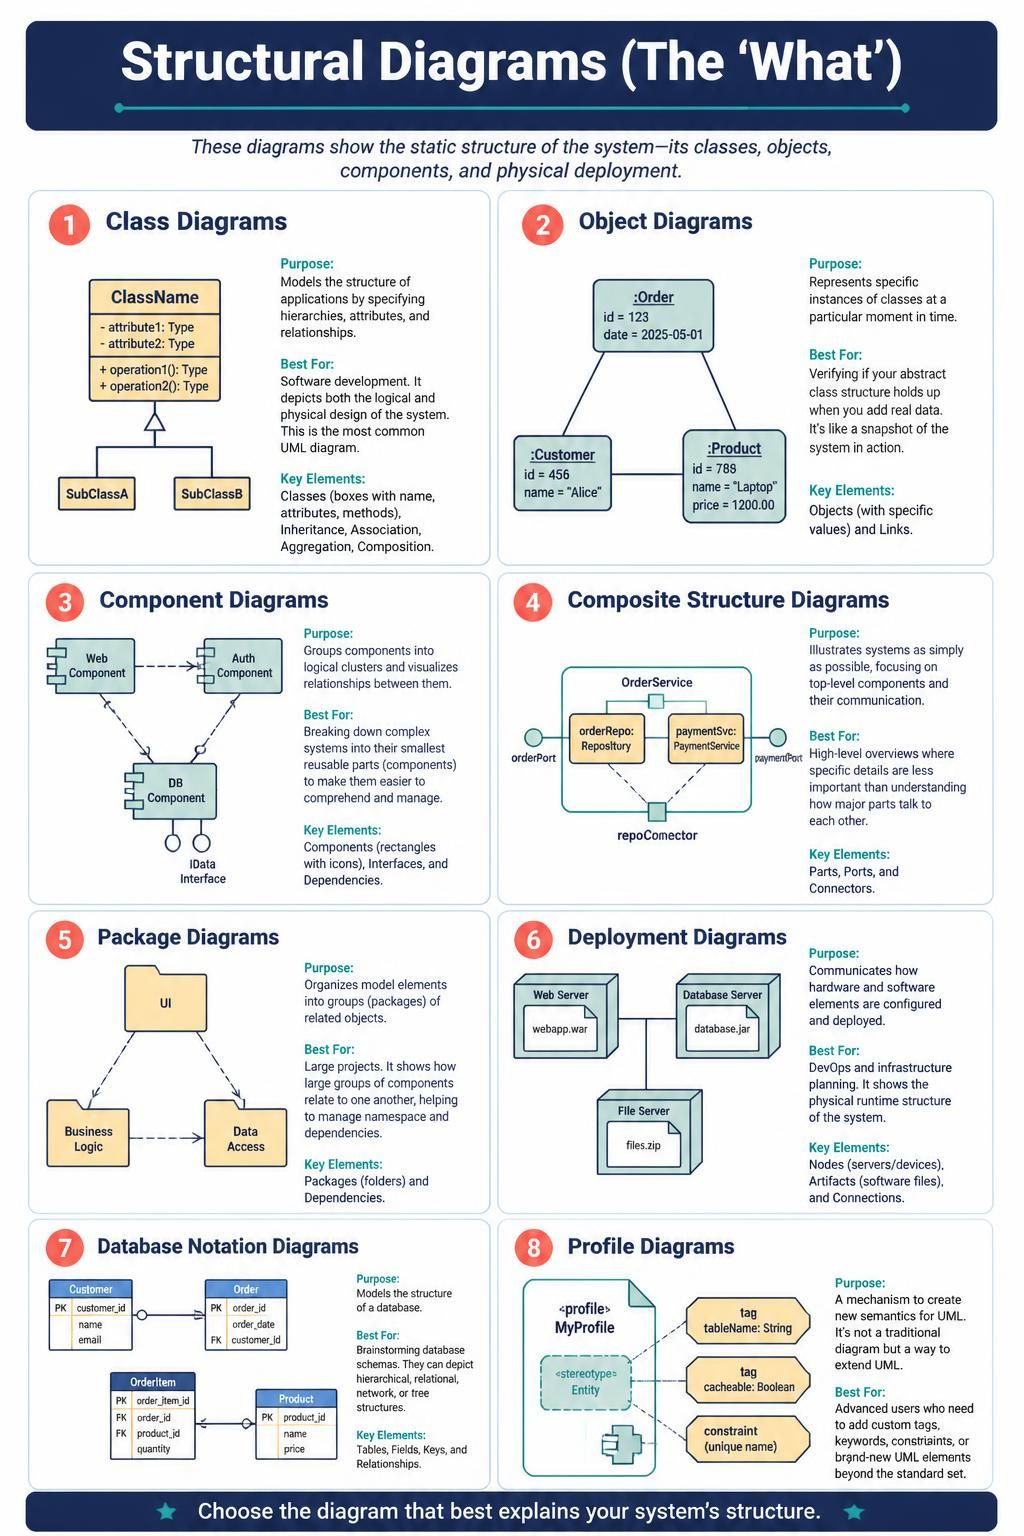
4. Structural Diagrams (The “What”)
These diagrams show the static structure of the system—its classes, objects, components, and physical deployment.
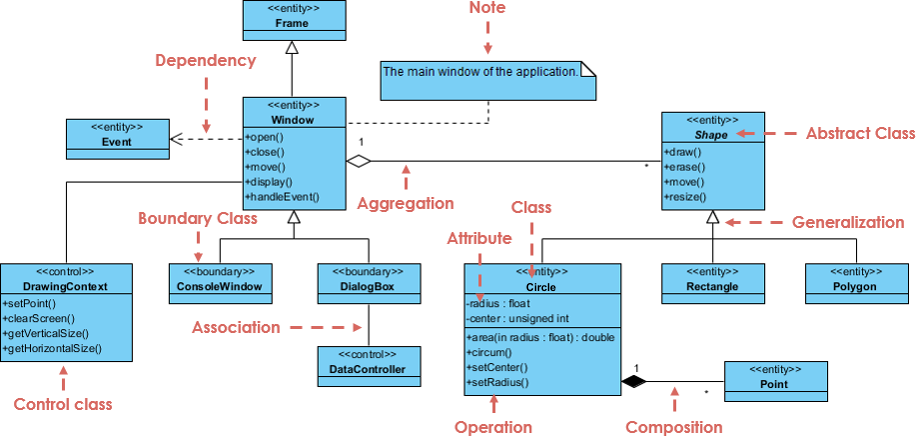
1. Class Diagrams
-
Purpose: Models the structure of applications by specifying hierarchies, attributes, and relationships.
-
Best For: Software development. It depicts both the logical and physical design of the system. This is the most common UML diagram.
-
Key Elements: Classes (boxes with name, attributes, methods), Inheritance, Association, Aggregation, Composition.
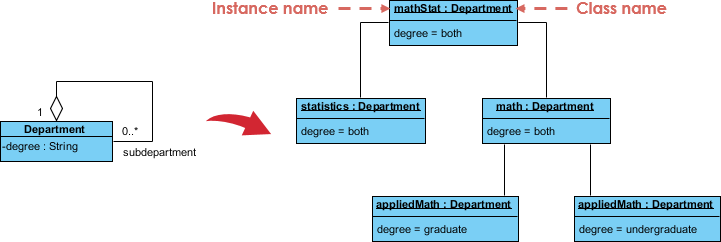
2. Object Diagrams
-
Purpose: Represents specific instances of classes at a particular moment in time.
-
Best For: Verifying if your abstract class structure holds up when you add real data. It’s like a snapshot of the system in action.
-
Key Elements: Objects (with specific values) and Links.
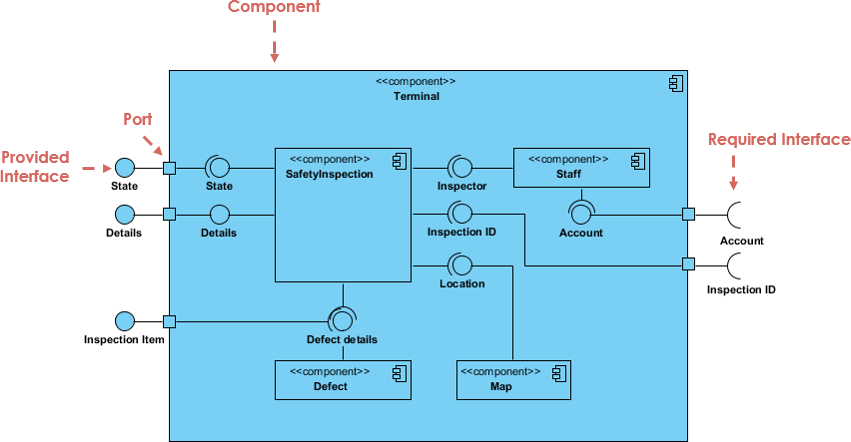
3. Component Diagrams
-
Purpose: Groups components into logical clusters and visualizes relationships between them.
-
Best For: Breaking down complex systems into their smallest reusable parts (components) to make them easier to comprehend and manage.
-
Key Elements: Components (rectangles with icons), Interfaces, and Dependencies.
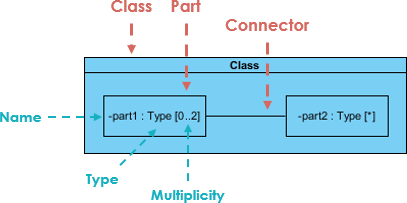
4. Composite Structure Diagrams
-
Purpose: Illustrates systems as simply as possible, focusing on top-level components and their communication.
-
Best For: High-level overviews where specific details are less important than understanding how major parts talk to each other.
-
Key Elements: Parts, Ports, and Connectors.
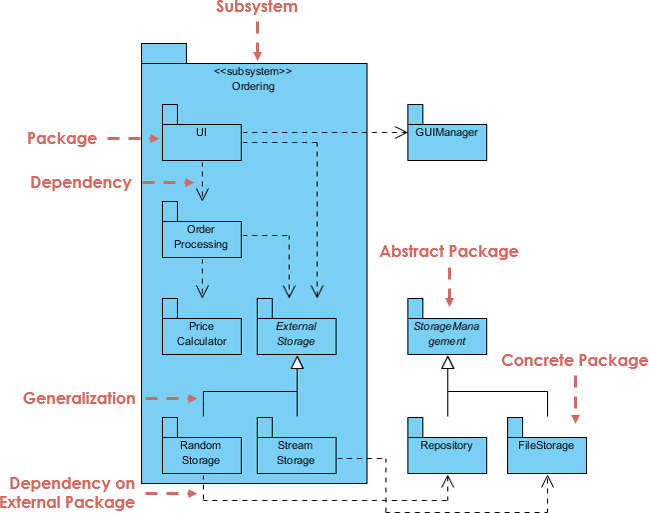
5. Package Diagrams
-
Purpose: Organizes model elements into groups (packages) of related objects.
-
Best For: Large projects. It shows how large groups of components relate to one another, helping to manage namespace and dependencies.
-
Key Elements: Packages (folders) and Dependencies.
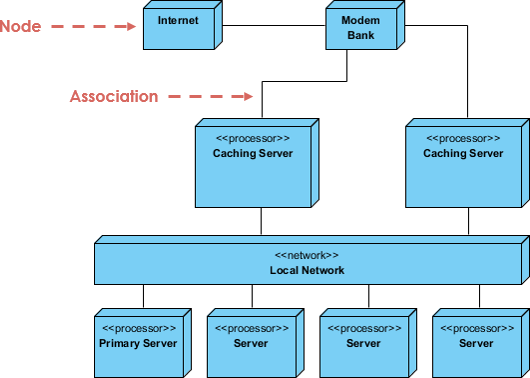
6. Deployment Diagrams
-
Purpose: Communicates how hardware and software elements are configured and deployed.
-
Best For: DevOps and infrastructure planning. It shows the physical runtime structure of the system.
-
Key Elements: Nodes (servers/devices), Artifacts (software files), and Connections.
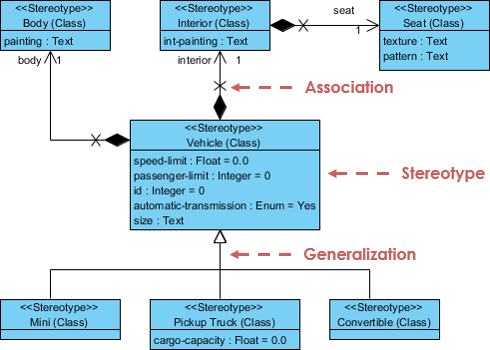
7. Profile Diagrams
-
Purpose: A mechanism to create new semantics for UML. It’s not a traditional diagram but a way to extend UML.
-
Best For: Advanced users who need to add custom tags, keywords, constraints, or brand-new UML elements beyond the standard set.
5. How to Get Started: A Step-by-Step Approach
You don’t need expensive software to start thinking in UML. Here is a platform-neutral workflow:
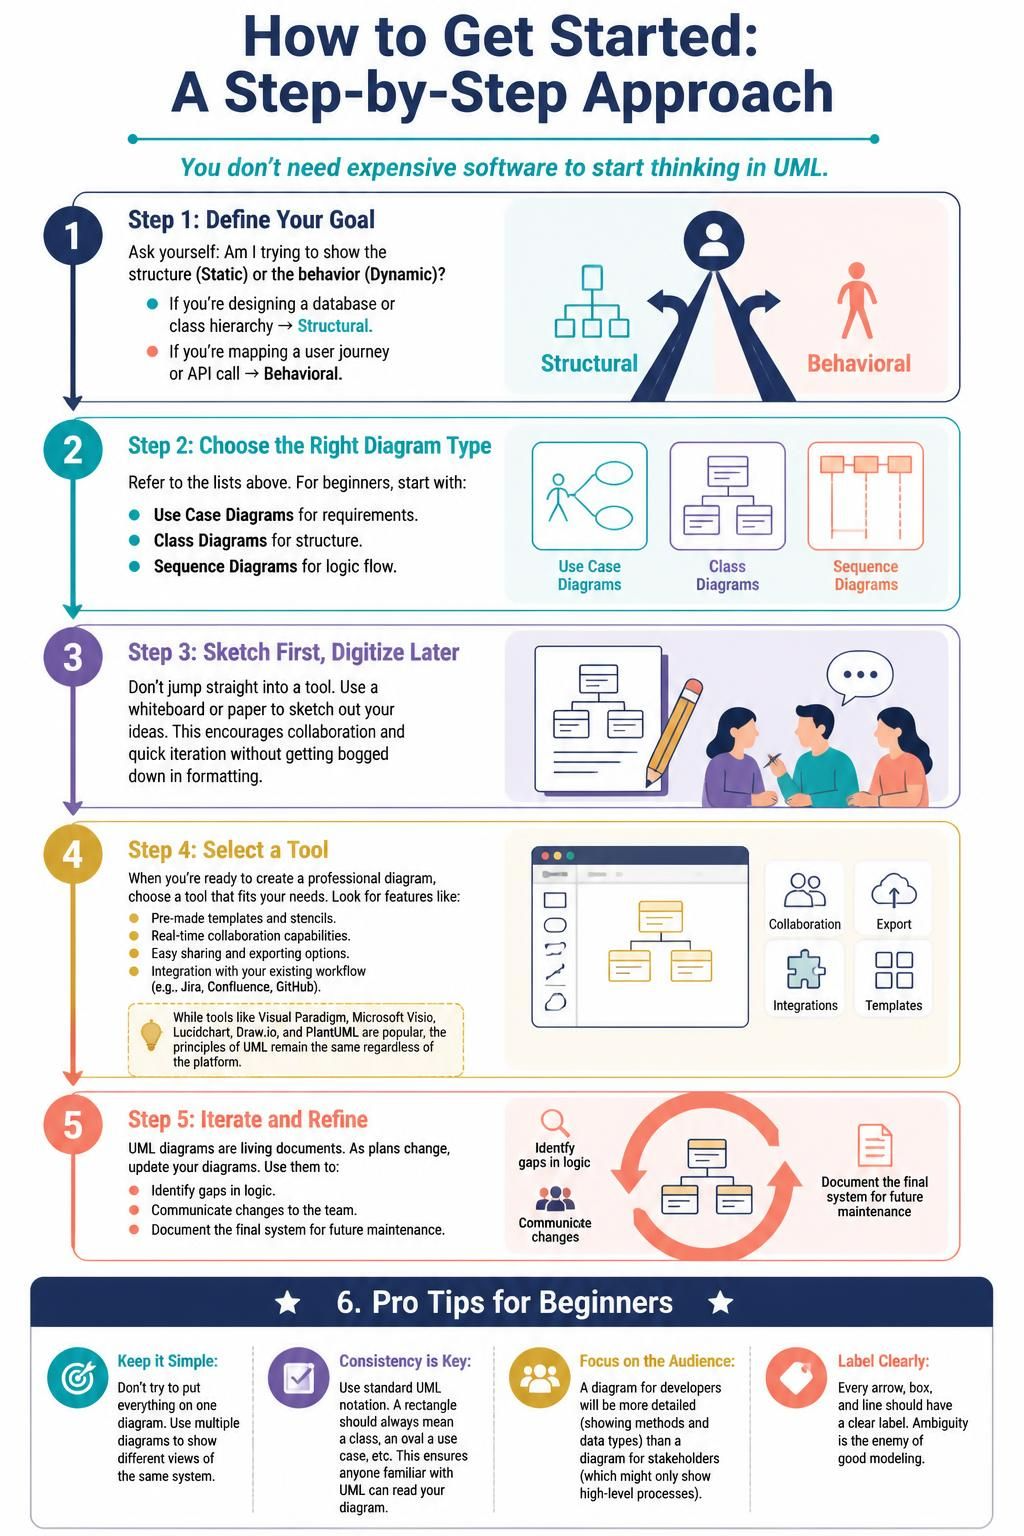
Step 1: Define Your Goal
Ask yourself: Am I trying to show the structure (Static) or the behavior (Dynamic)?
-
If you’re designing a database or class hierarchy → Structural.
-
If you’re mapping a user journey or API call → Behavioral.
Step 2: Choose the Right Diagram Type
Refer to the lists above. For beginners, start with:
-
Use Case Diagrams for requirements.
-
Class Diagrams for structure.
-
Sequence Diagrams for logic flow.
Step 3: Sketch First, Digitize Later
Don’t jump straight into a tool. Use a whiteboard or paper to sketch out your ideas. This encourages collaboration and quick iteration without getting bogged down in formatting.
Step 4: Select a Tool
When you’re ready to create a professional diagram, choose a tool that fits your needs. Look for features like:
-
Pre-made templates and stencils.
-
Real-time collaboration capabilities.
-
Easy sharing and exporting options.
-
Integration with your existing workflow (e.g., Jira, Confluence, GitHub).
(Note: While tools like Visual Paradigm, Microsoft Visio, Lucidchart, Draw.io, and PlantUML are popular, the principles of UML remain the same regardless of the platform.)
Step 5: Iterate and Refine
UML diagrams are living documents. As plans change, update your diagrams. Use them to:
-
Identify gaps in logic.
-
Communicate changes to the team.
-
Document the final system for future maintenance.
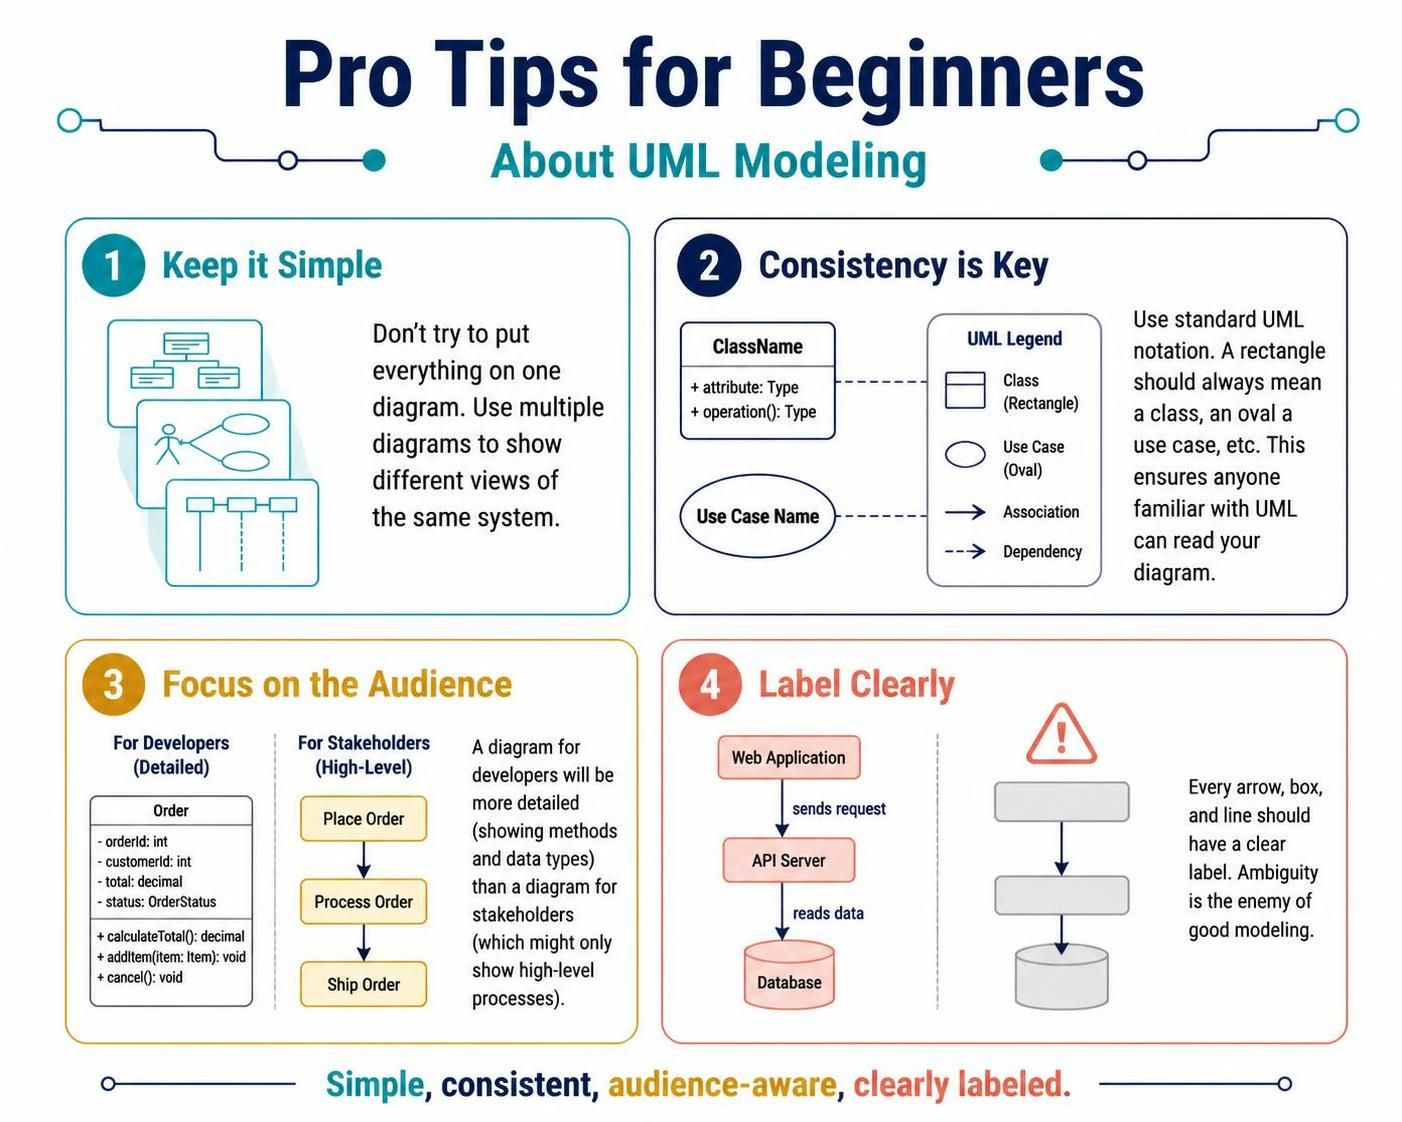
6. Pro Tips for Beginners
-
Keep it Simple: Don’t try to put everything on one diagram. Use multiple diagrams to show different views of the same system.
-
Consistency is Key: Use standard UML notation. A rectangle should always mean a class, an oval a use case, etc. This ensures anyone familiar with UML can read your diagram.
-
Focus on the Audience: A diagram for developers will be more detailed (showing methods and data types) than a diagram for stakeholders (which might only show high-level processes).
-
Label Clearly: Every arrow, box, and line should have a clear label. Ambiguity is the enemy of good modeling.
Related posts:
 Visual Paradigm AI: Generate Professional UML Use Case Diagrams from Text in Seconds
 GourmetReserve Development Simplified: Transforming Requirements with the Best AI-Powered Use Case Modeling Studio
 The Best AI-Powered Database Modeling Tool for Designing Hospital Systems: Visual Paradigm Online
 Automating Student Record System Analysis: From Raw Text to Class Models with Visual Paradigm