Introduction
Unified Modeling Language (UML) is a standardized visual modeling language used to analyze, design, document, and communicate the structure and behavior of software systems. It provides a common set of symbols and diagramming techniques that help developers, architects, business analysts, project managers, and other stakeholders understand how a system works.
UML is not a programming language. Instead, it acts as a visual blueprint for software. Teams can use UML diagrams to describe requirements, plan system architecture, model business processes, document existing applications, and explain how different parts of a system interact.
For example, an e-commerce application may contain users, products, shopping carts, orders, payment services, and delivery services. UML diagrams can represent these elements, show their relationships, and illustrate what happens when a customer places an order.
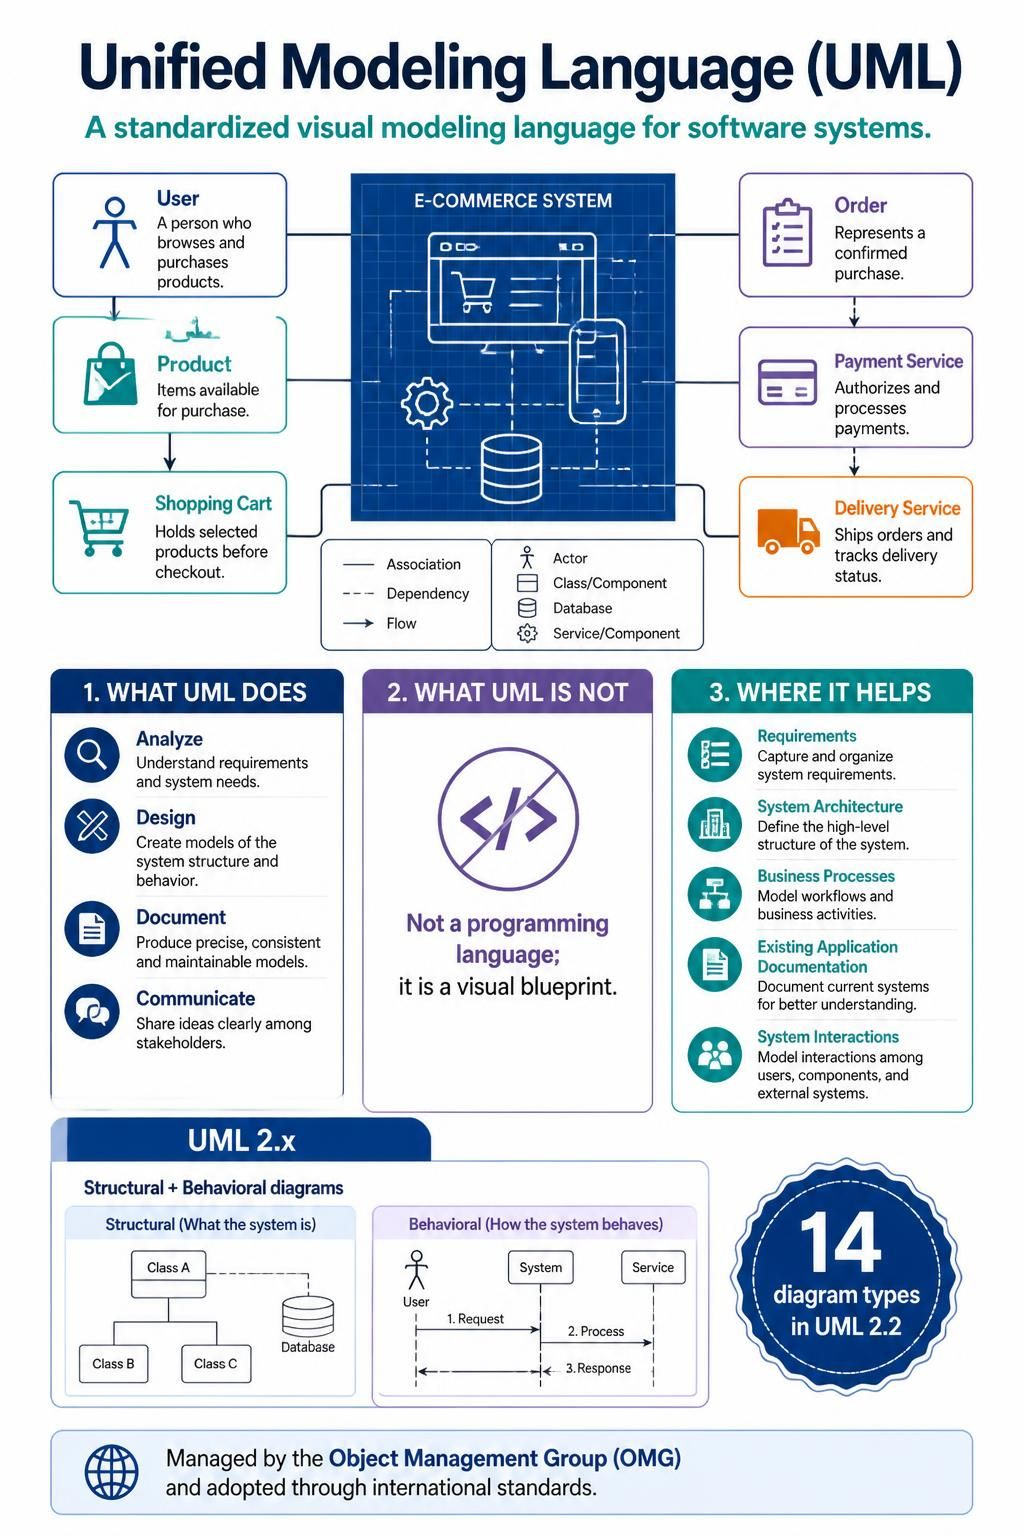
UML is managed as an industry standard by the Object Management Group (OMG) and has also been adopted through international standards. Modern UML commonly refers to UML 2.x, which defines a broad collection of structural and behavioral diagrams. UML 2.2, for example, defined 14 diagram types divided equally between structural and behavioral modeling.
What Is UML?
UML is a general-purpose modeling language for software-intensive systems. It provides a standardized notation for representing:
-
System components
-
Classes and objects
-
User requirements
-
Workflows and business processes
-
Messages exchanged between objects
-
System states and transitions
-
Software deployment environments
-
Dependencies between packages and components
The purpose of UML is not to replace source code. Rather, it helps teams think about and communicate a system before, during, and after implementation.
A UML model can be created at different levels of detail:
-
Conceptual level: Describes major business concepts without implementation details.
-
Analysis level: Explores requirements, responsibilities, and system behavior.
-
Design level: Defines classes, interfaces, components, and interactions.
-
Implementation level: Represents details that closely correspond to source code and deployment infrastructure.
Why Is UML Important?
UML is useful because software systems can become difficult to understand when they are described only through source code or lengthy written documents.
Simplifies complex systems
Diagrams provide a visual overview of large systems. A class diagram, for example, can show dozens of classes and their relationships more clearly than several pages of text.
Improves communication
Developers, designers, architects, testers, business analysts, and customers may have different technical backgrounds. UML gives them a shared visual language for discussing system requirements and design decisions.
Supports planning
Teams can model workflows, classes, services, and deployment environments before writing code. This can expose missing requirements, duplicated responsibilities, and architectural problems at an early stage.
Helps document software
UML diagrams can serve as long-term technical documentation. They help new developers understand an existing system and assist maintenance teams when changes are required.
Encourages better design
Creating a model forces a team to consider questions such as:
-
Which object is responsible for a task?
-
How are components connected?
-
What happens when an operation fails?
-
Which classes depend on one another?
-
How does the system respond to different events?
Key UML Concepts
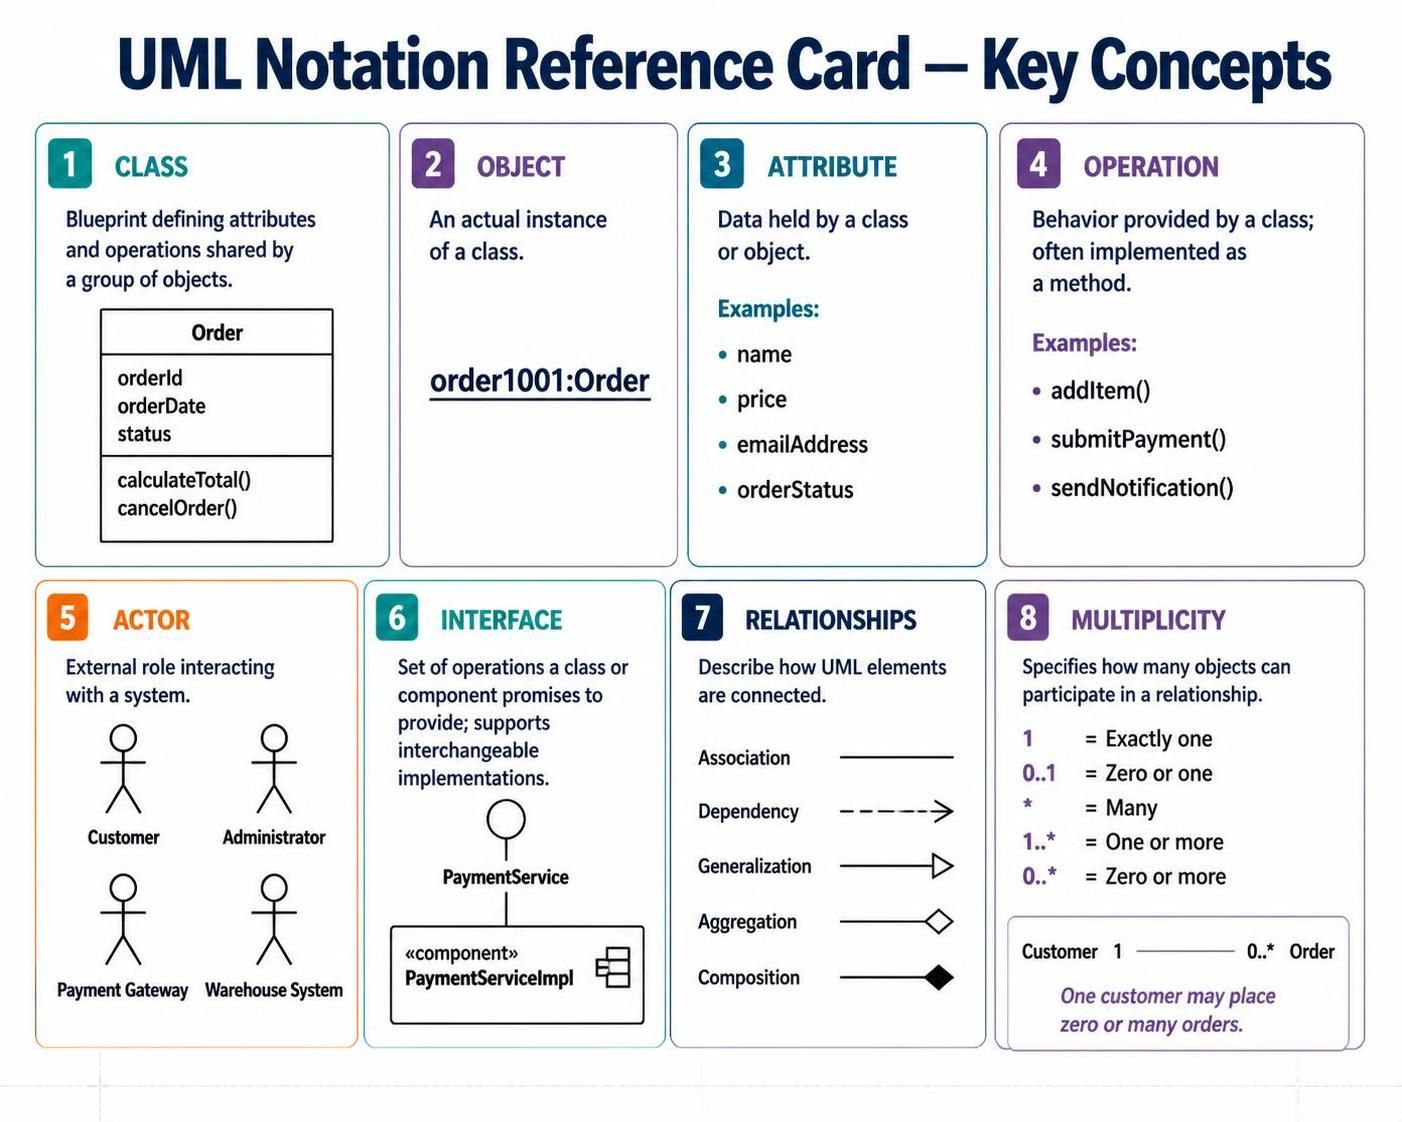
Class
A class is a blueprint that defines the attributes and operations shared by a group of objects.
For example, an Order class might contain:
-
Attributes:
orderId,orderDate, andstatus -
Operations:
calculateTotal()andcancelOrder()
Object
An object is an actual instance of a class. If Order is a class, order1001 may be a specific object created from that class.
Attribute
An attribute represents data held by a class or object.
Examples include:
-
name -
price -
emailAddress -
orderStatus
Operation
An operation represents behavior provided by a class. Operations are often implemented as methods in programming languages.
Examples include:
-
addItem() -
submitPayment() -
sendNotification()
Actor
An actor is an external role that interacts with a system. An actor can be a person, another system, or an external device.
Examples include:
-
Customer
-
Administrator
-
Payment Gateway
-
Warehouse System
Interface
An interface defines a set of operations that a class or component promises to provide. Interfaces help reduce dependencies and support interchangeable implementations.
Relationship
A relationship describes how UML elements are connected. Common relationships include association, dependency, generalization, aggregation, and composition.
Multiplicity
Multiplicity specifies how many objects can participate in a relationship.
Common examples include:
-
1: Exactly one -
0..1: Zero or one -
*: Many -
1..*: One or more -
0..*: Zero or more
For example, one customer may place zero or many orders. This can be represented as:
Customer 1 -------- 0..* Order
UML Diagram Categories
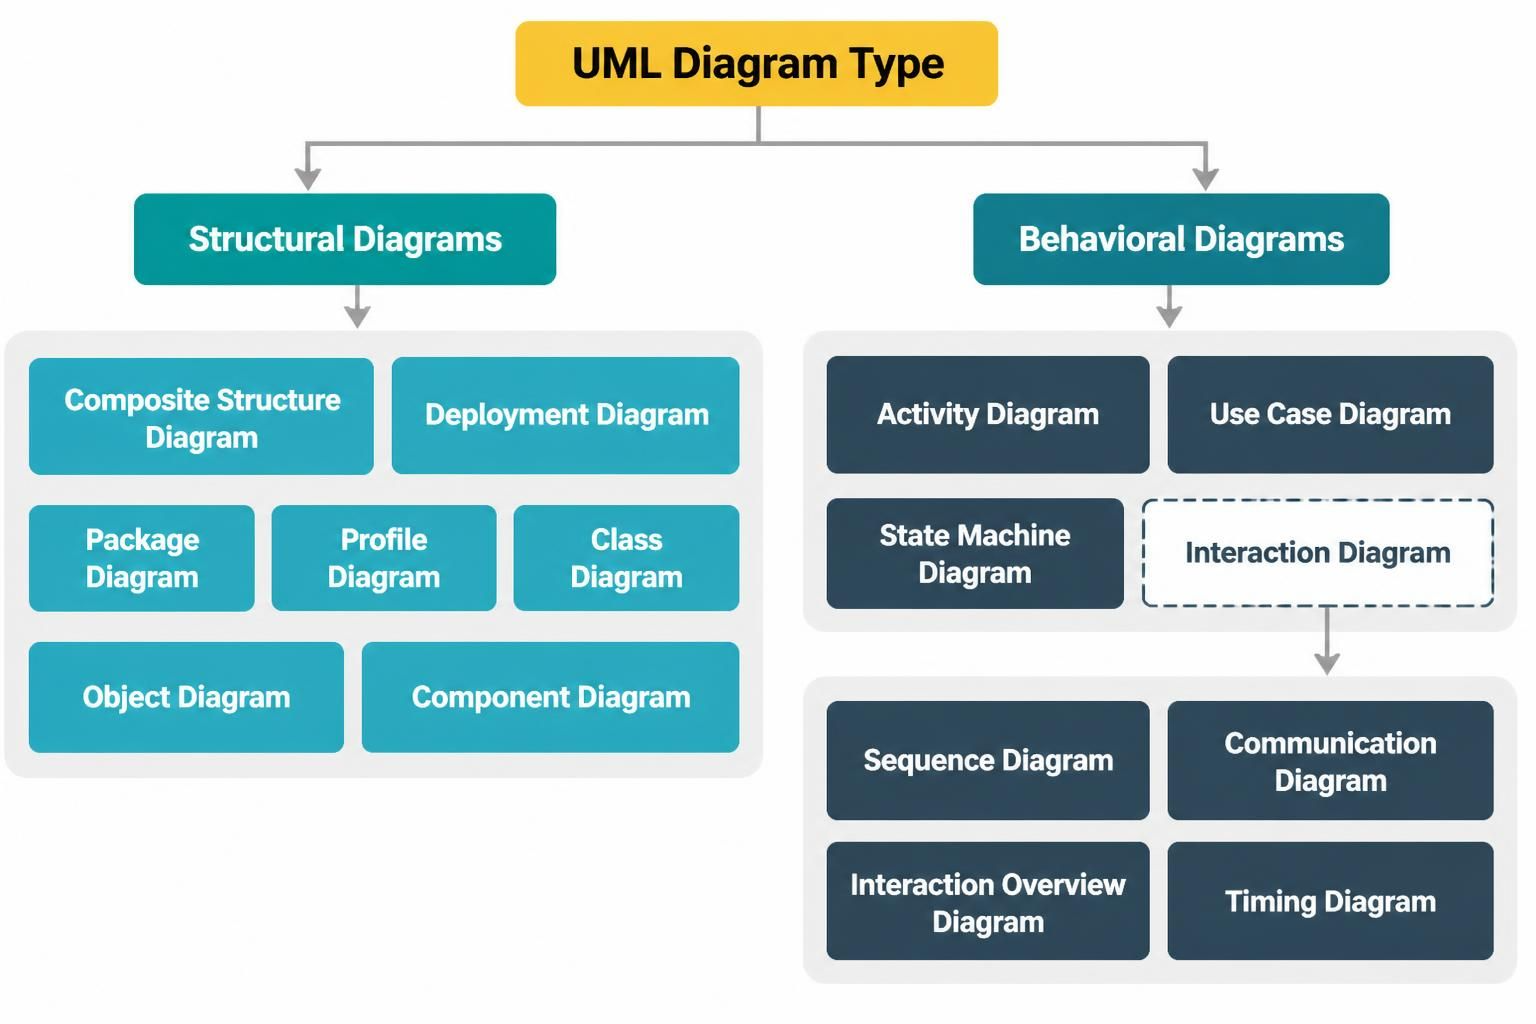
UML diagrams are commonly divided into two main categories:
-
Structural diagrams
-
Behavioral diagrams
Structural diagrams describe what a system is made of. Behavioral diagrams describe what a system does and how it behaves over time.
Structural UML Diagrams
Structural diagrams represent the static organization of a system. They focus on classes, objects, components, packages, nodes, and relationships.
1. Class Diagram
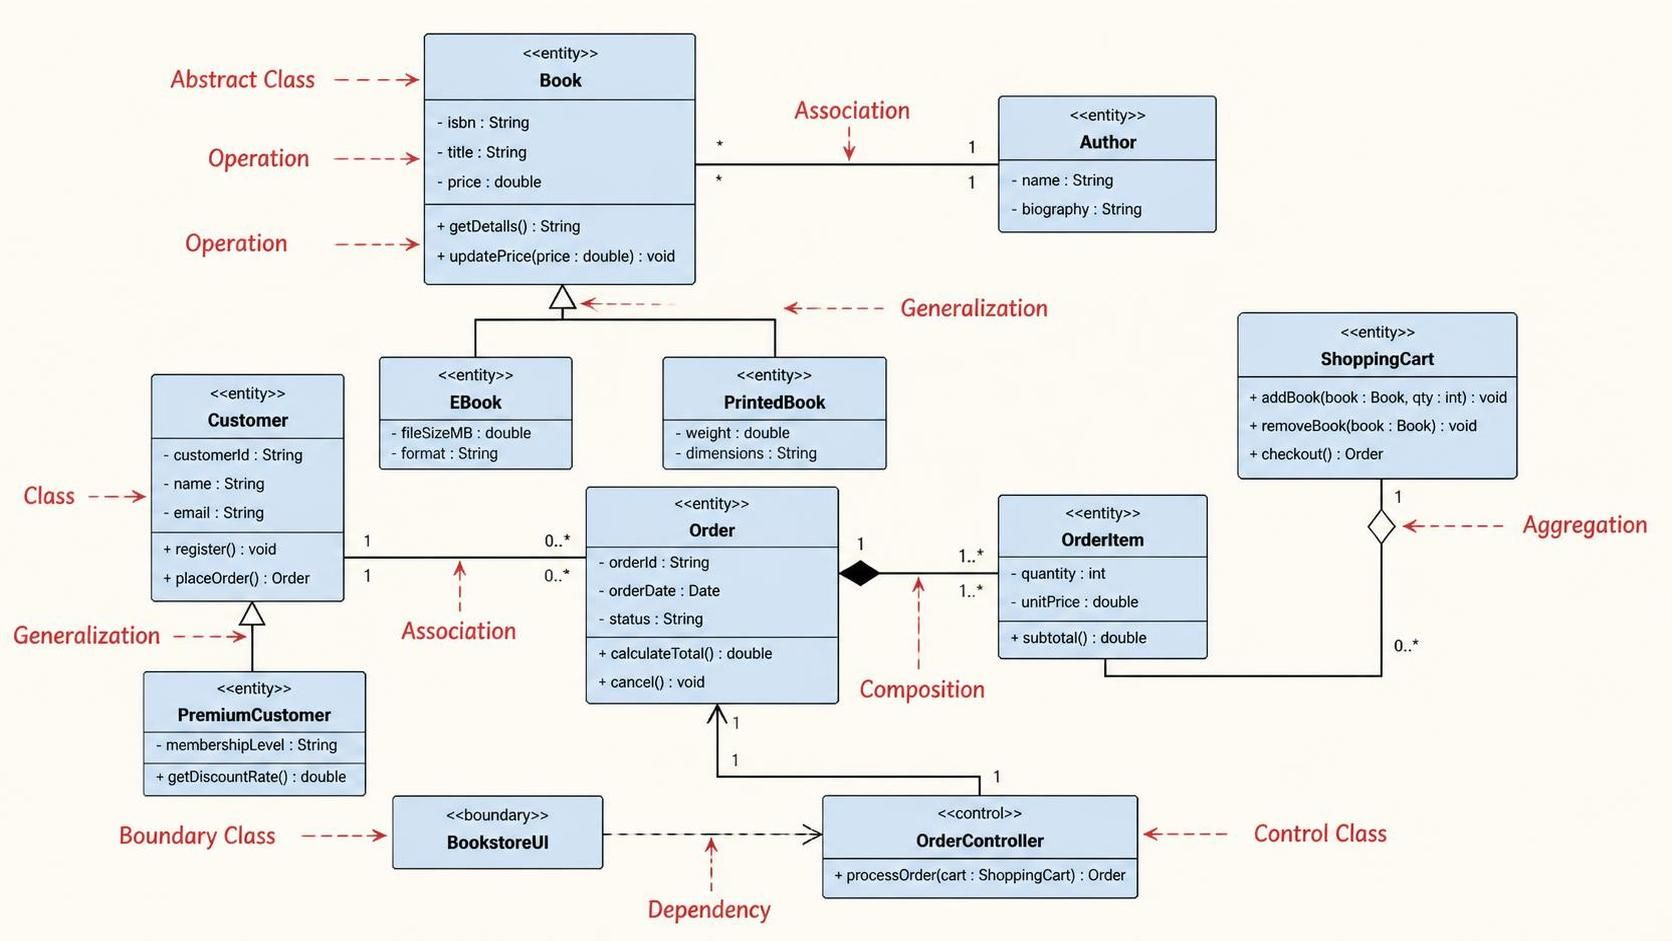
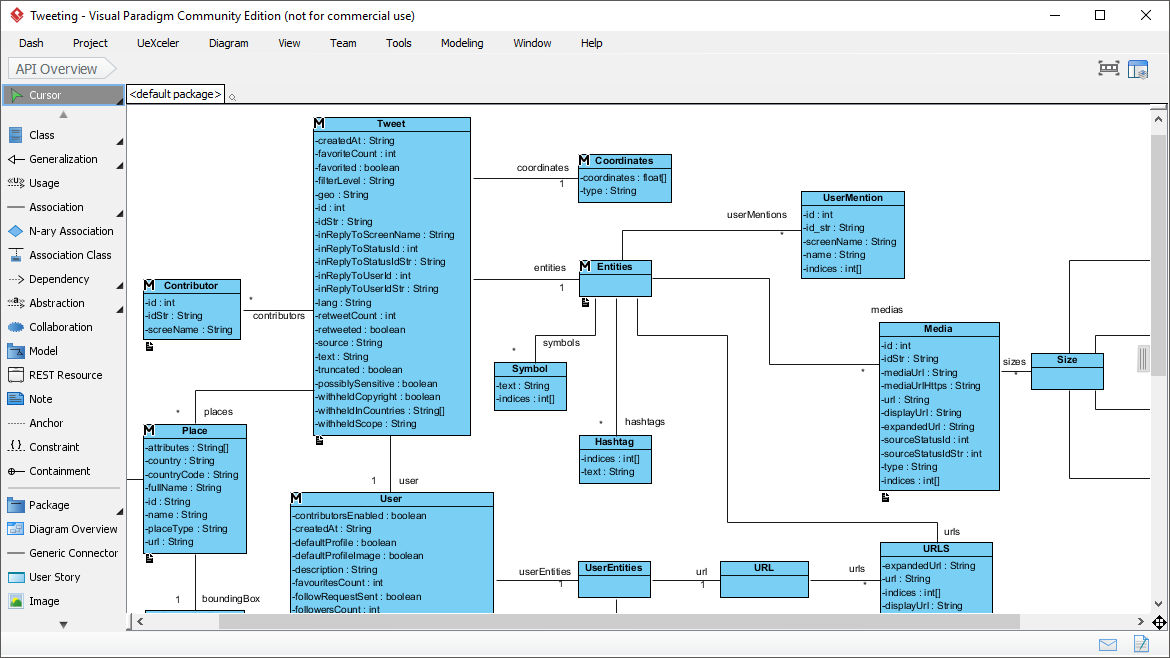
A class diagram is one of the most widely used UML diagrams. It represents the static structure of a system by showing:
-
Classes
-
Attributes
-
Operations
-
Interfaces
-
Relationships
-
Visibility
-
Multiplicity
A simplified e-commerce class model might look like this:
Customer
- customerId
- name
+ placeOrder()

Order
- orderId
- orderDate
- status
+ calculateTotal()

Product
- productId
- name
- price
+ updatePrice()
Possible relationships include:
Customer 1 -------- 0..* Order
Order 1 -------- 1..* Product
In a more detailed design, an OrderItem class may be introduced between Order and Product.
Class diagrams are useful for:
-
Domain modeling
-
Object-oriented design
-
Database and application planning
-
Identifying responsibilities
-
Explaining inheritance and interfaces
A class diagram describes classes in general, while an object diagram shows specific instances of those classes. Visual Paradigm describes class diagrams as models of classes, attributes, operations, and relationships within an object-oriented system.
2. Object Diagram
An object diagram shows a snapshot of a system at a particular moment. It represents actual object instances rather than general classes.
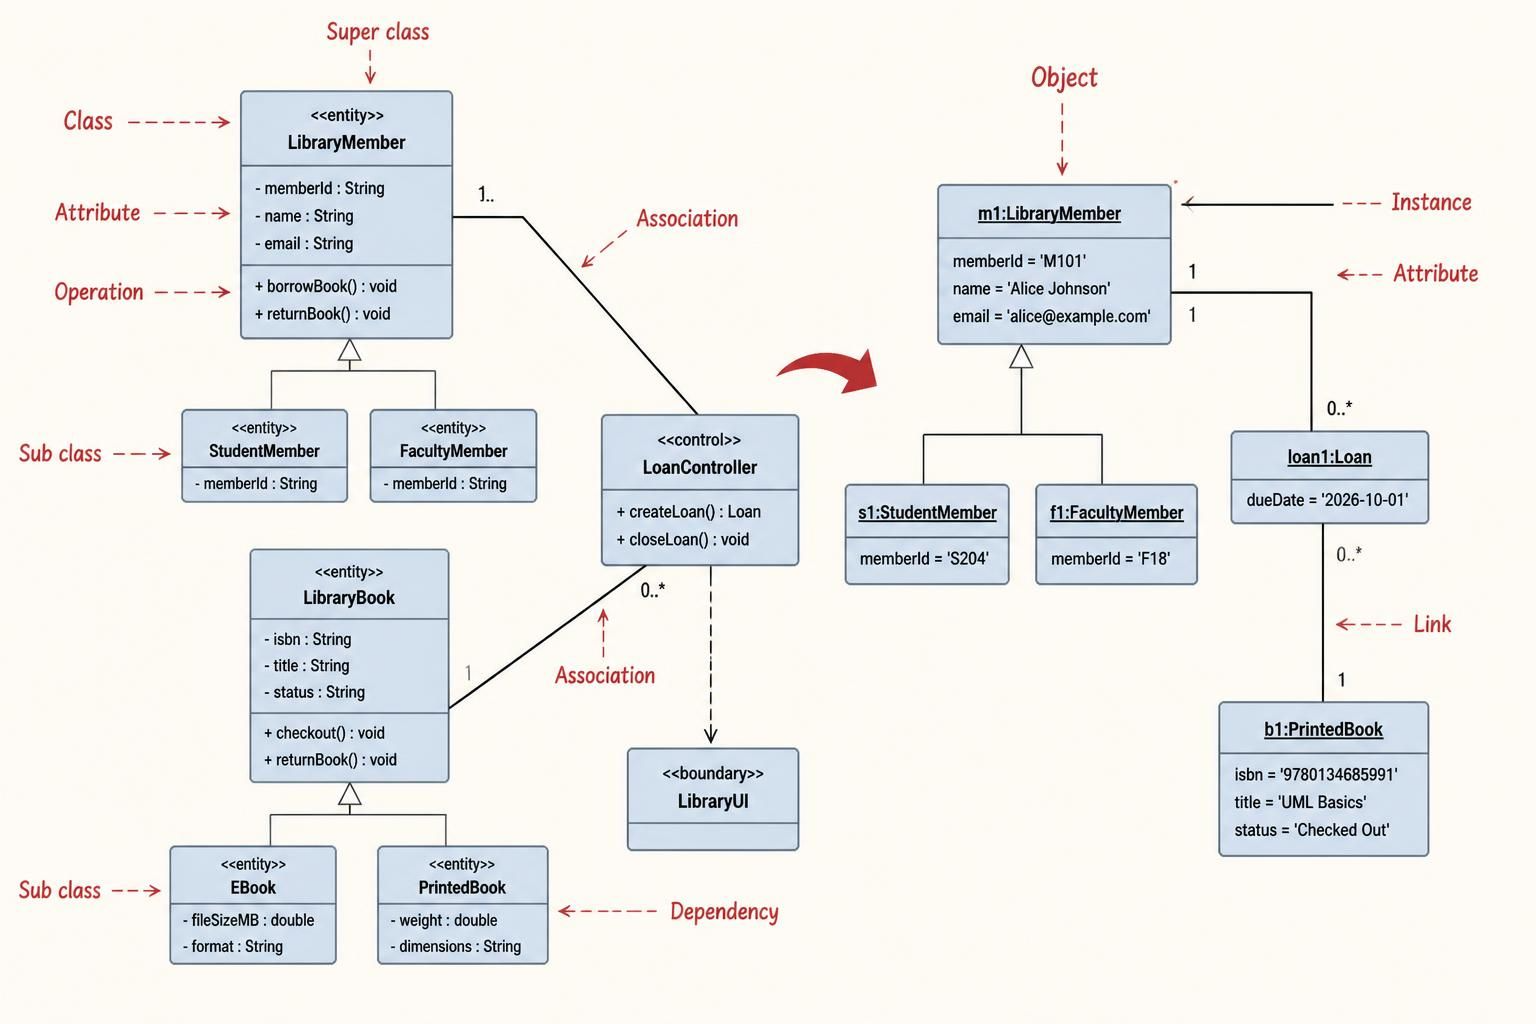
For example:
customerA:Customer
name = "Alex"

order1001:Order
status = "Paid"
An object diagram is useful when you need to demonstrate:
-
The state of objects at runtime
-
Example data relationships
-
A specific scenario
-
How instances of classes are connected
A class diagram might show that a customer can place many orders. An object diagram could show that customerA currently owns order1001 and order1002.
3. Component Diagram
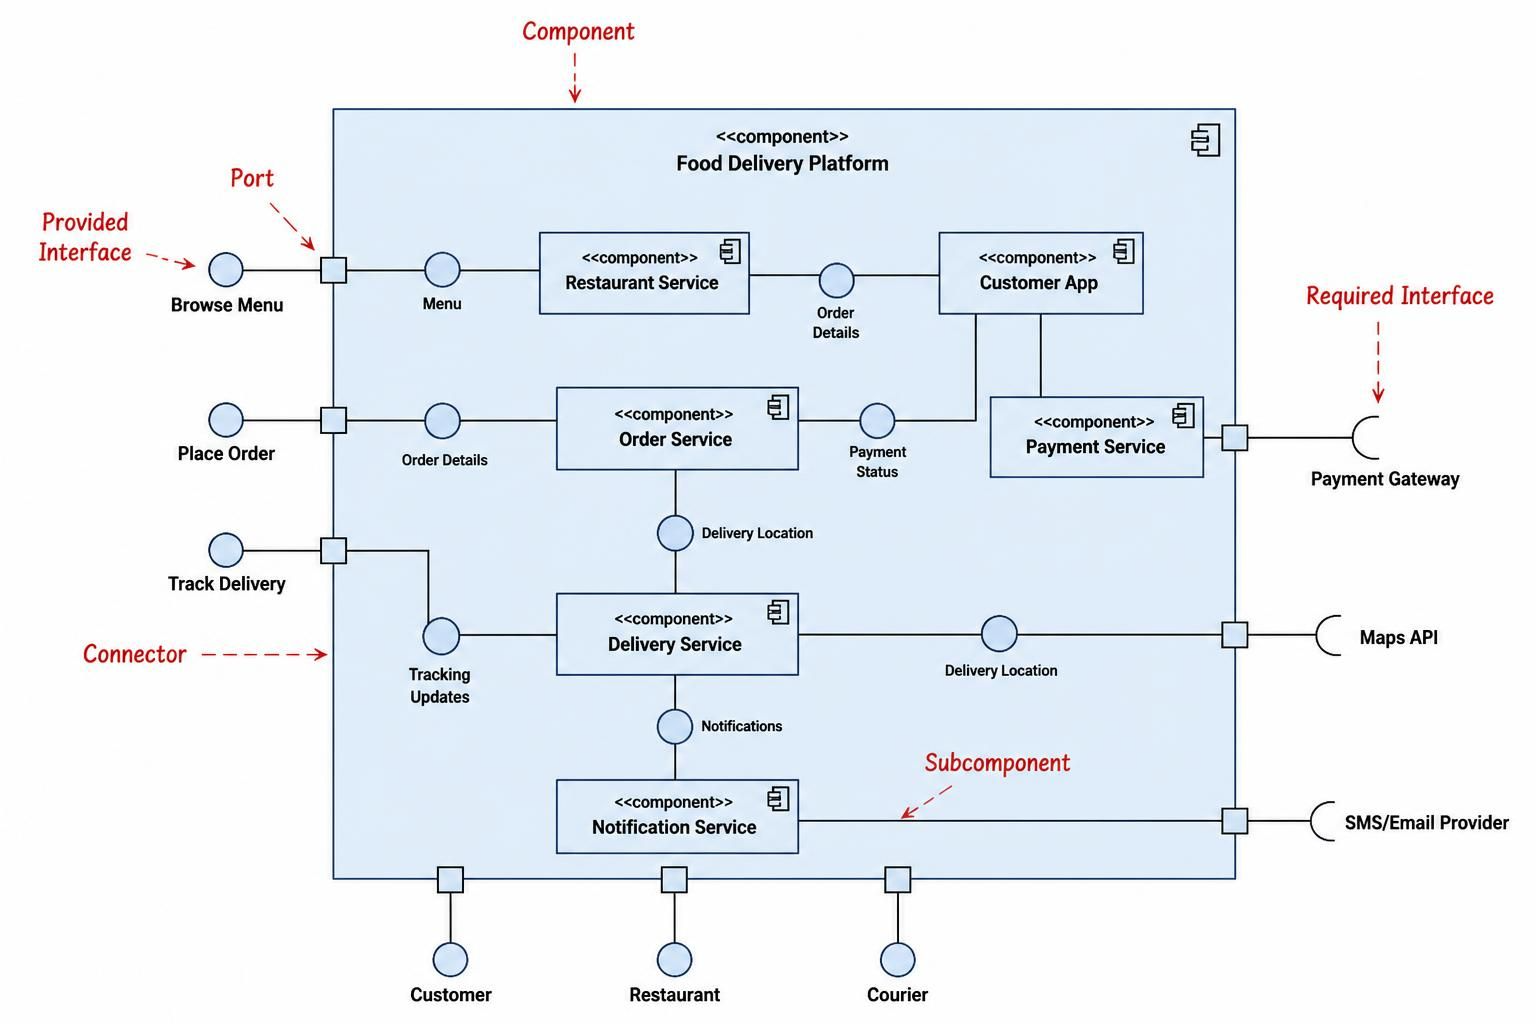
A component diagram shows the organization and dependencies of replaceable software components.
An e-commerce component diagram could include:
-
Web Application
-
Order Service
-
Product Service
-
Payment Service
-
Notification Service
-
Database
Example:
Web Application --> Order Service
Order Service --> Payment Service
Order Service --> Notification Service
Order Service --> Order Database
Component diagrams are especially useful for:
-
Microservice architectures
-
Service-oriented systems
-
API design
-
Application architecture
-
Showing service boundaries and dependencies
4. Deployment Diagram
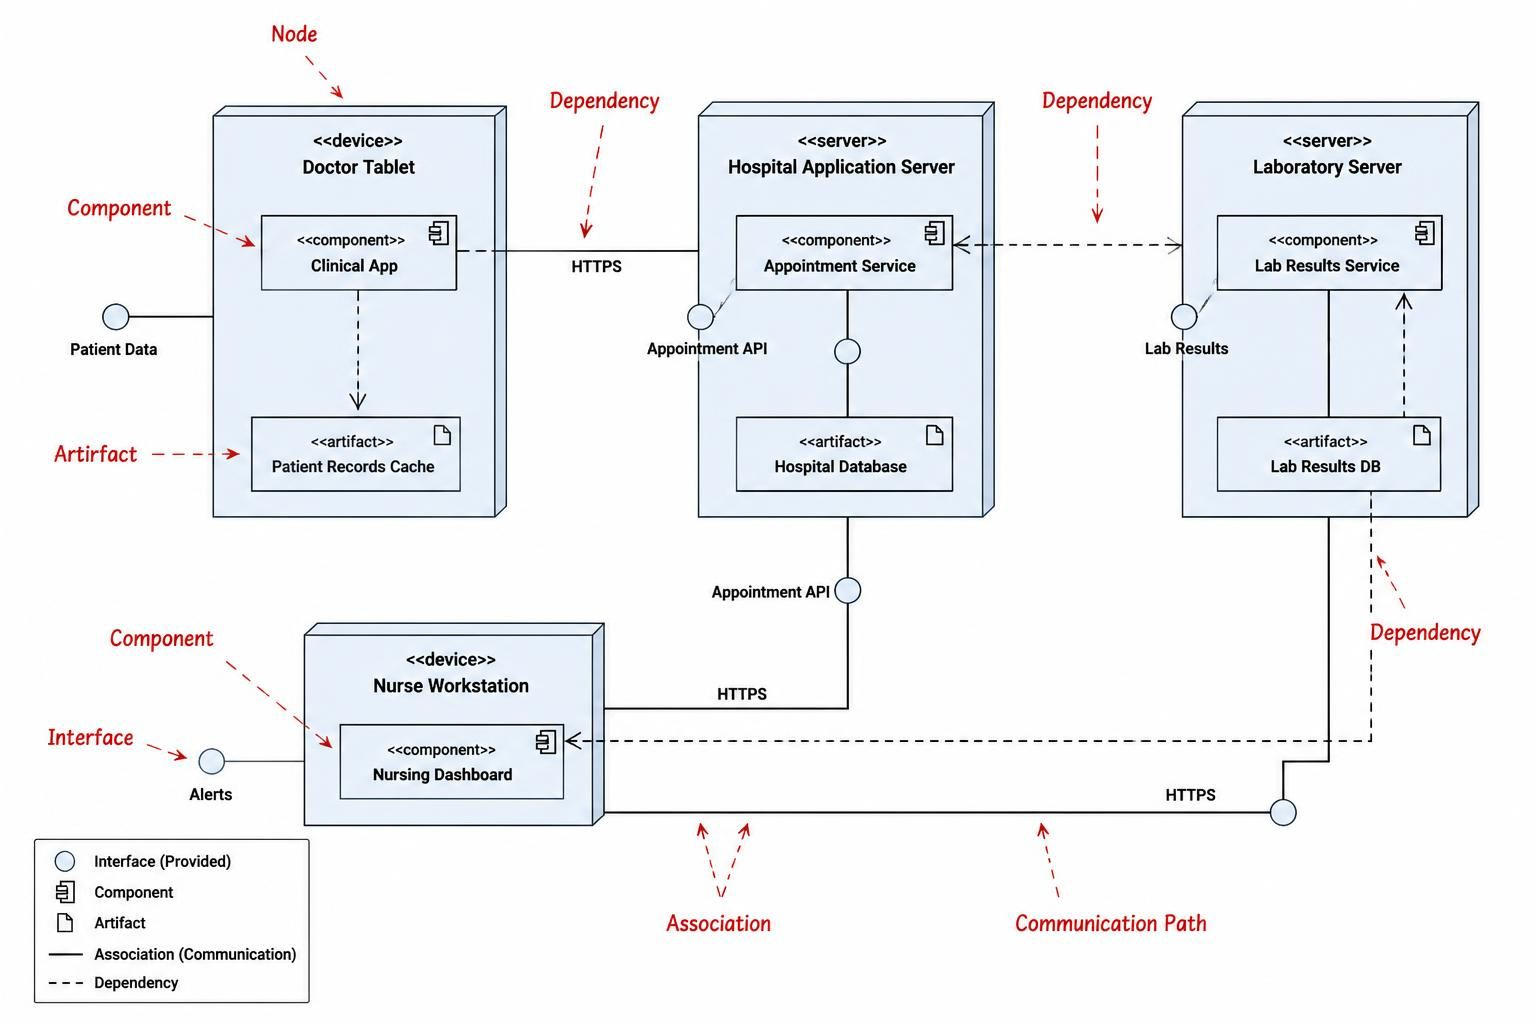
A deployment diagram represents the physical or virtual environment in which software is executed.
It may show:
-
Client devices
-
Web servers
-
Application servers
-
Database servers
-
Cloud nodes
-
Containers
-
Network connections
-
Deployed software artifacts
Example:
Customer Device
       |
       v
Web Server
       |
       v
Application Server
       |
       v
Database Server
Deployment diagrams help architects understand where software runs and how infrastructure components communicate.
5. Package Diagram
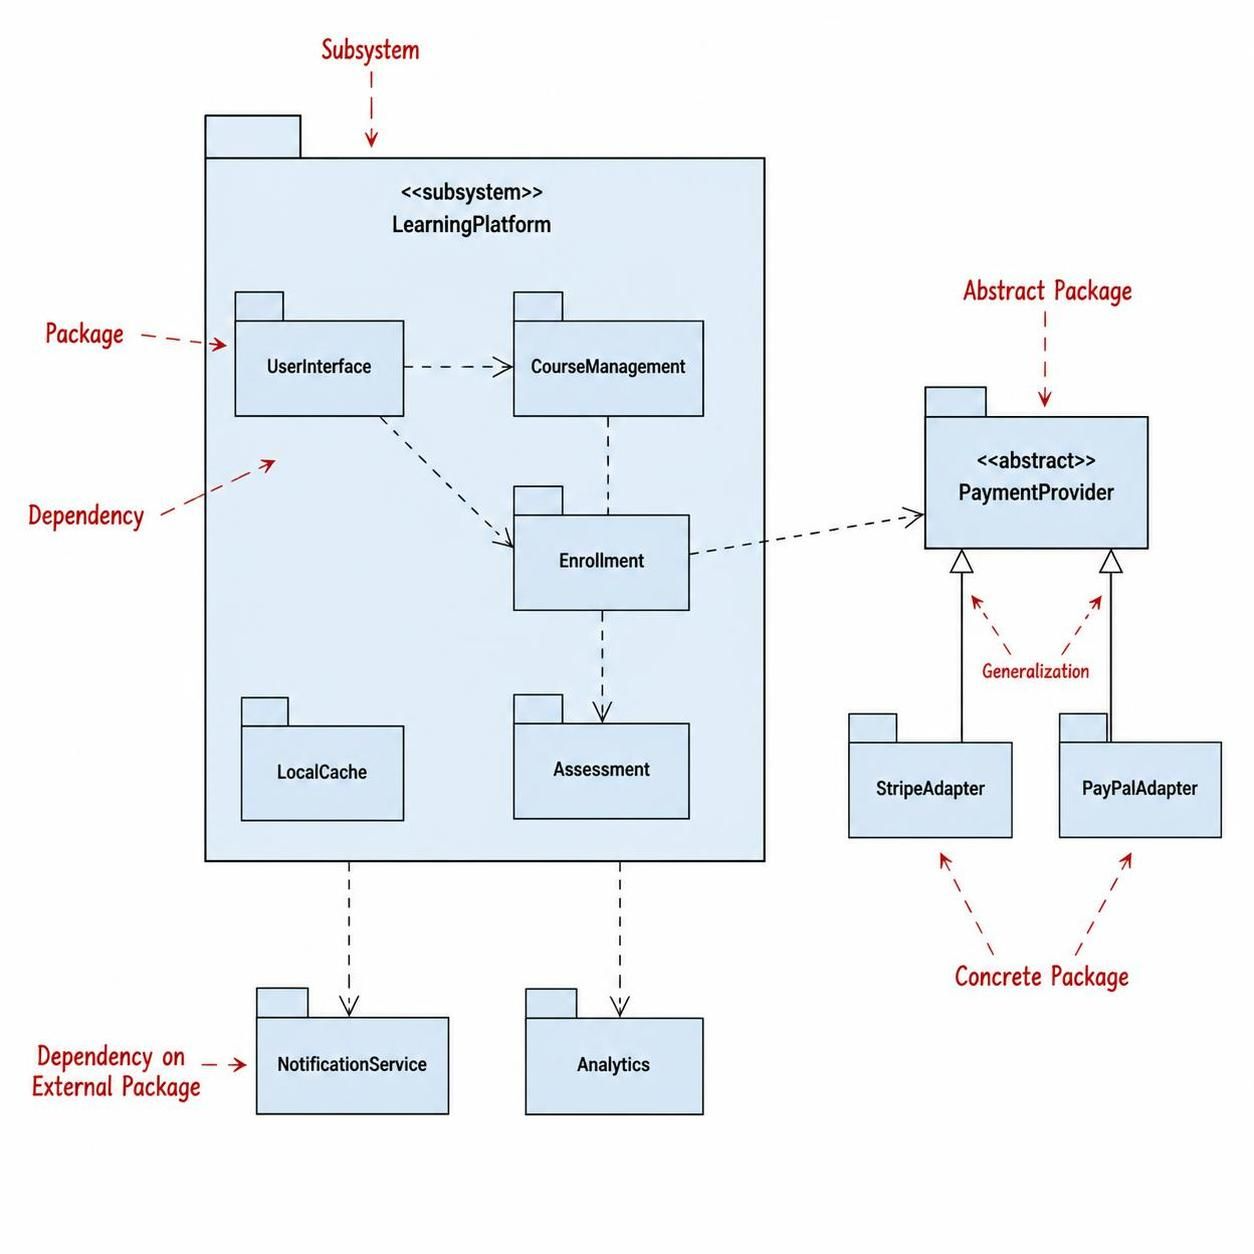
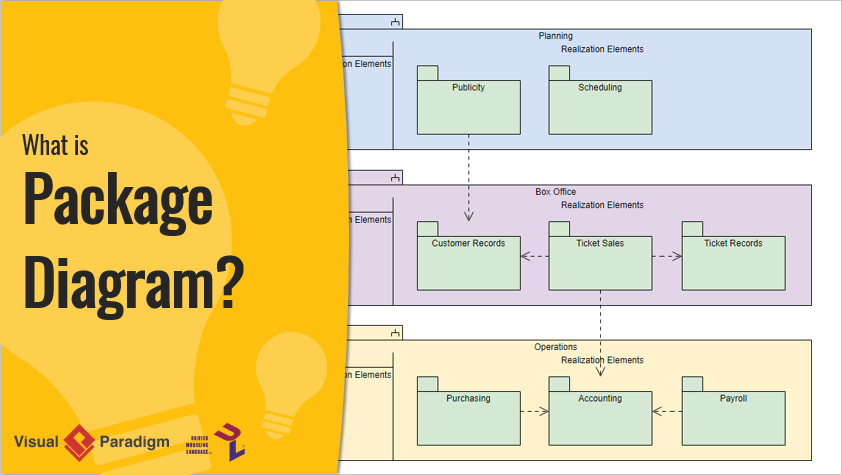
A package diagram organizes related model elements into packages and shows dependencies between those packages.
A project may contain packages such as:
-
user -
catalog -
order -
payment -
notification
Example:
order --> user
order --> catalog
order --> payment
payment --> notification
Package diagrams are useful for:
-
Organizing large models
-
Showing module dependencies
-
Identifying architectural layers
-
Preventing unwanted coupling
6. Composite Structure Diagram
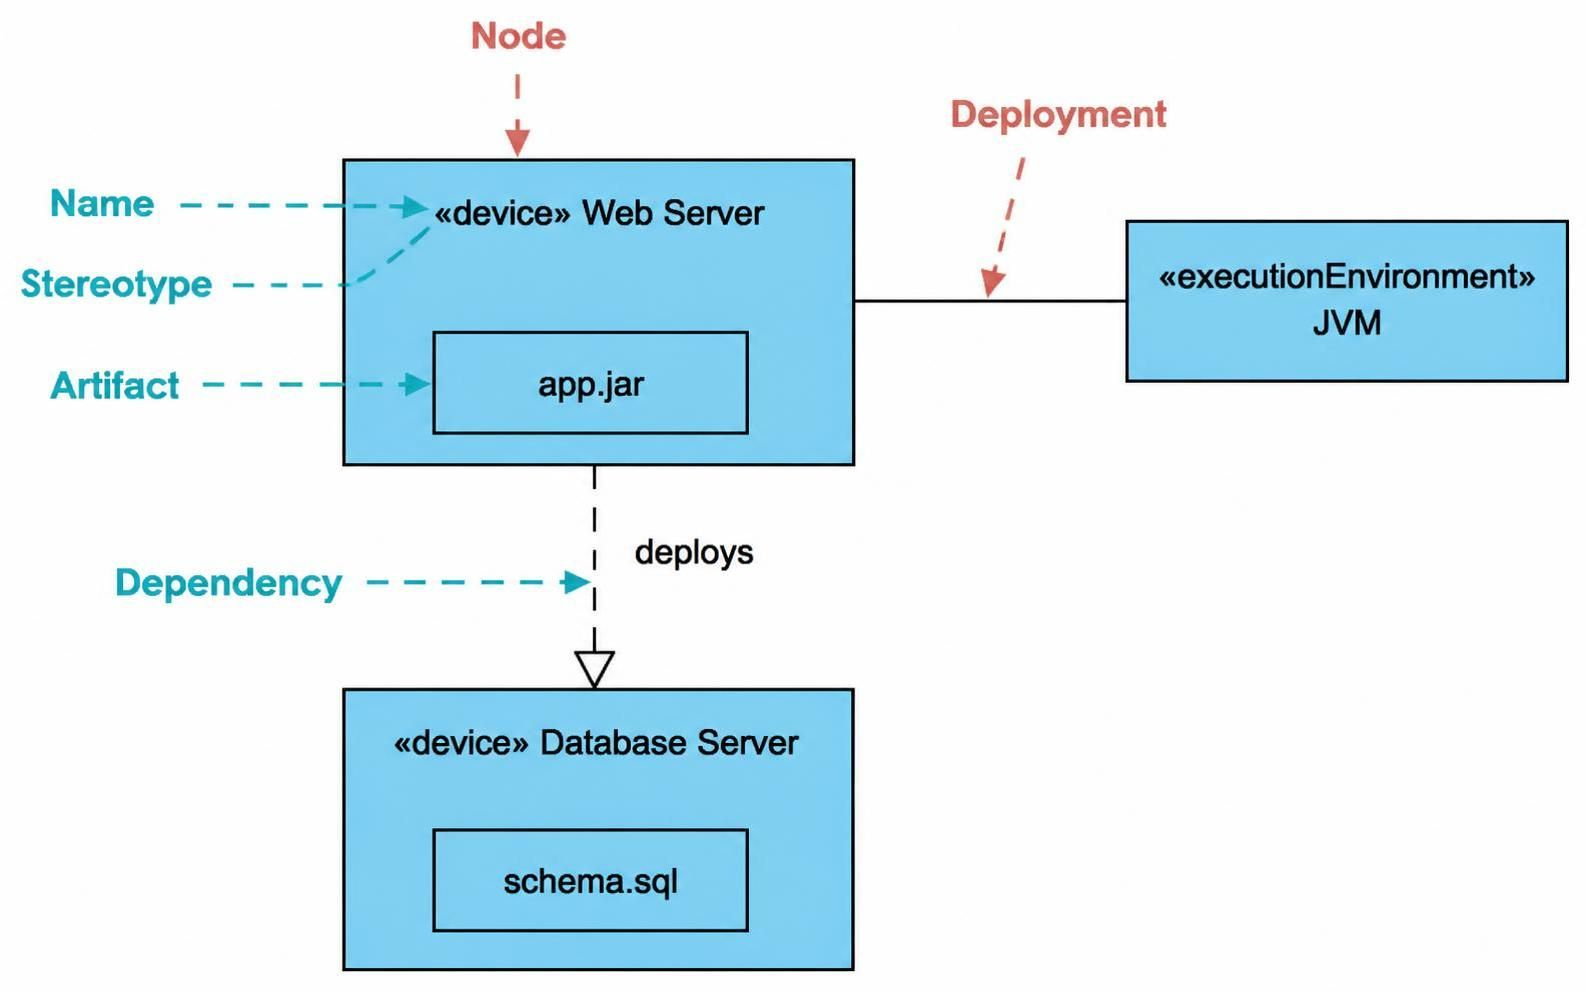
A composite structure diagram shows the internal structure of a class, component, or other structured classifier.
It can display:
-
Internal parts
-
Ports
-
Connectors
-
Internal collaborations
-
Relationships between internal elements
For example, an OrderController may contain or connect to:
-
OrderService -
OrderRepository -
PaymentService -
NotificationService
Unlike a component diagram, which generally focuses on high-level components, a composite structure diagram focuses on the internal organization of a classifier.
7. Profile Diagram
A profile diagram extends UML for a particular domain or technology. It defines specialized modeling elements through stereotypes, tagged values, and constraints.
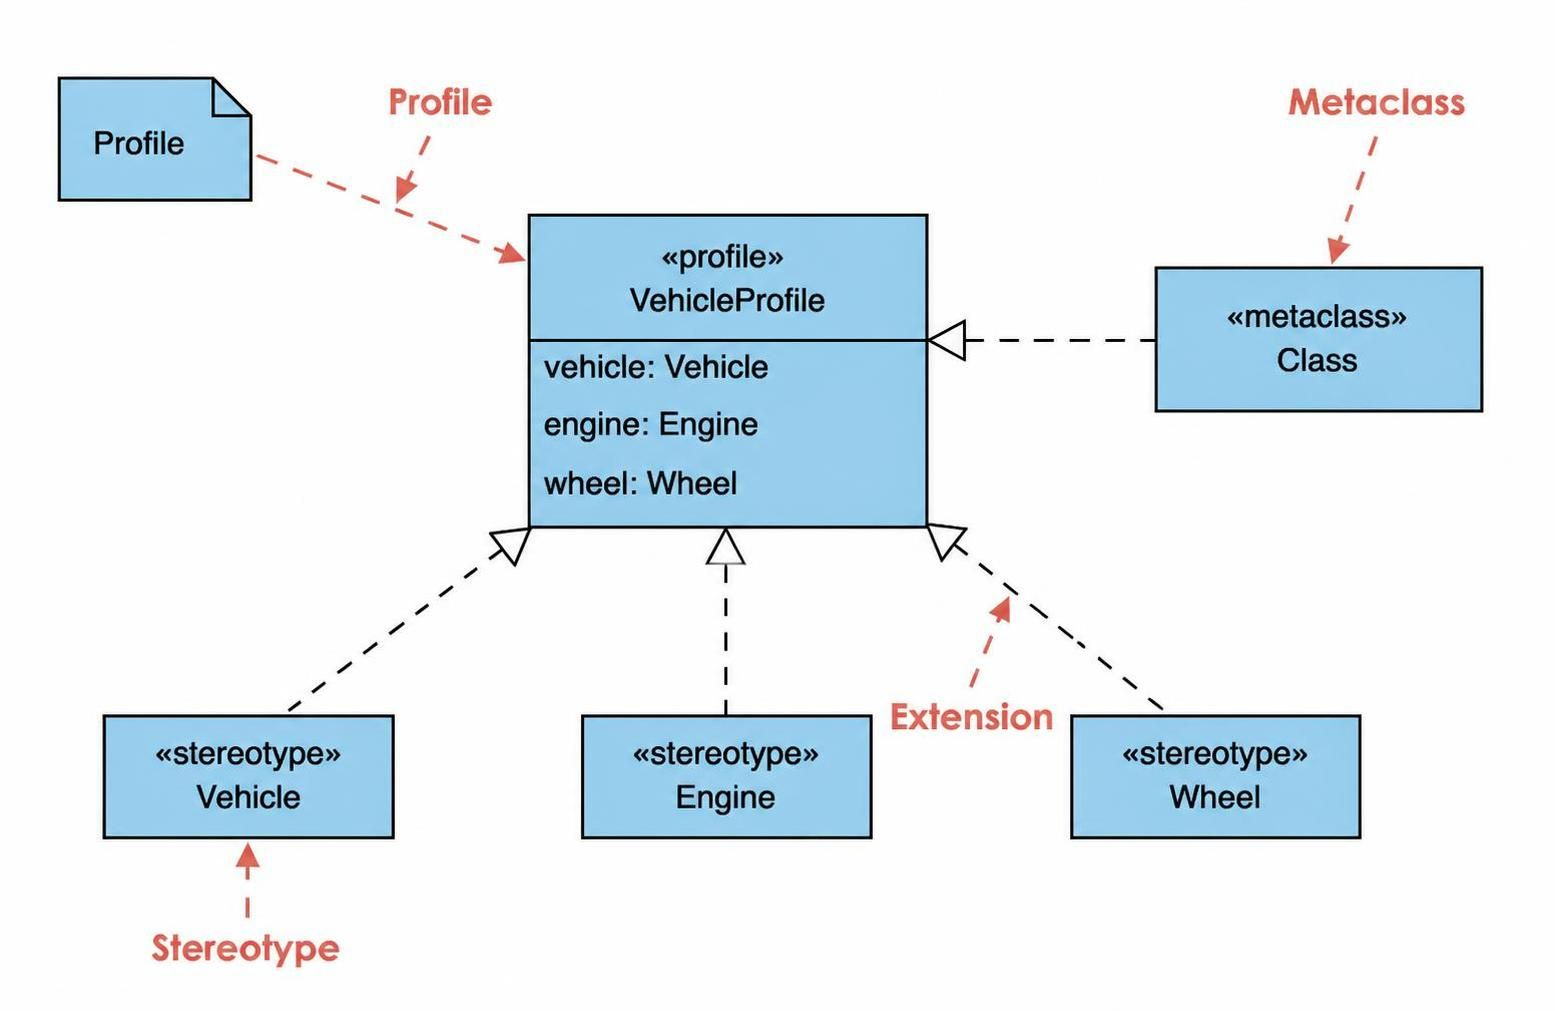
For example, a profile may introduce stereotypes such as:
<<entity>>
<<controller>>
<<service>>
<<microservice>>
Profile diagrams are useful when standard UML notation needs to be adapted for:
-
Web applications
-
Enterprise architecture
-
Real-time systems
-
Embedded systems
-
Specific programming frameworks
-
Industry-specific modeling
The profile diagram is often omitted from introductory lists, but it is included among the standard UML 2.x diagram types. UML 2.x is commonly described as having seven structural and seven behavioral diagram types.
Behavioral UML Diagrams
Behavioral diagrams describe the dynamic behavior of a system. They show workflows, events, interactions, state changes, and responses.
1. Use Case Diagram
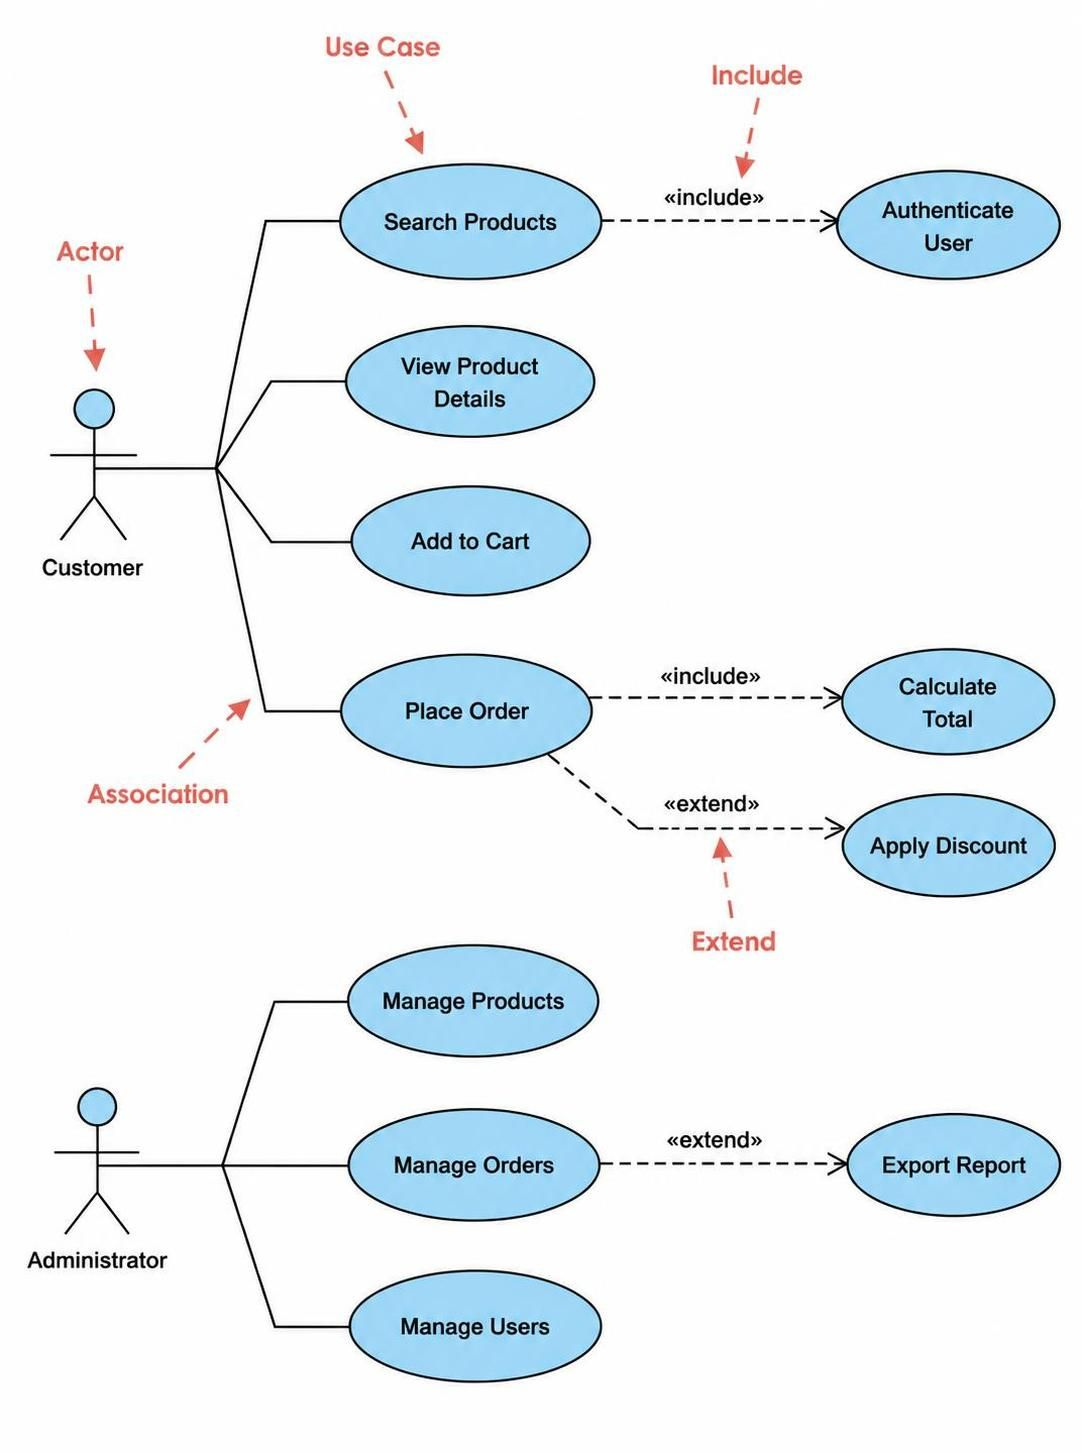
A use case diagram presents the functional requirements of a system from the perspective of external actors.
A typical online shopping system may include these actors:
-
Customer
-
Administrator
-
Payment Gateway
-
Delivery Service
Possible use cases include:
-
Register Account
-
Log In
-
Browse Products
-
Add Product to Cart
-
Place Order
-
Make Payment
-
Track Delivery
-
Manage Products
A use case diagram provides a high-level view of what the system does without describing implementation details.
Important relationships include:
-
Association: Connects an actor to a use case.
-
Include: Shows behavior that is always reused by another use case.
-
Extend: Shows optional or conditional behavior.
-
Generalization: Shows specialization between actors or use cases.
For example, Place Order may include Make Payment, while Apply Discount may extend Place Order.
2. Activity Diagram
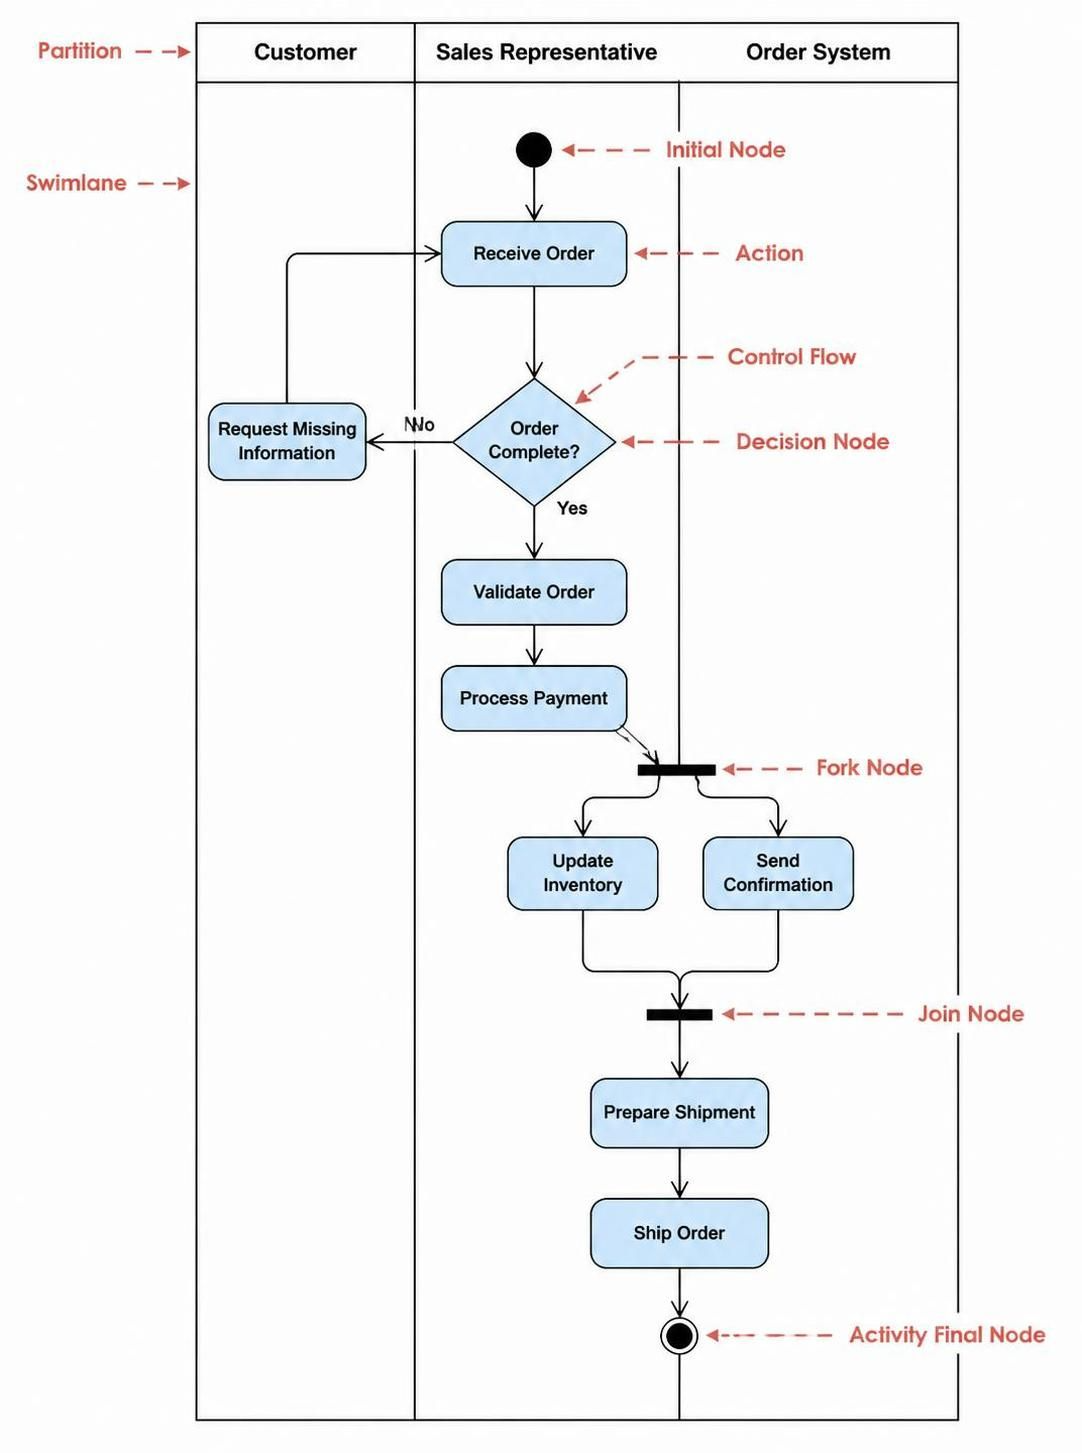
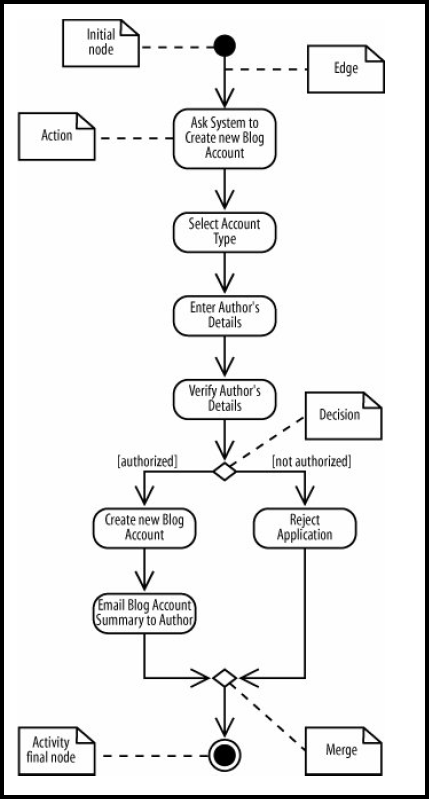
An activity diagram represents the flow of control in a process or use case. It is useful for modeling sequential and concurrent workflows.
Example: placing an order
Start
  |
Browse Products
  |
Add Product to Cart
  |
Proceed to Checkout
  |
Enter Payment Details
  |
Payment Successful?
 /              \
No              Yes
|                |
Show Error       Create Order
                  |
              Send Confirmation
                  |
                 End
Activity diagrams can represent:
-
Actions
-
Decisions
-
Merges
-
Loops
-
Parallel activities
-
Start and end nodes
-
Swimlanes for responsibilities
Swimlanes can show which actor or system component performs each action. For example, one lane may represent the customer, another the order service, and another the payment gateway.
3. Sequence Diagram
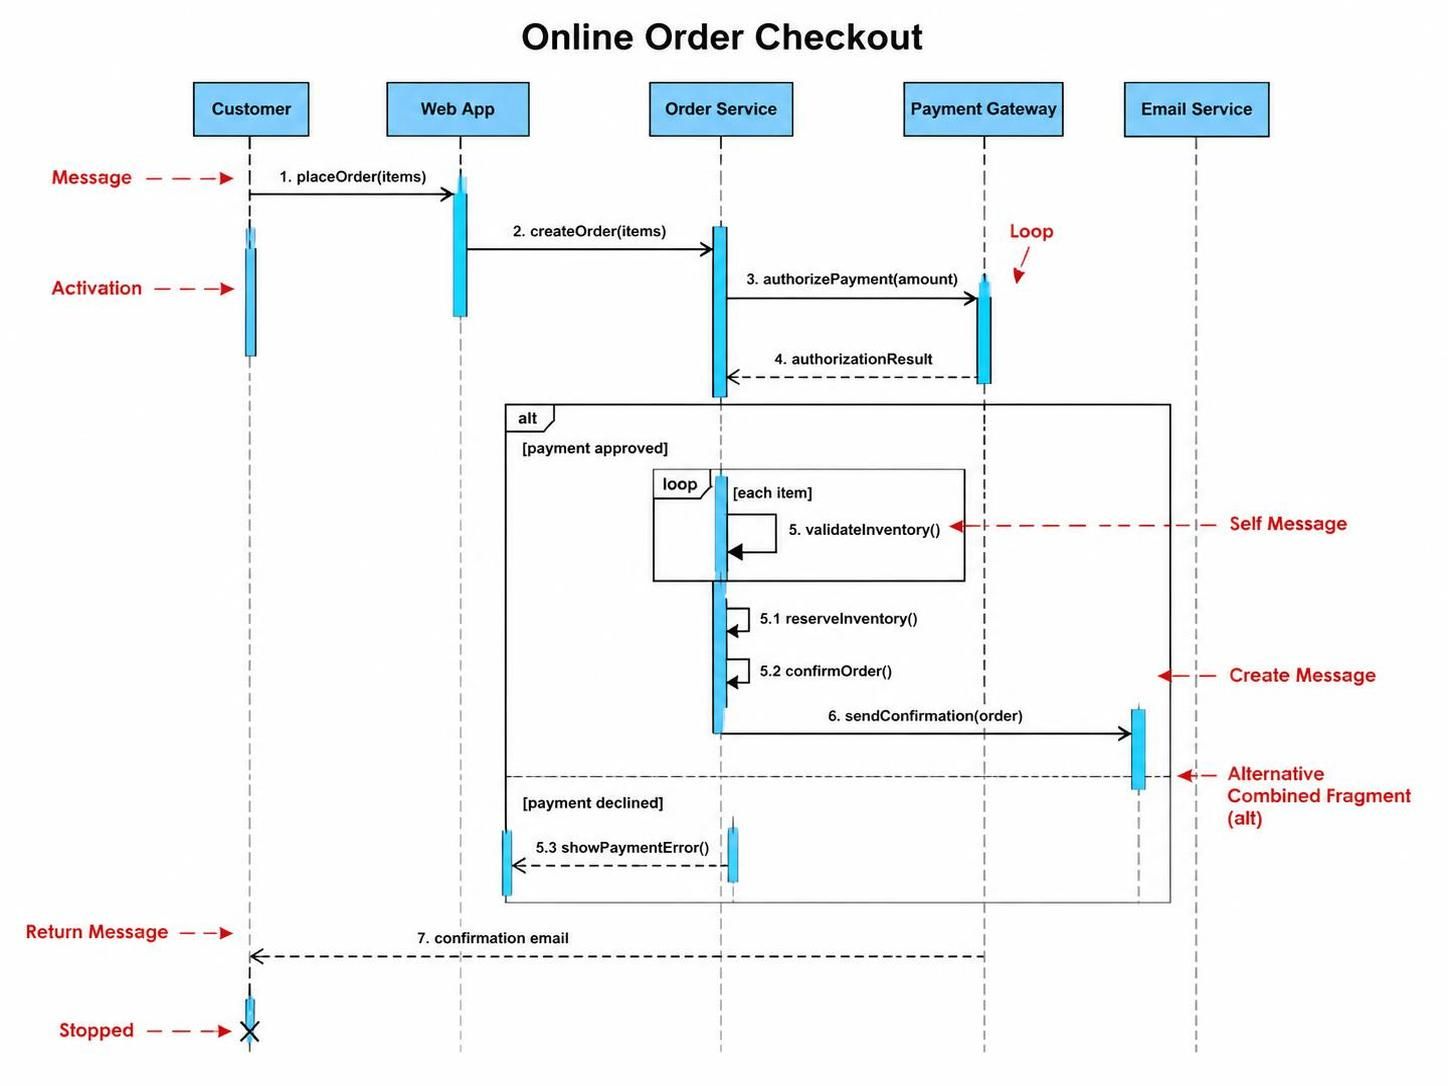
A sequence diagram shows how objects or components communicate in a time-ordered sequence.
Example: placing an order
Customer -> WebApp: Submit order
WebApp -> OrderService: createOrder()
OrderService -> PaymentService: authorizePayment()
PaymentService --> OrderService: paymentApproved
OrderService -> NotificationService: sendConfirmation()
OrderService --> WebApp: orderCreated
WebApp --> Customer: Display confirmation
Sequence diagrams contain:
-
Participants
-
Lifelines
-
Messages
-
Activation bars
-
Return messages
-
Conditions
-
Loops
-
Alternatives
-
Parallel interactions
They are especially useful for explaining API calls, service interactions, authentication flows, and error handling.
4. Communication Diagram
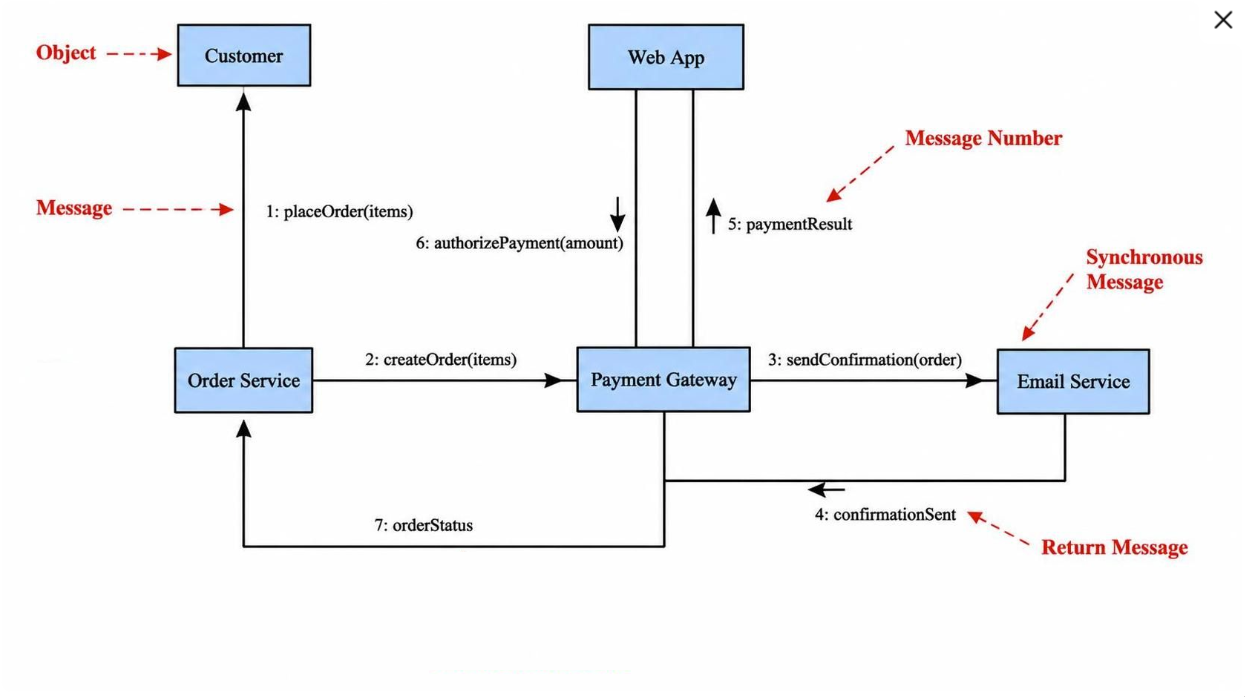
A communication diagram, historically called a collaboration diagram in earlier UML versions, emphasizes the relationships between objects and the messages exchanged between them.
Instead of focusing primarily on a vertical timeline like a sequence diagram, it focuses on:
-
Objects
-
Links between objects
-
Numbered messages
-
Collaboration structure
Example:
1: submitOrder()
Customer ----------------> WebApp

2: createOrder()
WebApp ------------------> OrderService

3: authorizePayment()
OrderService -------------> PaymentService
Communication diagrams are useful when the structure of object collaboration is more important than the exact visual timeline.
5. State Machine Diagram
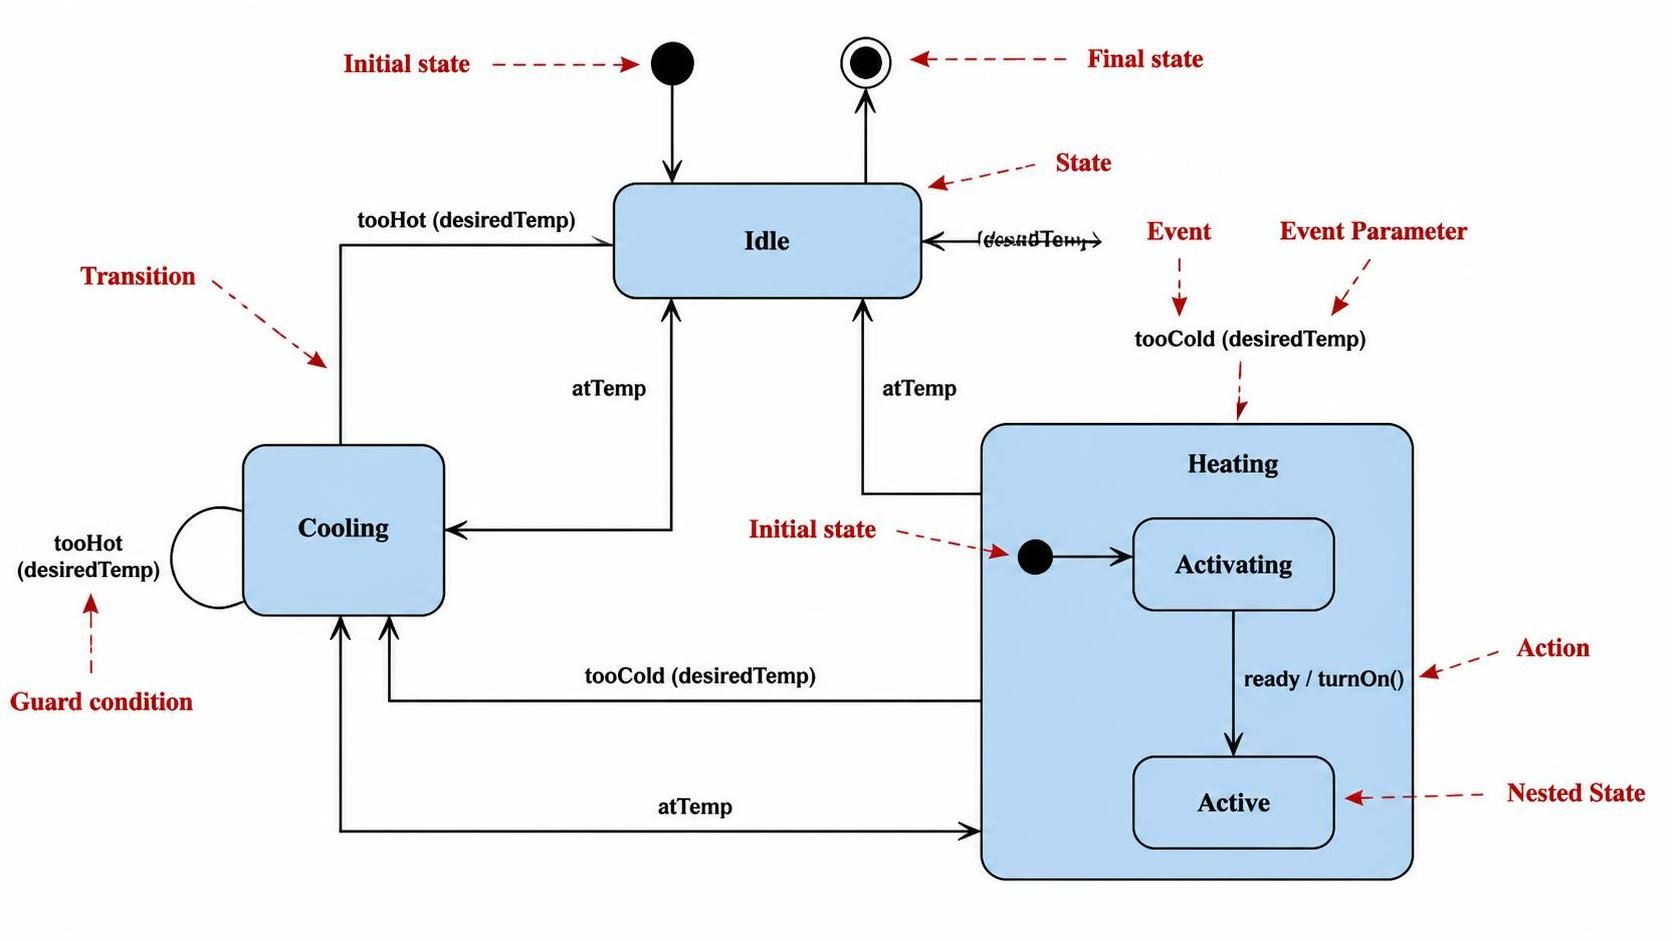
A state machine diagram shows how an object or system changes state in response to events.
An order may move through the following states:
New -> Pending Payment -> Paid -> Shipped -> Delivered
                  |
                  v
              Cancelled
A transition can be labeled with an event or condition:
Pending Payment -- paymentApproved --> Paid
Pending Payment -- paymentFailed --> Payment Failed
State machine diagrams are useful for:
-
Order lifecycles
-
User account states
-
Workflow status
-
Device behavior
-
Network connection states
-
Approval processes
They are particularly valuable when the behavior of an object depends heavily on its current state.
6. Timing Diagram
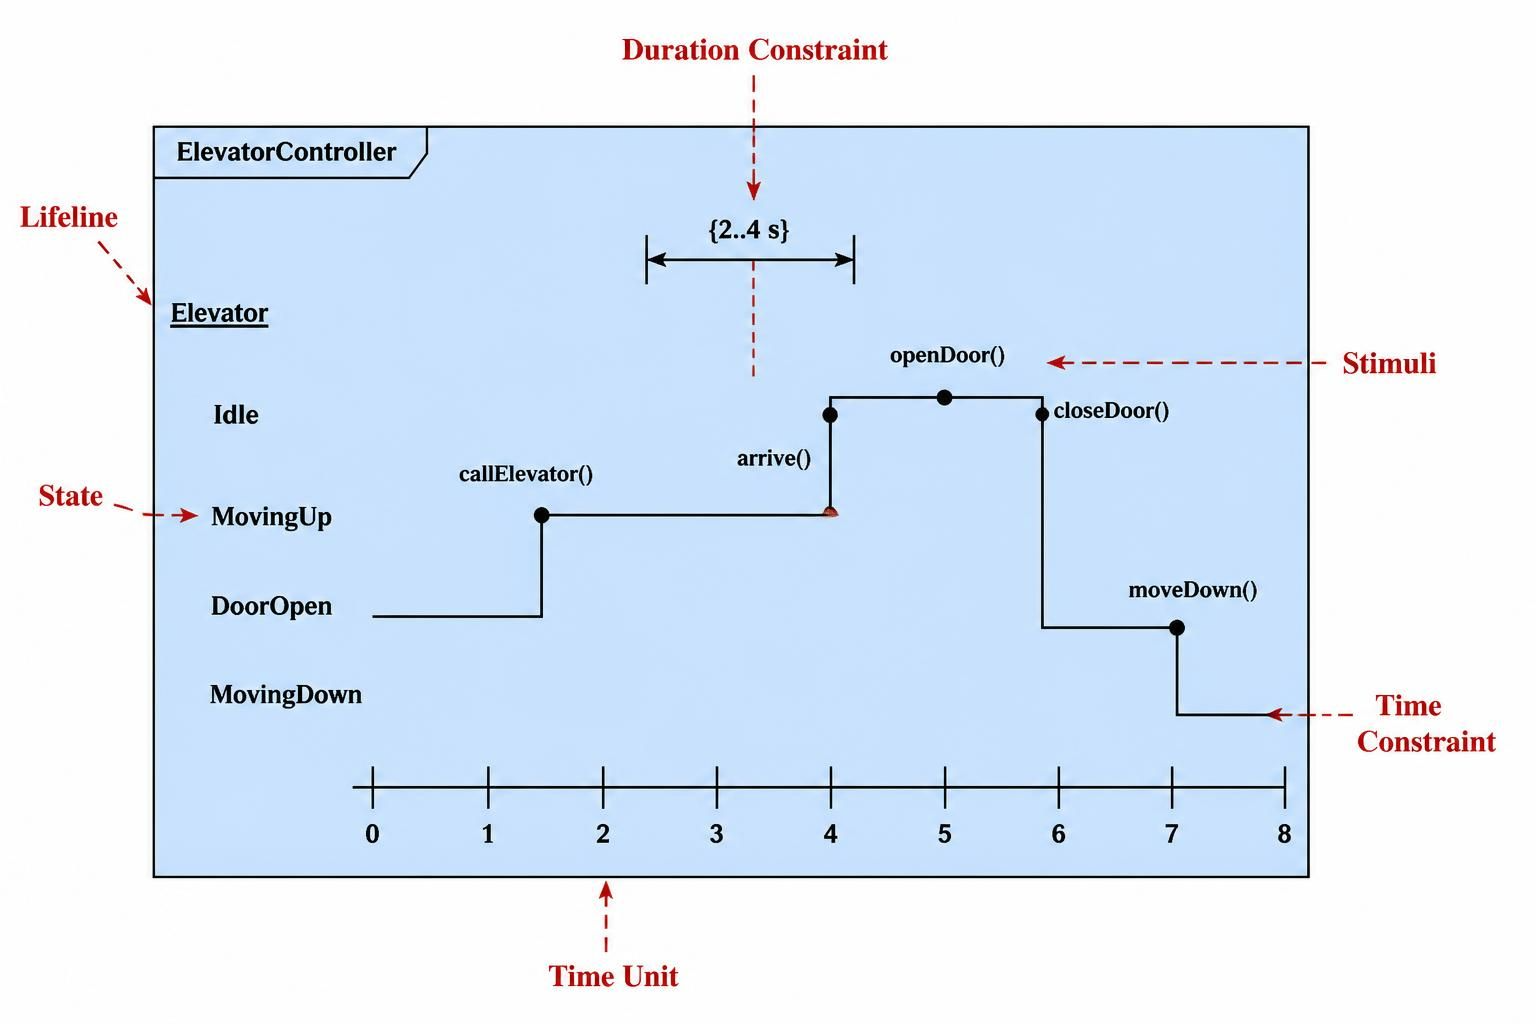
A timing diagram illustrates how the state or value of one or more elements changes over time.
It is often used for:
-
Real-time systems
-
Embedded systems
-
Communication protocols
-
Hardware and software coordination
-
Performance-sensitive interactions
For example, a timing diagram can show the relationship between:
-
A device signal
-
A controller state
-
A sensor value
-
A response over a defined time interval
7. Interaction Overview Diagram
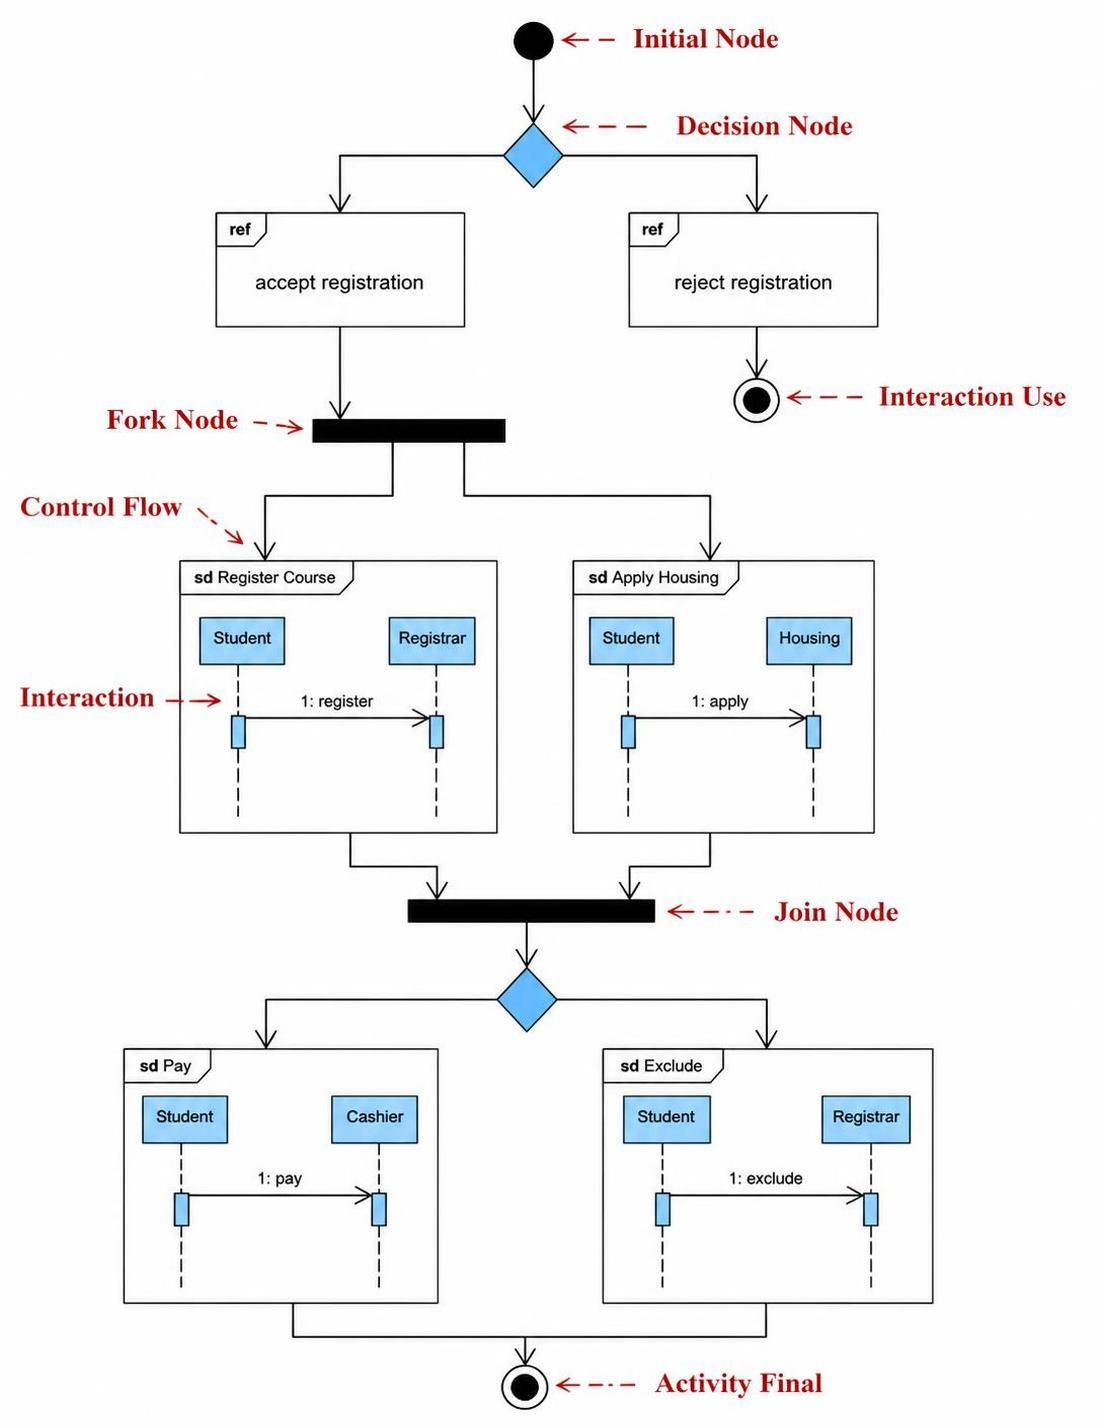
An interaction overview diagram provides a high-level view of interactions by combining activity-style control flow with interaction diagrams.
It can show:
-
The order of major interactions
-
Decisions between interaction fragments
-
Parallel interaction paths
-
References to sequence or communication diagrams
For example, an interaction overview for an online order could connect:
-
Customer authentication
-
Product selection
-
Checkout interaction
-
Payment authorization
-
Order fulfillment
This diagram is useful when a process is too complex to explain with one sequence diagram.
UML Relationships
Understanding UML relationships is essential for creating meaningful diagrams.
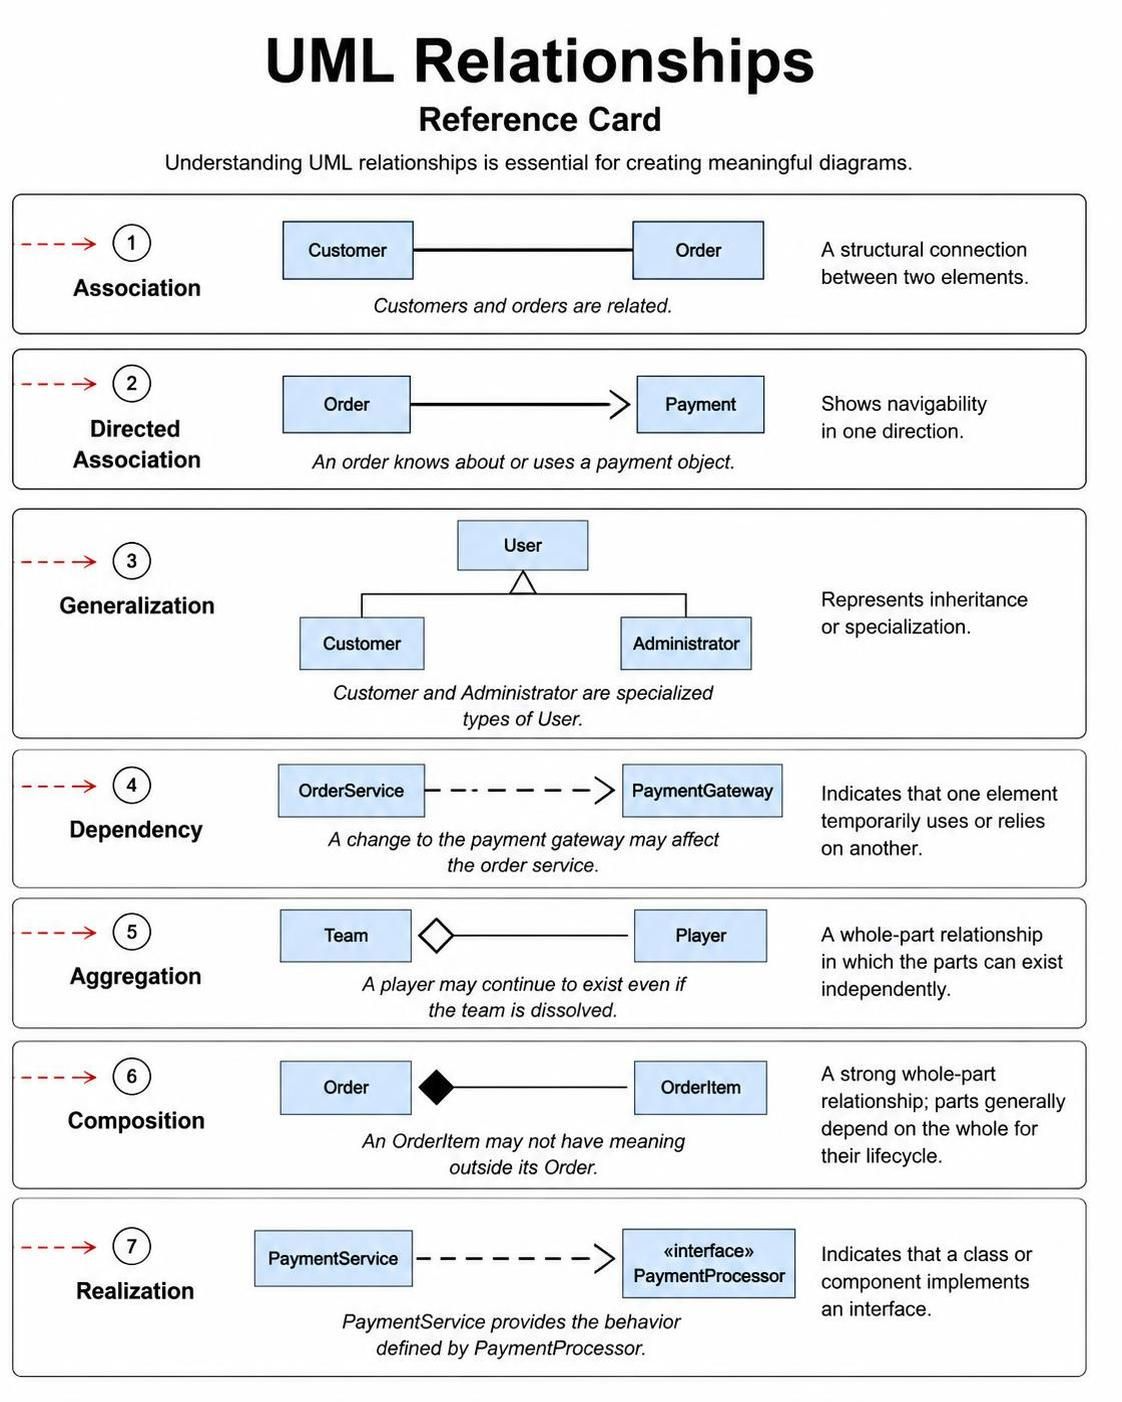
Association
An association represents a structural connection between two elements.
Customer -------- Order
This indicates that customers and orders are related.
Directed Association
A directed association shows navigability in one direction.
Order ------> Payment
This suggests that an order knows about or uses a payment object, while the reverse may not be true.
Generalization
Generalization represents inheritance or specialization.
       User
      /    \
Customer  Administrator
Here, Customer and Administrator are specialized types of User.
Dependency
A dependency indicates that one element temporarily uses or relies on another.
OrderService - - - -> PaymentGateway
A change to the payment gateway may affect the order service.
Aggregation
Aggregation represents a whole-part relationship in which the parts can exist independently.
Team ◇------ Player
A player may continue to exist even if the team is dissolved.
Composition
Composition represents a strong whole-part relationship. The parts generally depend on the whole for their lifecycle.
Order ◆------ OrderItem
An OrderItem may be considered part of an order and may not have meaning outside that order.
Realization
Realization indicates that a class or component implements an interface.
PaymentService - - -|> PaymentProcessor
The PaymentService provides the behavior defined by the PaymentProcessor interface.
UML Example: Online Shopping System
Consider an online shopping application.
Main actors
-
Customer
-
Administrator
-
Payment Gateway
-
Delivery Service
Main use cases
-
Create Account
-
Browse Products
-
Add Items to Cart
-
Place Order
-
Make Payment
-
Track Delivery
-
Manage Inventory
Possible classes
Customer
Product
ShoppingCart
CartItem
Order
OrderItem
Payment
Shipment
Possible service components
User Service
Catalog Service
Cart Service
Order Service
Payment Service
Shipping Service
Notification Service
Example interaction
When a customer places an order:
-
The customer submits the cart.
-
The web application sends the request to the order service.
-
The order service validates the items.
-
The payment service authorizes payment.
-
The order is saved.
-
The shipping service is notified.
-
The notification service sends a confirmation email.
This single business process may be represented through several UML diagrams:
-
Use case diagram: Shows that the customer can place an order.
-
Activity diagram: Shows the workflow and decision points.
-
Sequence diagram: Shows messages between services.
-
Class diagram: Shows
Customer,Order,Product, and related classes. -
Component diagram: Shows the services involved.
-
Deployment diagram: Shows where those services run.
How to Choose the Right UML Diagram
| Modeling goal | Recommended UML diagram |
|---|---|
| Show classes and their relationships | Class diagram |
| Show real object instances | Object diagram |
| Describe system functionality | Use case diagram |
| Model a business or system workflow | Activity diagram |
| Show messages exchanged over time | Sequence diagram |
| Show object collaboration | Communication diagram |
| Show lifecycle and state changes | State machine diagram |
| Show software modules or services | Component diagram |
| Show physical deployment | Deployment diagram |
| Organize model elements | Package diagram |
| Show internal parts of a classifier | Composite structure diagram |
| Show changes over time | Timing diagram |
| Summarize several interactions | Interaction overview diagram |
| Extend UML for a specialized domain | Profile diagram |
A good modeling practice is to select only the diagrams that answer a specific question. Creating every possible UML diagram can make documentation unnecessarily complex.
UML and the Software Development Lifecycle
UML can support many phases of software development.
Requirements analysis
Use case diagrams help identify actors and system functionality. Activity diagrams can clarify business processes and workflows.
System analysis
Class diagrams can represent domain concepts. Sequence diagrams can help analysts understand how use cases are fulfilled.
Architectural design
Component, package, and deployment diagrams help define the structure of the application and its infrastructure.
Detailed design
Class diagrams, sequence diagrams, state machine diagrams, and composite structure diagrams can describe implementation responsibilities and object interactions.
Development
Developers can use models as a reference while implementing classes, services, APIs, and database structures.
Testing
Testers can derive scenarios from use cases, activity diagrams, and sequence diagrams. State machine diagrams can help identify valid and invalid state transitions.
Maintenance
UML diagrams provide documentation for existing systems and help teams assess the impact of proposed changes.
Creating UML Diagrams with Visual Paradigm
Visual Paradigm is a visual modeling and software design platform that supports UML diagram creation along with other modeling and development activities. Its UML capabilities include diagrams such as class, sequence, use case, activity, component, deployment, state machine, package, object, and composite structure diagrams.
Starting a UML project
A practical workflow in Visual Paradigm is:
-
Create a new project.
-
Organize the model into packages such as
Requirements,Domain Model,Services, andDeployment. -
Create a use case diagram to capture system functionality.
-
Add an activity or sequence diagram for important workflows.
-
Create a class diagram for the domain model.
-
Add component and deployment diagrams for architecture.
-
Review the diagrams with stakeholders.
-
Update the model as the system evolves.
-
Export diagrams or generate documentation when needed.
Creating a class diagram
To create a class diagram:
-
Create a new class diagram.
-
Add the main domain classes.
-
Add attributes and operations.
-
Connect classes using appropriate relationships.
-
Add multiplicities.
-
Indicate inheritance and interfaces where required.
-
Arrange the diagram so that related classes are easy to follow.
-
Validate the model against the requirements.
For example, a class diagram for an online store may contain Customer, Order, Product, Payment, and Shipment.
Creating a use case diagram
A use case diagram can be created by:
-
Identifying external actors.
-
Listing the system’s major functions.
-
Adding a system boundary.
-
Placing use cases inside the boundary.
-
Connecting actors to the use cases they participate in.
-
Adding include or extend relationships only when they clarify reuse or optional behavior.
Creating a sequence diagram
When creating a sequence diagram:
-
Identify the scenario being modeled.
-
Add the actor or initiating component.
-
Add the participating objects or services.
-
Arrange them from left to right.
-
Add messages in chronological order.
-
Model alternatives, loops, and error conditions.
-
Check that every message corresponds to a realistic responsibility.
Collaboration and documentation
Visual Paradigm provides visual modeling capabilities, team collaboration features, documentation support, and integrations intended to connect modeling with broader software development activities. Its platform also supports collaborative diagram review and commenting.
Some editions and workflows may also provide features such as code engineering, database modeling, model organization, diagram export, and documentation generation. These capabilities should be selected according to the project’s needs rather than added automatically to every model.
Best Practices for Effective UML Modeling
Model with a purpose
Every diagram should answer a clear question. For example:
-
How does a customer place an order?
-
Which services depend on the payment service?
-
What states can an order enter?
-
Which classes belong to the order domain?
Keep diagrams focused
Avoid placing the entire system on one diagram. Divide large models into smaller views for requirements, domain structure, behavior, architecture, and deployment.
Use consistent names
Use the same names across diagrams. If one diagram calls a component OrderService, another should not call it OrderManager unless they are genuinely different elements.
Choose the right level of detail
A stakeholder-facing diagram should normally contain less technical detail than an implementation diagram. Do not add method signatures, database fields, or framework-specific details unless they are relevant to the audience.
Avoid unnecessary relationships
Adding every possible dependency can make a diagram difficult to read. Include relationships that communicate meaningful design information.
Show multiplicity where it matters
Multiplicity helps clarify business rules and data relationships. For example, showing that an order contains one or more order items is more informative than simply connecting the two classes.
Validate diagrams against requirements
A model is useful only when it accurately represents the system. Compare diagrams with requirements, test scenarios, source code, and stakeholder feedback.
Use diagrams as living documentation
Update UML diagrams when major design decisions change. Outdated diagrams can be more confusing than having no diagrams at all.
Combine complementary diagrams
No single UML diagram explains every aspect of a system. A class diagram may show structure, while a sequence diagram explains how that structure behaves during a specific scenario.
Common Mistakes to Avoid
-
Treating UML as source code
-
Creating diagrams without a specific purpose
-
Mixing conceptual and implementation details without explanation
-
Using inheritance where composition would be more appropriate
-
Omitting multiplicities from important relationships
-
Adding too many elements to one diagram
-
Using incorrect include and extend relationships
-
Failing to model error and alternative flows
-
Allowing different diagrams to use inconsistent names
-
Assuming that a diagram is correct merely because it looks visually organized
UML 2.x and Diagram Count
Early UML versions commonly described fewer diagram types. UML 2.x expanded the language and introduced or formalized additional diagrams, including:
-
Composite structure diagram
-
Communication diagram
-
Interaction overview diagram
-
Timing diagram
It also renamed statechart diagrams as state machine diagrams. A common UML 2.x classification contains 14 diagrams: seven structural diagrams and seven behavioral diagrams. The behavioral group includes use case, activity, state machine, sequence, communication, interaction overview, and timing diagrams. The structural group includes class, object, component, composite structure, deployment, package, and profile diagrams.
Therefore, lists that describe UML 2.x as having only 13 diagrams are incomplete under the commonly used 14-diagram classification.
Conclusion
UML provides a practical visual language for understanding, designing, and documenting software systems. It helps teams communicate requirements, explore architecture, model object relationships, describe workflows, and explain runtime behavior.
The most frequently used diagrams are usually:
-
Use case diagrams for functional requirements
-
Class diagrams for static structure
-
Activity diagrams for workflows
-
Sequence diagrams for interactions
-
Component diagrams for architecture
-
Deployment diagrams for infrastructure
-
State machine diagrams for lifecycle behavior
Visual Paradigm can support this modeling process by providing tools for creating UML diagrams, organizing models, collaborating with team members, and producing technical documentation. The most effective approach is not to use every UML diagram indiscriminately, but to select the diagrams that clarify important design questions.
When used consistently and kept aligned with the actual system, UML becomes more than a collection of symbols: it becomes a shared design language that connects business requirements, software architecture, implementation, testing, and long-term maintenance.