
1. Introduction
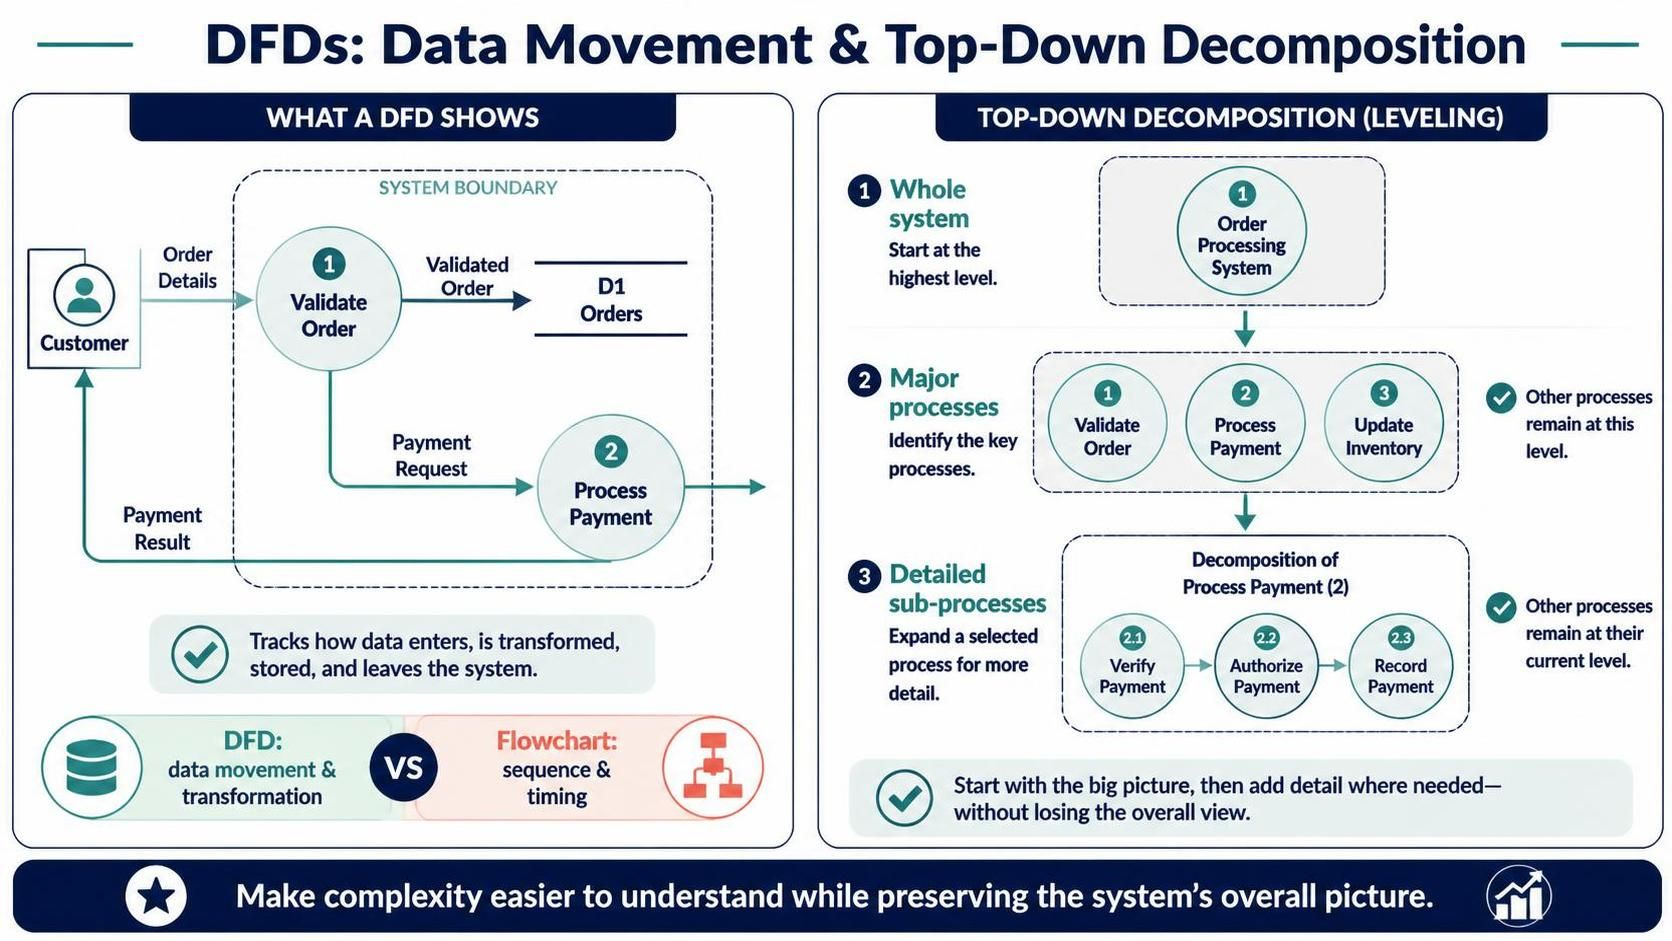
A Data Flow Diagram (DFD) represents how data enters a system, is transformed by processes, is stored, and leaves the system. Unlike a flowchart, a DFD focuses on data movement and transformation, not the sequence or timing of actions.
Top-down decomposition—also called leveling—starts with a high-level view of the whole system, then breaks selected processes into progressively more detailed sub-processes. The goal is to make a complex system easier to understand without losing the overall picture.
This case study applies the technique to an online bookstore order-processing system.
2. Key DFD concepts
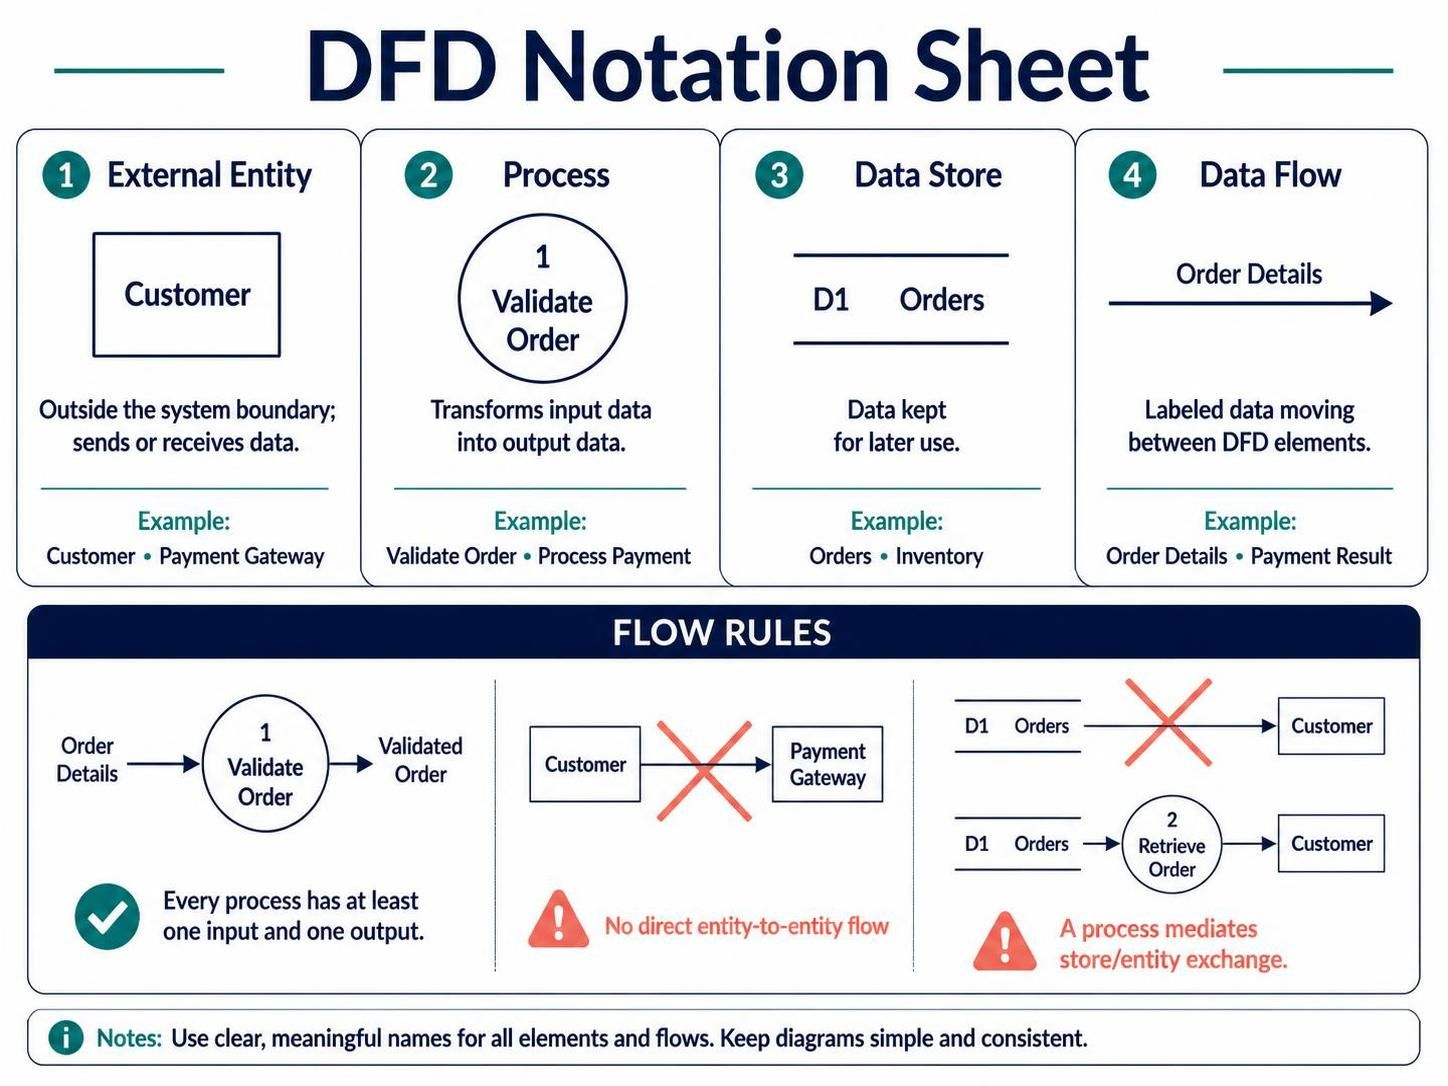
A DFD uses four basic elements:
-
External entity: A person, organization, or system outside the boundary that sends or receives data. Examples: Customer, Payment Gateway.
-
Process: A function that transforms input data into output data. Examples: Validate Order, Process Payment.
-
Data store: Data kept for later use. Examples: Orders, Inventory.
-
Data flow: Labeled data moving between entities, processes, or stores. Examples: Order Details, Payment Result.
A process should transform data, so it needs at least one input and one output. Data should not flow directly between two external entities or directly between a data store and an external entity; a process mediates that exchange.
Levels and decomposition
-
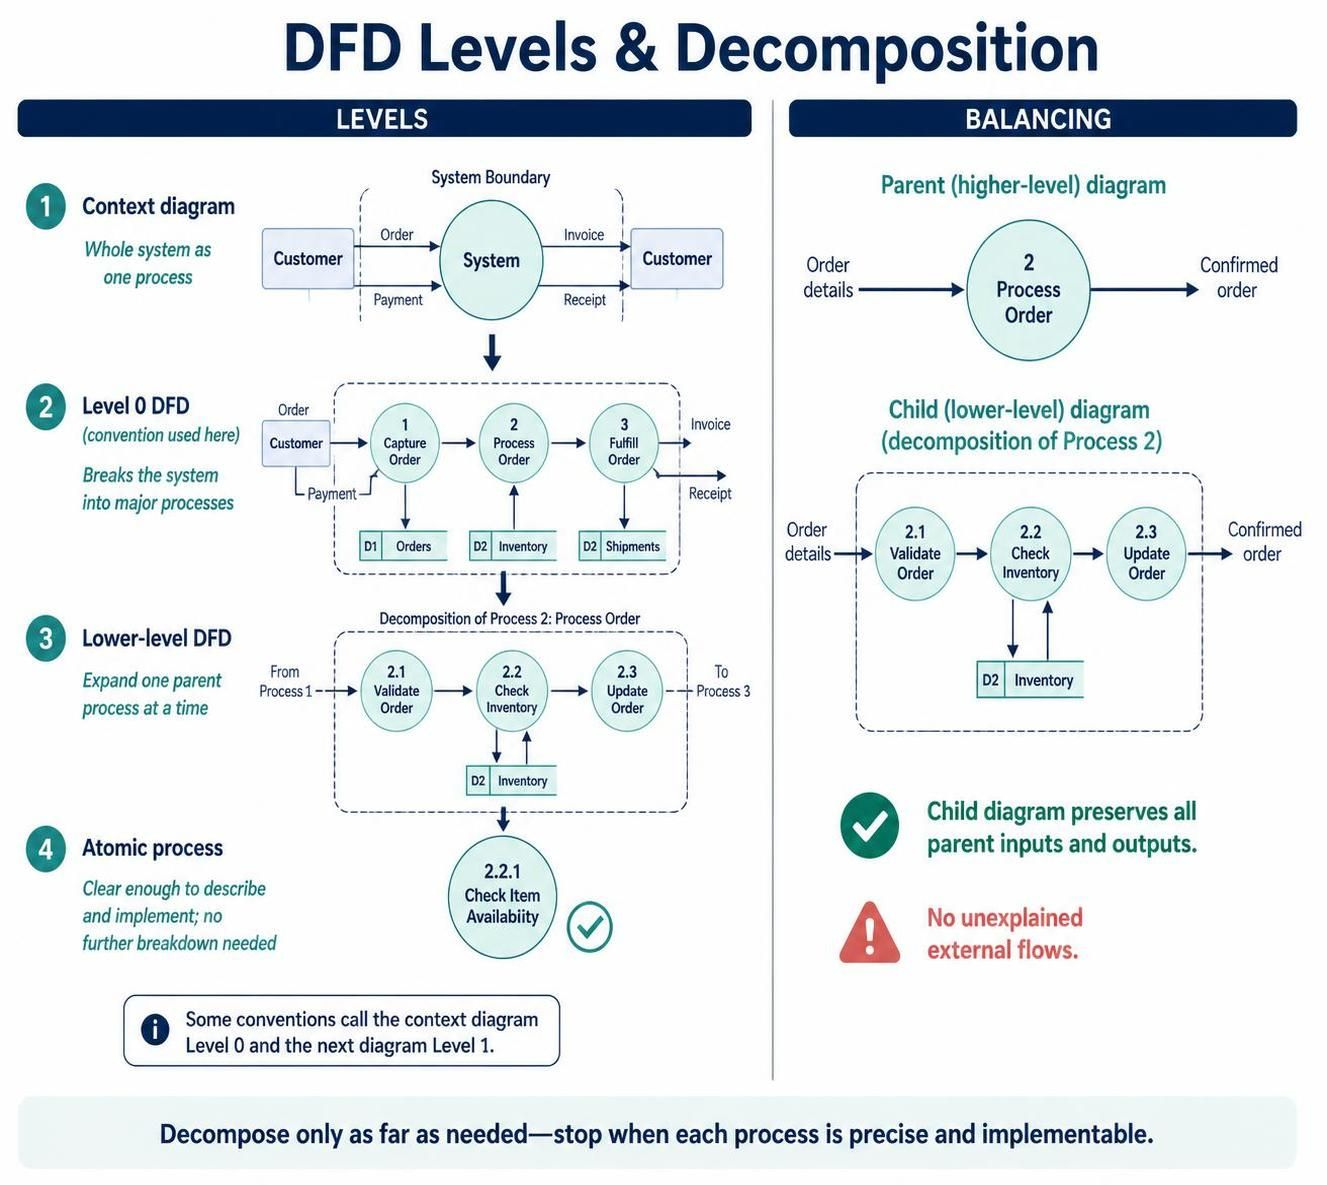
Context diagram: Shows the entire system as one process, its boundary, external entities, and the major data flows.
-
Level 0 DFD: In many conventions, this is the first breakdown into major processes. Some sources call the context diagram “Level 0” and the next diagram “Level 1,” so state the numbering convention being used.
-
Lower-level DFDs: Expand one parent process into smaller sub-processes, such as process 2 becoming 2.1, 2.2, and 2.3.
-
Atomic process: A process that is sufficiently simple to describe precisely without further decomposition.
The exact number of levels depends on the system’s complexity. Stop when the processes are clear enough to describe and implement, rather than decomposing every process indefinitely.
Balancing
A lower-level diagram must preserve the inputs and outputs of the process it expands. This is called balancing: the data crossing the parent process boundary must still cross the boundary of its child diagram. The lower-level diagram may show how data is transformed internally, but it should not introduce unexplained external inputs or outputs.
3. Case study: Online bookstore order processing
Business situation
An online bookstore needs a system for accepting customer orders. The system checks order information and stock, calculates the order total, requests payment authorization, records accepted orders, updates stock, and sends the customer a confirmation or rejection.
Scope and assumptions
The DFD covers order processing from order submission through customer notification. It treats the payment gateway as an external system. Shipping, refunds, returns, and the bookstore’s broader catalog-management functions are outside this case study.
External entities
-
Customer: Submits order details and receives a confirmation or rejection.
-
Payment Gateway: Receives payment authorization requests and returns payment results.
Data stores
-
D1 Customer Records
-
D2 Product Inventory
-
D3 Orders
-
D4 Payments
4. Decomposition, level by level
Context diagram: Online Bookstore Order System
Represent the entire application as one process:
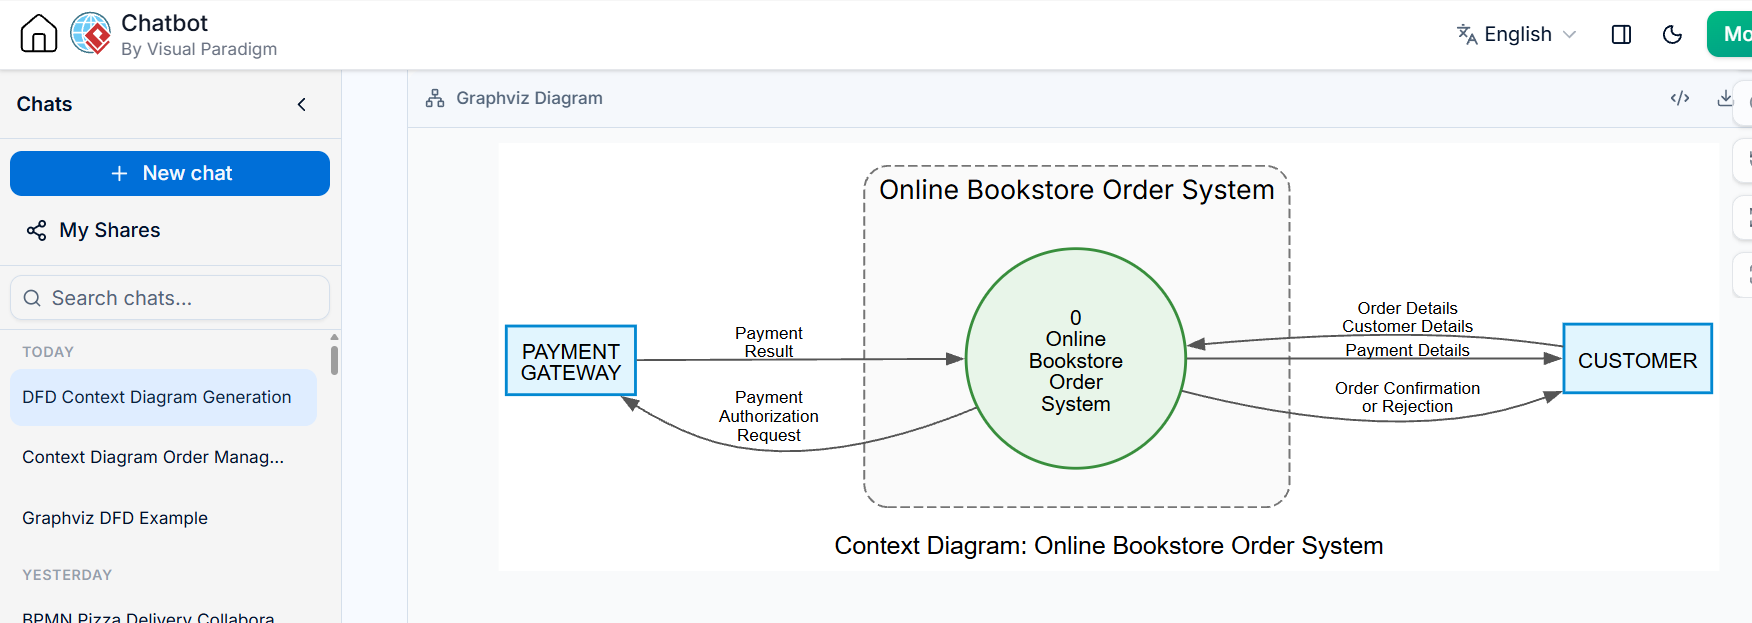
Process 0: Online Bookstore Order System
Data flows:
-
Customer → system: Order Details, Customer Details, Payment Details
-
System → Customer: Order Confirmation or Rejection
-
System → Payment Gateway: Payment Authorization Request
-
Payment Gateway → system: Payment Result
This view establishes the system’s boundary and its exchanges with the outside world. It deliberately does not show internal processes or stores.
Level 0: Major system processes
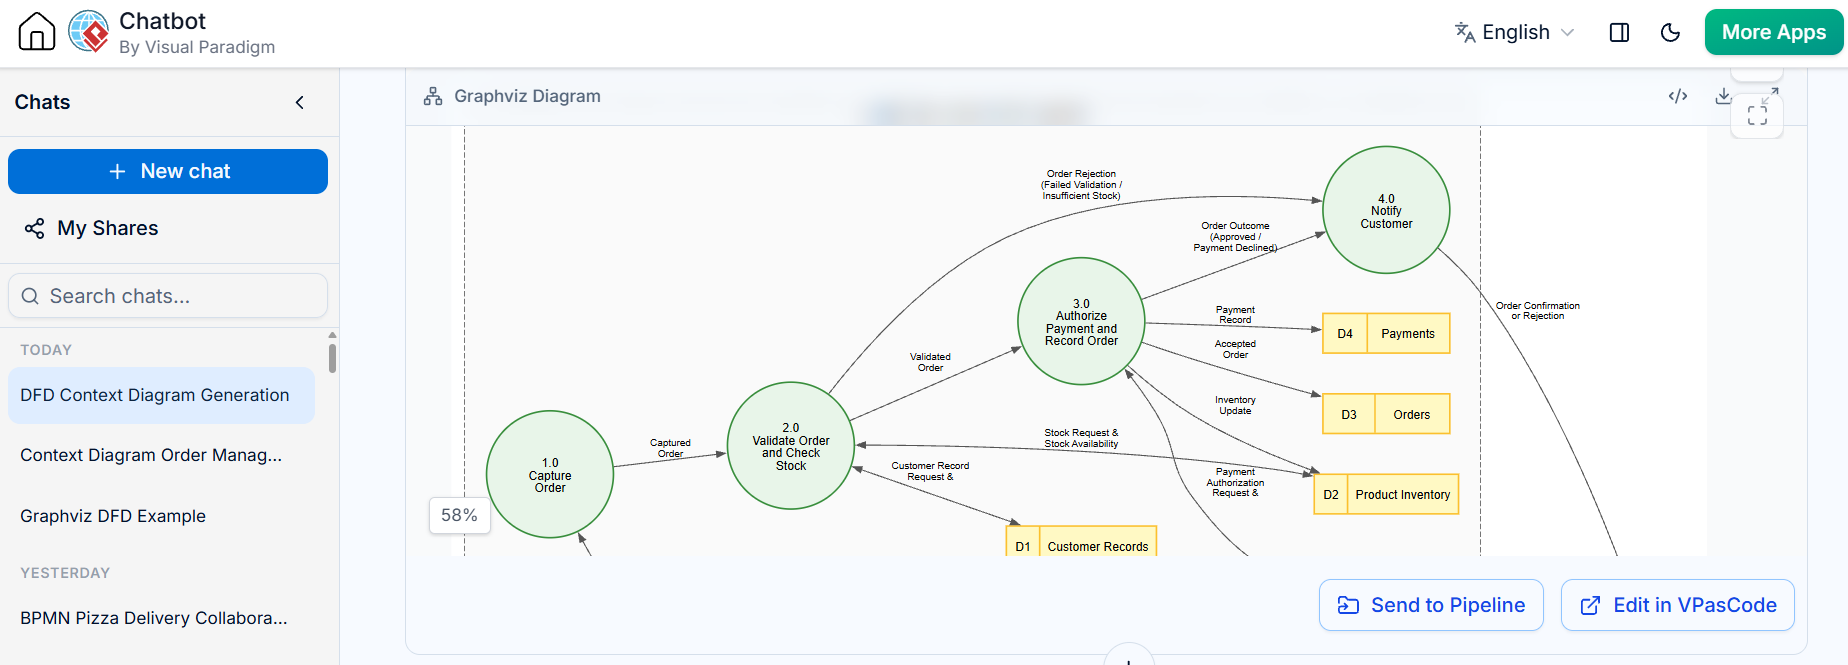
Decompose the system into four main processes:
-
1.0 Capture Order
-
2.0 Validate Order and Check Stock
-
3.0 Authorize Payment and Record Order
-
4.0 Notify Customer
Key flows and store interactions:
-
Customer → 1.0 Capture Order: Order Details, Customer Details, Payment Details
-
1.0 → 2.0 Validate Order and Check Stock: Captured Order
-
2.0 ↔ D1 Customer Records: Customer Record Request / Customer Record
-
2.0 ↔ D2 Product Inventory: Stock Request / Stock Availability
-
2.0 → 3.0 Authorize Payment and Record Order: Validated Order
-
3.0 ↔ Payment Gateway: Payment Authorization Request / Payment Result
-
3.0 → D4 Payments: Payment Record
-
3.0 → D3 Orders: Accepted Order
-
3.0 → D2 Product Inventory: Inventory Update
-
3.0 → 4.0 Notify Customer: Order Outcome
-
4.0 → Customer: Order Confirmation or Rejection
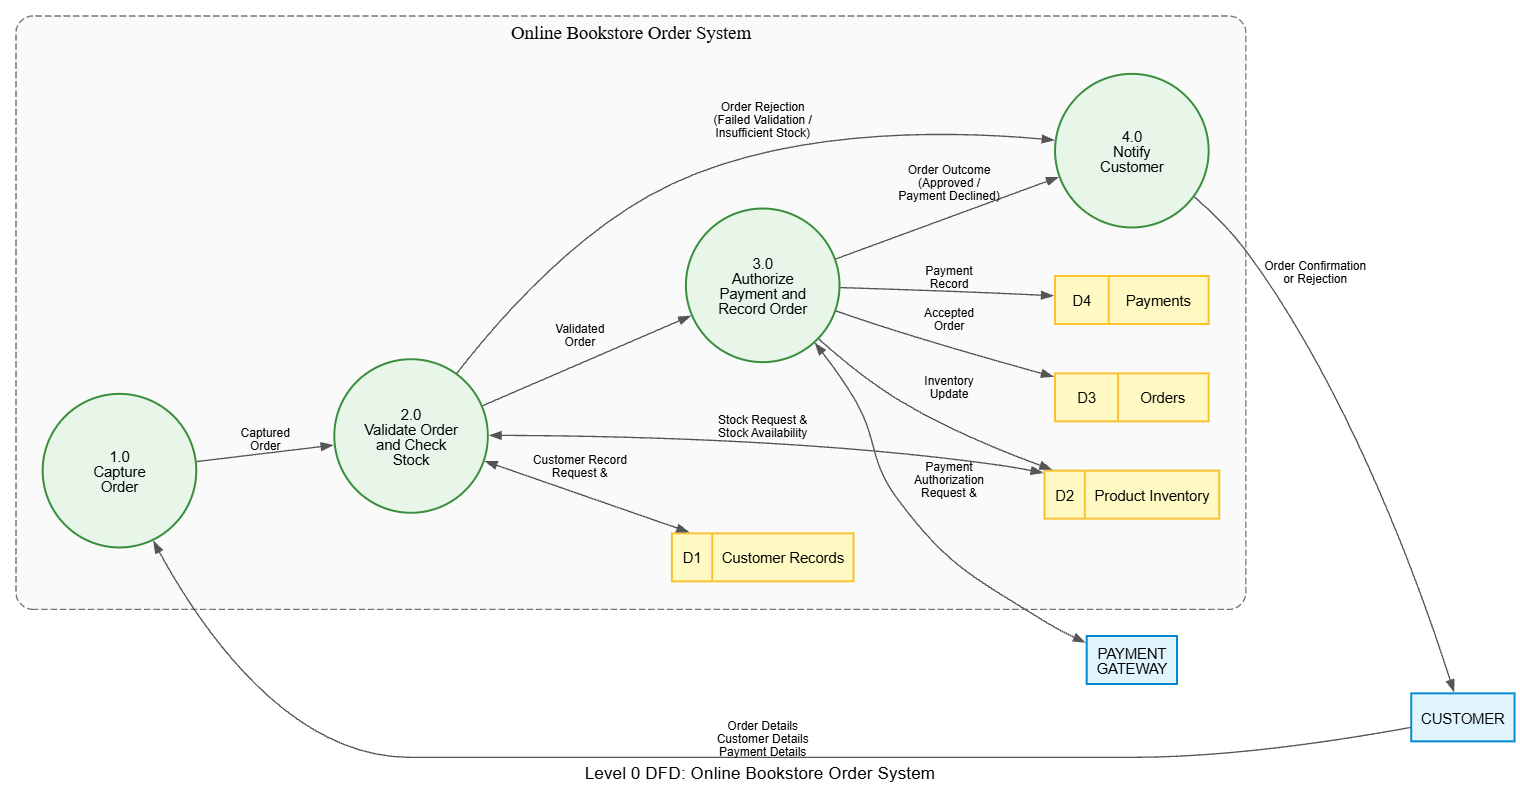
The diagram should also represent failed validation, insufficient stock, and declined payment as appropriate outcomes. For example, 2.0 can send an order rejection outcome to 4.0, while 3.0 can send a payment-declined outcome there.
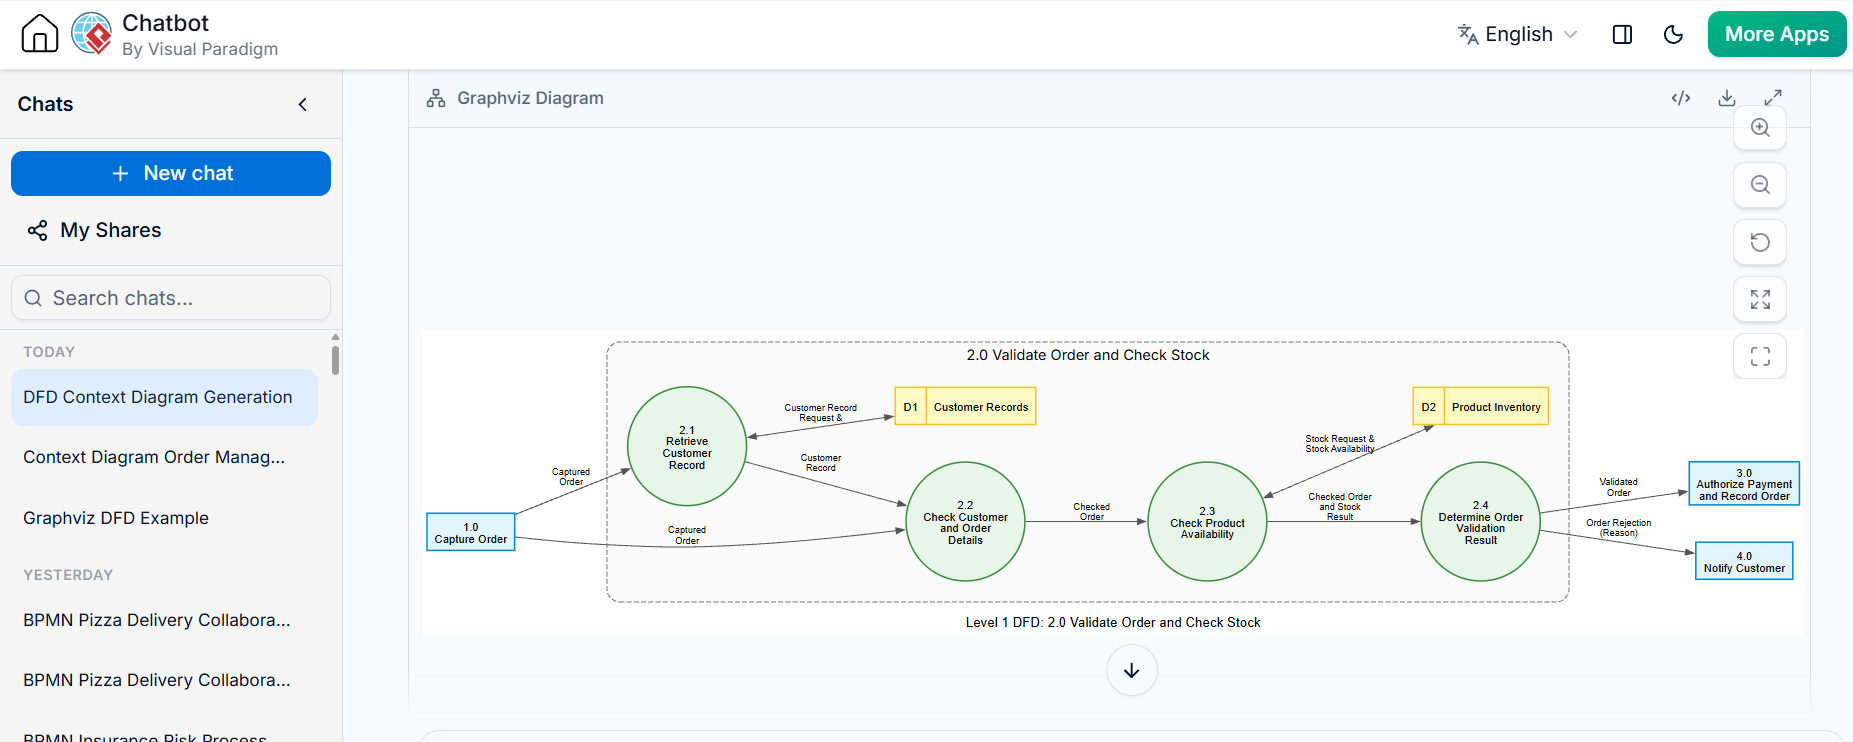
Level 1: Decompose process 2.0, “Validate Order and Check Stock”
The process receives a Captured Order and produces either a Validated Order or an Order Rejection.
Sub-processes:
-
2.1 Retrieve Customer Record — uses the customer identifier to retrieve customer data from D1.
-
2.2 Check Customer and Order Details — checks that the order includes the required customer and item information.
-
2.3 Check Product Availability — checks requested items against D2.
-
2.4 Determine Order Validation Result — produces either a Validated Order or an Order Rejection, including the reason.
Flows:
-
Captured Order → 2.1
-
2.1 ↔ D1 Customer Records: Customer Record Request / Customer Record
-
Customer Record and Captured Order → 2.2
-
2.2 → 2.3: Checked Order
-
2.3 ↔ D2 Product Inventory: Stock Request / Stock Availability
-
2.3 → 2.4: Checked Order and Stock Result
-
2.4 → next process: Validated Order or Order Rejection
Balancing check: The parent process, 2.0, receives a Captured Order and accesses customer and inventory information; it outputs a Validated Order or an Order Rejection. The sub-diagram must preserve those boundary flows. Its internal steps explain how the result is reached, rather than changing the parent’s purpose.
Level 1: Decompose process 3.0, “Authorize Payment and Record Order”
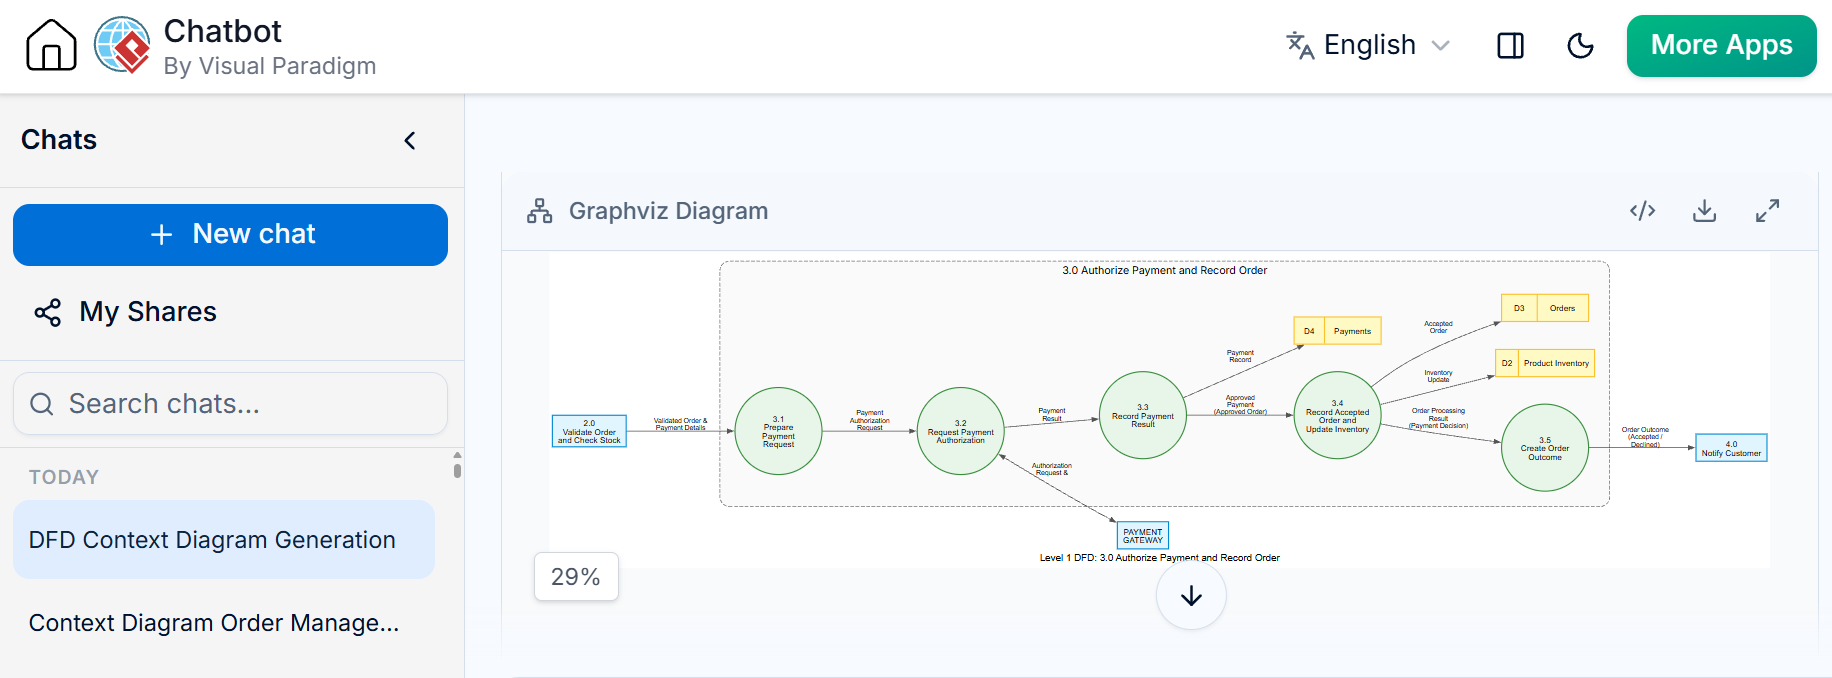
This process receives a Validated Order and returns an Order Outcome.
Sub-processes:
-
3.1 Prepare Payment Request — forms a payment request from the order and payment details.
-
3.2 Request Payment Authorization — sends the request to the Payment Gateway and receives its result.
-
3.3 Record Payment Result — stores the payment result in D4.
-
3.4 Record Accepted Order and Update Inventory — if payment is approved, records the order in D3 and updates D2; otherwise, records the failed payment outcome as required by the business rules.
-
3.5 Create Order Outcome — produces an accepted or declined outcome for the notification process.
Flows:
-
Validated Order and Payment Details → 3.1
-
3.1 → 3.2: Payment Authorization Request
-
3.2 ↔ Payment Gateway: Authorization Request / Payment Result
-
3.2 → 3.3: Payment Result
-
3.3 → D4 Payments: Payment Record
-
Approved payment → 3.4: Approved Order
-
3.4 → D3 Orders: Accepted Order
-
3.4 → D2 Product Inventory: Inventory Update
-
Payment decision → 3.5: Order Processing Result
-
3.5 → 4.0 Notify Customer: Order Outcome
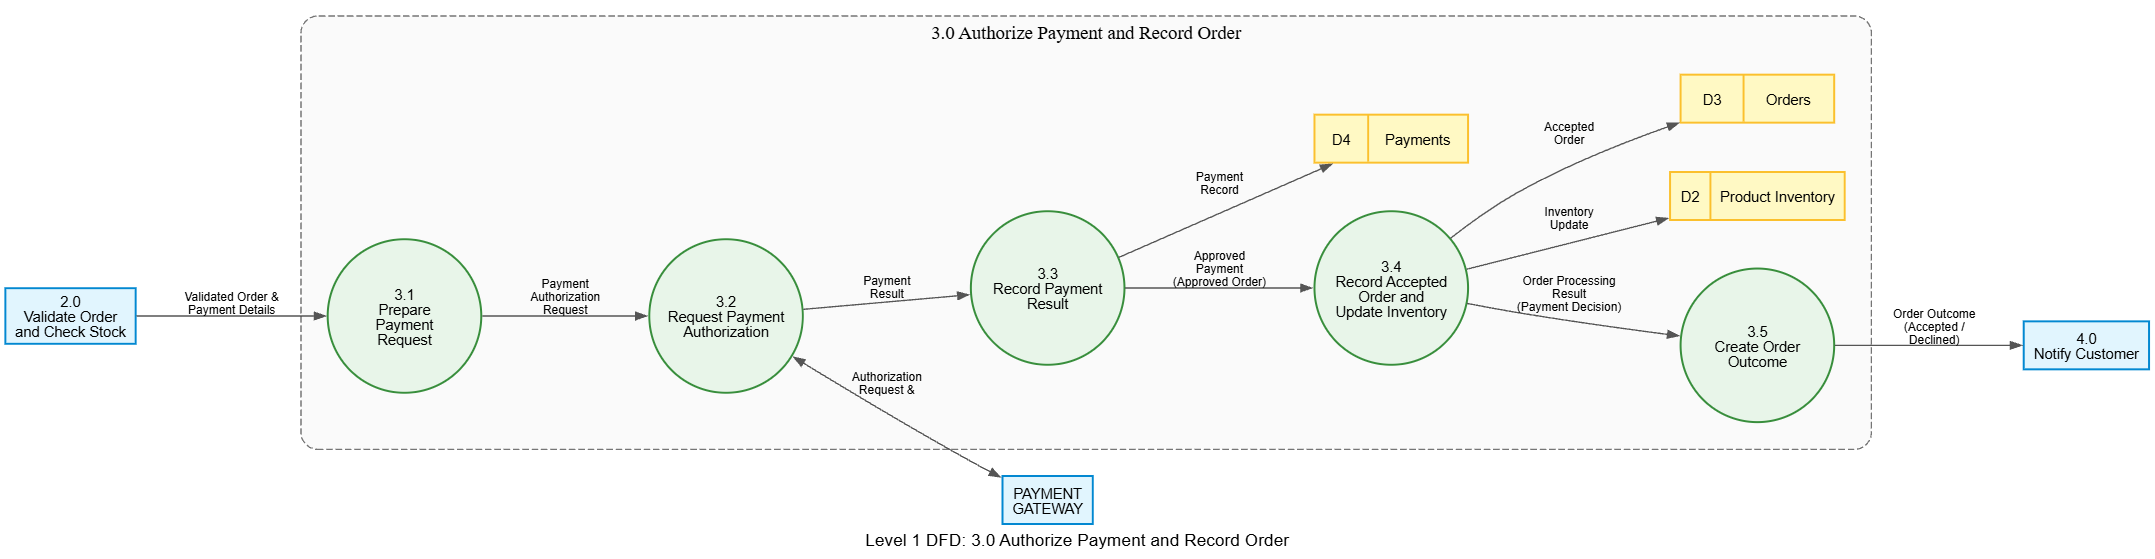
Balancing check: Process 3.0’s outside exchanges are the validated order, payment information, payment-gateway request and result, relevant store interactions, and order outcome. Its Level 1 diagram must account for those exchanges while clarifying the internal work.
5. What the case study shows
The context diagram communicates the system boundary. The Level 0 DFD identifies the system’s main responsibilities and data stores. The Level 1 diagrams explain the internal work of selected processes without forcing every process into the same level of detail.
This illustrates the main benefit of top-down decomposition: readers can begin with the system’s overall purpose and then follow the detail only where needed. Hierarchical diagrams are generally easier to understand than a single diagram containing every process and flow.
6. Practical steps for applying the technique
-
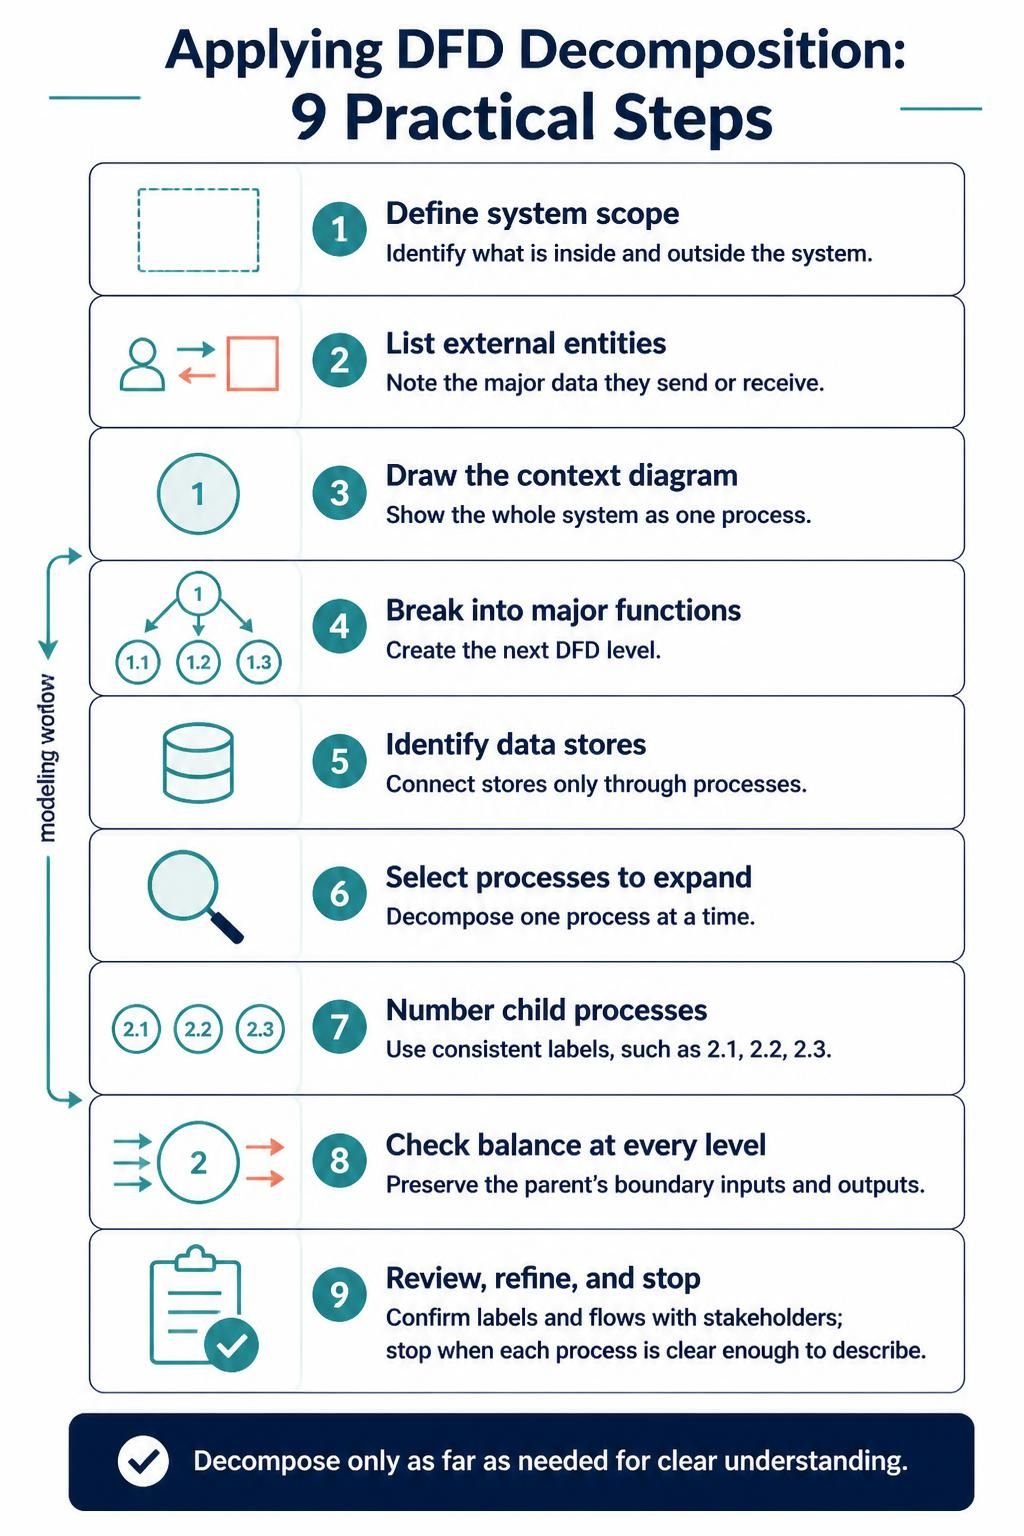
Define the system’s scope and identify what is external to it.
-
List external entities and the major data they send or receive.
-
Draw the context diagram using one process for the whole system.
-
Break that process into major functions for the next level.
-
Identify the data stores and connect them only through processes.
-
Choose processes that need more detail and decompose them one at a time.
-
Number child processes consistently, such as 2.1, 2.2, and 2.3.
-
Check balance at every level: preserve the parent’s boundary inputs and outputs.
-
Review labels and flows with stakeholders, then refine as needed.
-
Stop when each process can be understood and described clearly.
7. Common mistakes to avoid
-
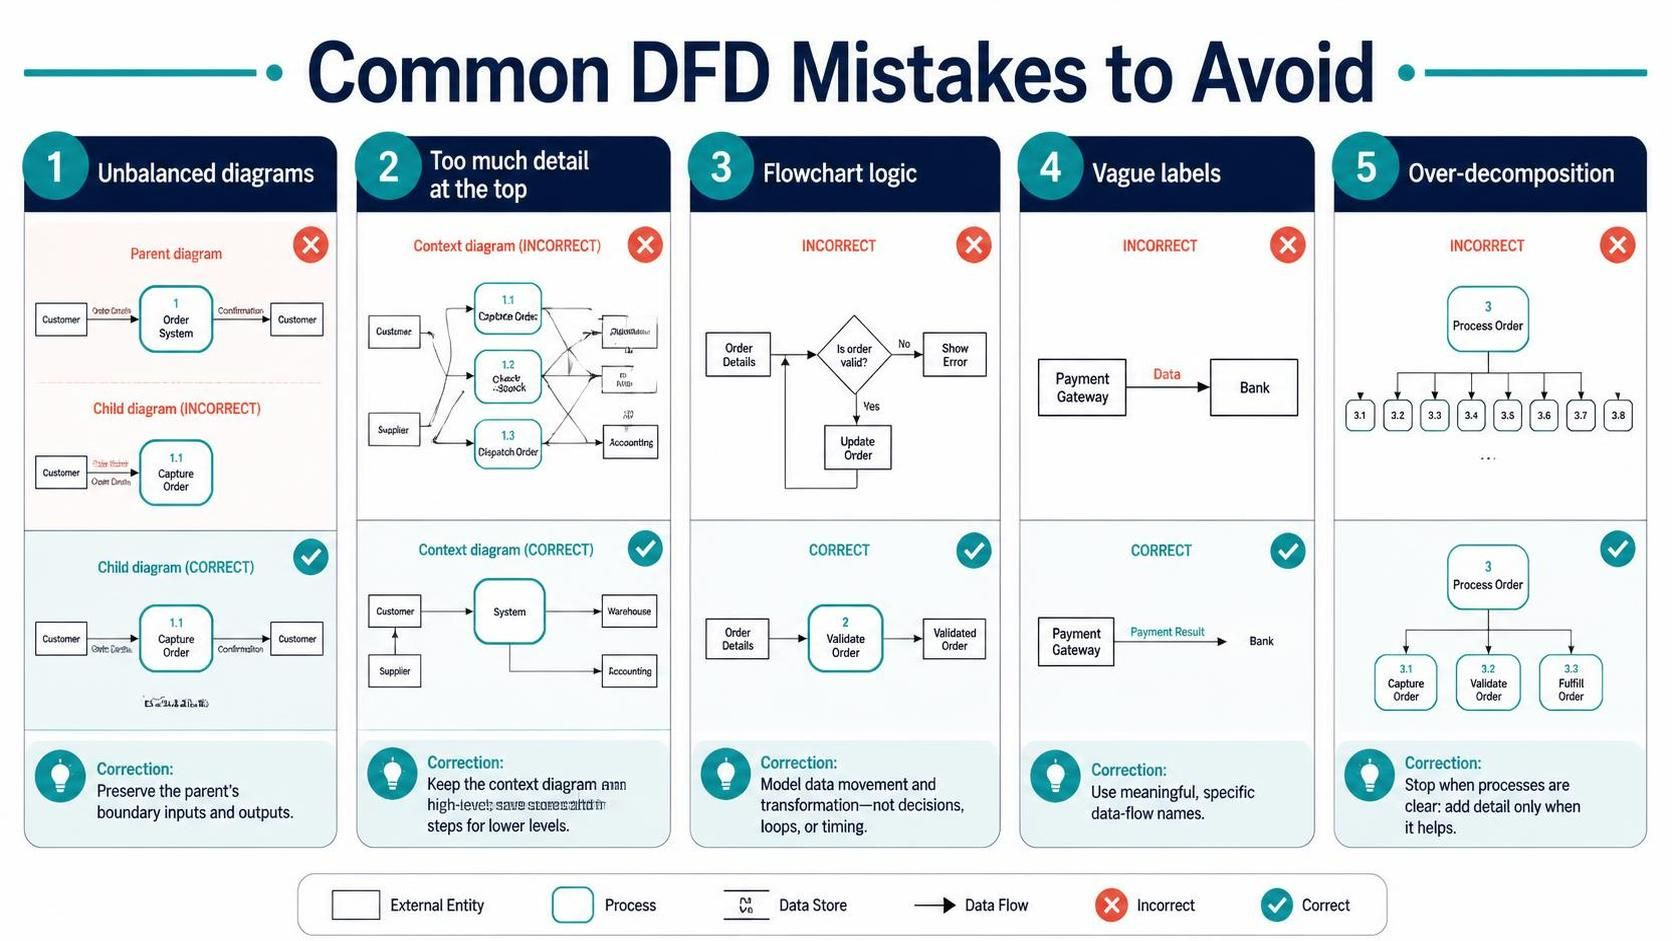
Unbalanced diagrams: A child diagram adds or omits boundary data without explanation.
-
Too much detail at the top: The context diagram becomes crowded with stores and internal steps.
-
Flowchart symbols or logic: DFDs describe data transformations, not decision diamonds, loops, or timing.
-
Vague labels: Use meaningful names such as “Payment Result” rather than “Data.”
-
Over-decomposition: Splitting processes into tiny steps can make the model harder to read without adding useful clarity.
Conclusion
Top-down decomposition is a structured way to move from a broad view of a system to focused descriptions of its internal processes. In this bookstore example, each level answers a different question: What does the system exchange with the outside world? What are its major functions? How does a particular function transform its data? Maintaining balance between levels keeps the diagrams consistent as detail is added.