


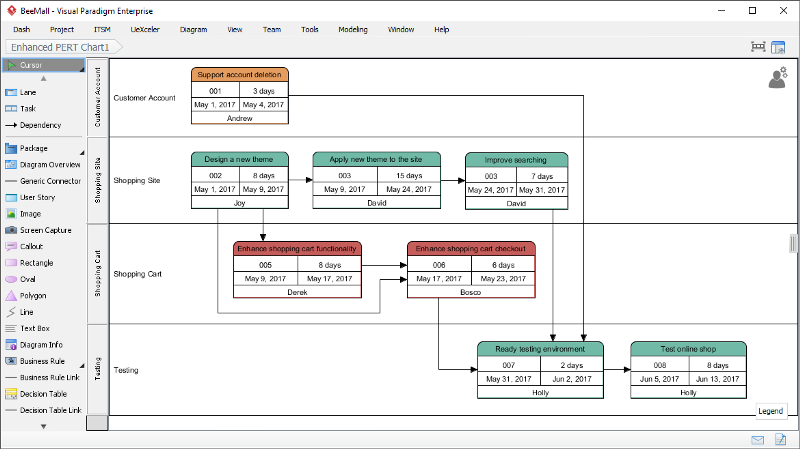
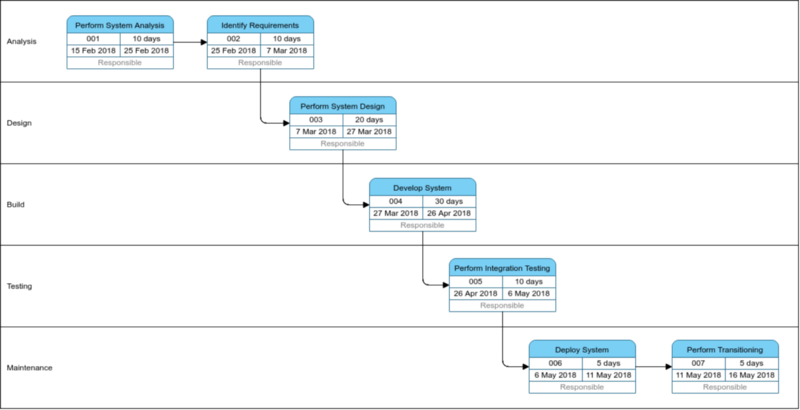
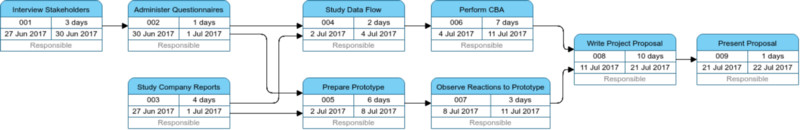
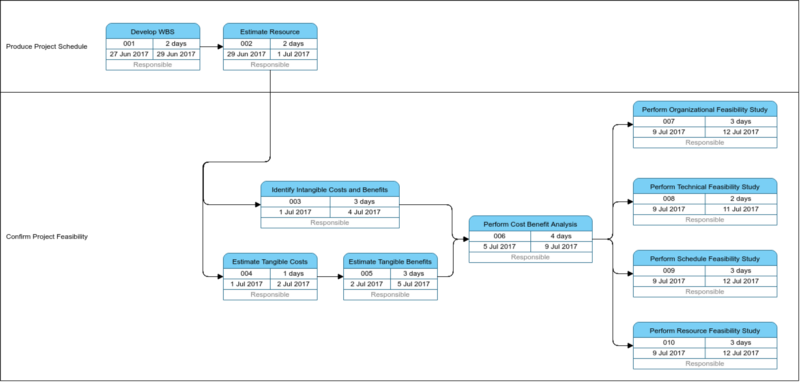
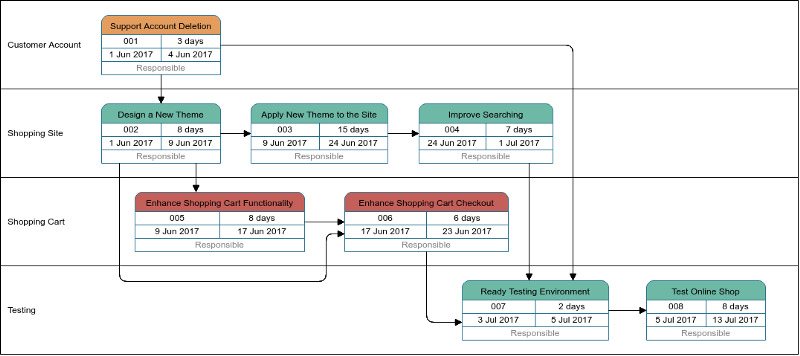
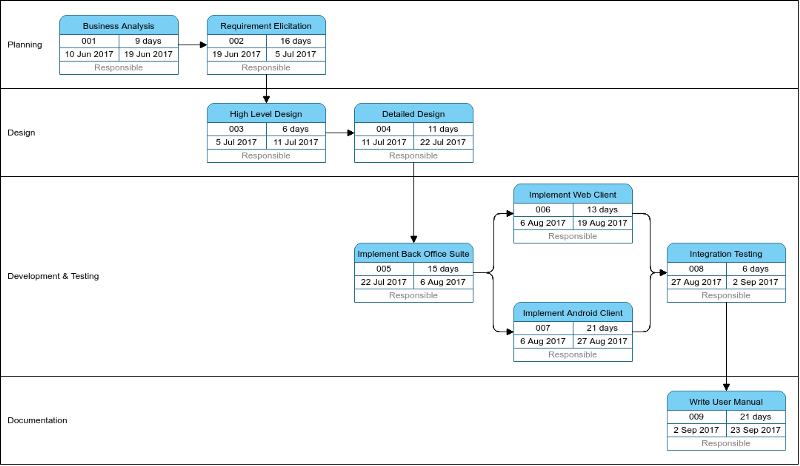
Program Evaluation Review Technique (PERT) charts A PERT chart is a project management tool that provides a graphical representation of a project’s timeline for breaking down the individual tasks of a project for analysis.
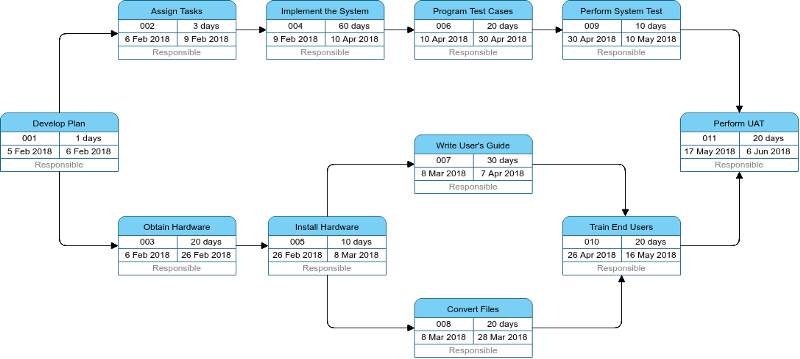
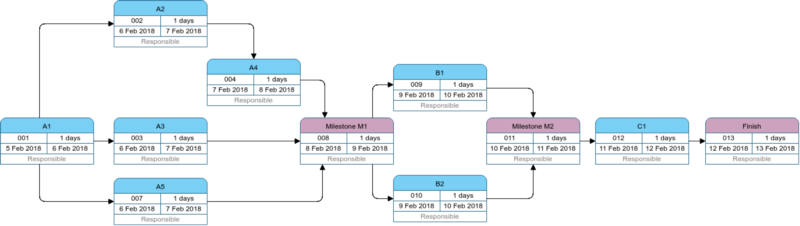
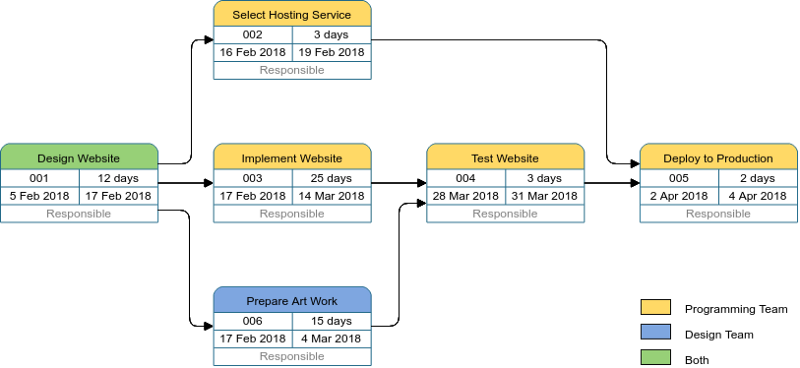
A PERT chart shows each task in a project as a node. Dependencies between tasks (e.g. where one task requires another one to be completed before it can start) are clearly shown by interconnections between the task nodes. It also shows timing information for each task that is similar to the critical path method (CPM) which identifies the longest path through the project, and therefore the minimum time for the project to be completed.
Purpose of PERT Charts
Project managers can use PERT charts to:
- set a realistic timetable for project completion
- make sure focus is maintained on the most critical tasks for the critical path — since the path leads to the minimum time the project requires, any delays to these tasks will result in a delay to the overall project
- identify tasks that need to be shortened if the overall project time needs to be reduced
- identify tasks that can be carried out simultaneously
- identify slack time where certain tasks are not as time-critical to the overall deadline.
Enhanced PERT Chart with Visual Paradigm
A traditional PERT chart is a project management tool used to schedule, organize, and coordinate tasks within a project. The enhanced PERT Chart tool adds four additional features for integrating with different Visual Paradigm building blocks. You can do all these within an enhanced PERT Chart modeler.
- Selection of Responsible person (associate the task who responsible for)
- Task-based RACI (Responsible — Accountable — Consult — Inform)
- Task to Task Manager (Visual Paradigm Tasifier)
- Automated RACI in Task Manager
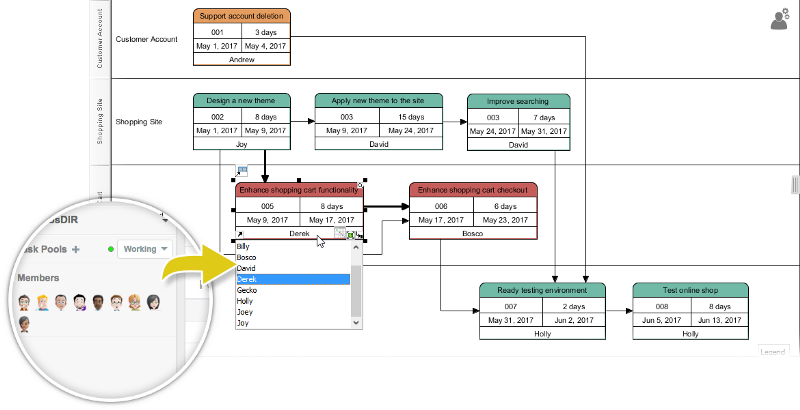
Responsible person assignment
If you are using our team solution such as VP Online or Teamwork Server, you can select team members to be the responsible person of tasks in a PERT Chart. This makes task planning much easier and effective.
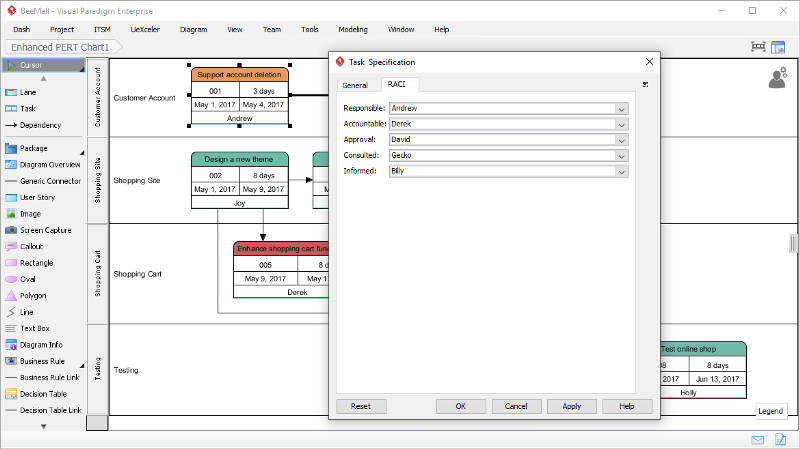
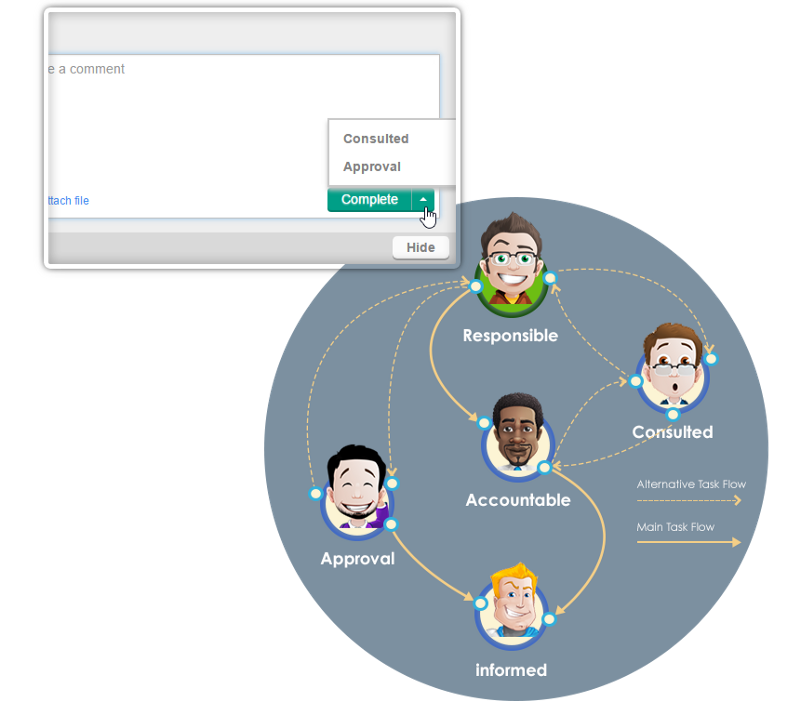
RACI per task
Besides who is responsible for what task(s), you can further depict the detailed roles (Responsible — Accountable — Consulted — Informed) of a particular task. If you synchronize the PERT Chart to the task manager, you will see the tasks appeared in the list of the member who is “Responsible” for it. And, when the member has completed the tasks, that particular task will be shown up, in turn according to the RACI flow scheme of the corresponding members.
Generate tasks from PERT chart
Once you have finished creating the schedule baseline with the Enhanced PERT Chart, you can synchronize the tasks of the PERT to the task manager. Tasks will be automatically generated, and be assigned to the corresponding members. You can view them in both Project View or Member View.
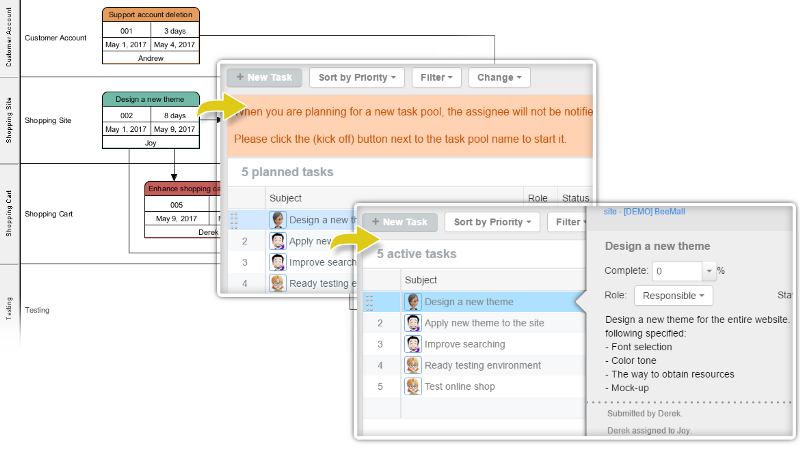
Execute PERT chart in action
As mentioned, when you synchronize the tasks in a PERT Chart to the Task Manager, you will only see the tasks added to the members who is responsible for them at first. But when the task has been marked completed by a member, the task will flow to the other member who is Accountable / Consult / Information according to the task flow scheme.
Do-It-Yourself PERT Examples
Click and try it yourself with Visual Paradigm Online examples
Develop PERT Chart from Structure Task List
Enhanced Pert Chart for Task Management Automation
Related Articles of Visual Paradigm Online on PERT Chart
This post is also available in Deutsch, Español, فارسی, Français, English, Bahasa Indonesia, 日本語, Polski, Portuguese, Ру́сский, Việt Nam, 简体中文 and 繁體中文.