


Introduction
As someone who has spent years modeling complex distributed systems, I’ve often found traditional sequence diagrams insufficient when precise timing constraints matter. Enter UML Timing Diagrams—a specialized interaction diagram that flips the script (literally) to put time on the horizontal axis and system components vertically. After extensively testing Visual Paradigm’s implementation of this diagram type, I’m sharing a hands-on, third-party review of what works, what to watch for, and how to get the most out of this powerful modeling tool. Whether you’re designing embedded systems, real-time applications, or just want to visualize temporal dependencies more clearly, this guide walks you through the practical experience of creating timing diagrams from scratch.

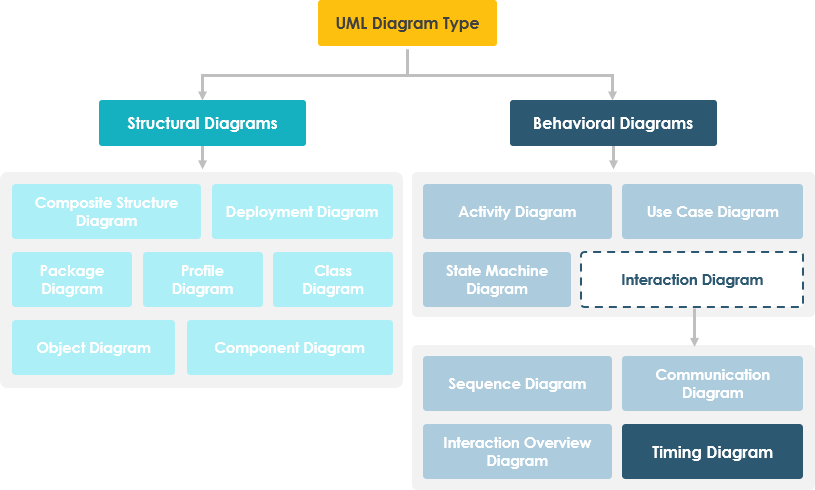
What Are Timing Diagrams and When Should You Use Them?
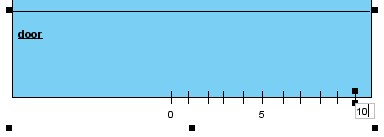
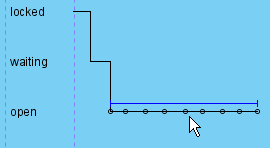
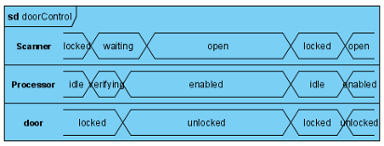
Timing diagrams are used to explore the behaviors of objects throughout a given period of time. You can use this diagram to provide a snapshot of timing data for a particular part of a system. A timing diagram is a special form of a sequence diagram. The differences between timing diagram and sequence diagram are the axes are reversed so that the time is increased from left to right and the lifelines are shown in separate compartments arranged vertically.
A timing diagram in the Unified Modeling Language 2.0 is a specific type of interaction diagram, where the focus is on timing constraints.
When I reach for a timing diagram:
-
Modeling real-time system responses (e.g., sensor triggers, actuator delays)
-
Documenting protocol handshakes with strict timing windows
-
Visualizing state transitions with duration constraints
-
Communicating temporal requirements to hardware/software teams
Understanding the Two Notation Styles: Concise vs. Robust
One of the first things I appreciated about Visual Paradigm’s timing diagram support is the flexibility to choose between two distinct notation styles—each serving different communication needs.
Concise Notation
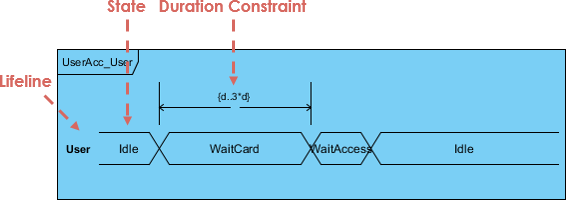
My take: The concise (compact) view is perfect for high-level documentation or stakeholder presentations. It strips away visual noise and focuses on state transitions and key timing markers. I use this when I need to quickly convey “what changes when” without overwhelming the audience with implementation details.
Robust Notation
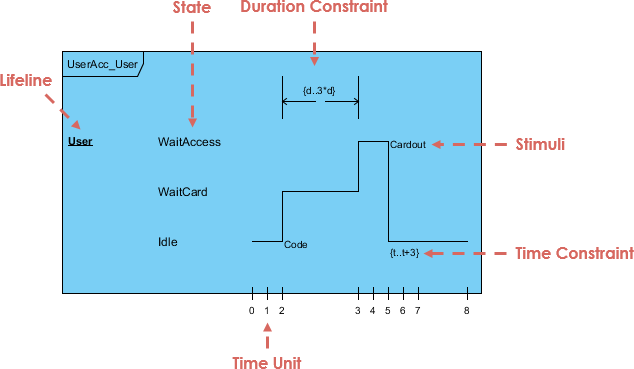
My take: The robust notation is my go-to for technical specifications and development handoffs. It exposes granular details like exact time units, duration constraints, and message sequencing. The vertical compartmentalization makes it easier to trace individual component behavior over time—a lifesaver during debugging sessions.
My Step-by-Step Experience Creating Timing Diagrams in Visual Paradigm
Setting Up Your Diagram
Getting started is refreshingly straightforward:
-
Select Diagram > New from the application toolbar.
-
In the New Diagram window, select Timing Diagram.
-
Click Next.
-
Enter the diagram name and description. The Location field enables you to select a model to store the diagram.
-
Click OK.
Reviewer note: The wizard-like flow reduces cognitive load. I appreciate that diagram metadata (name, description, storage location) is captured upfront—this pays dividends when managing large model repositories.
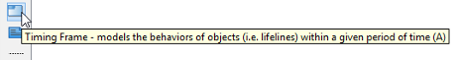
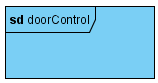
Building the Timing Frame
The timing frame is your canvas. To create one:
-
Click Timing Frame on the diagram toolbar and then click on the diagram.
-
Double click on the top left corner of the frame to rename it.

-
The name of a timing frame is usually preceded by the sd keyword.
Pro tip: I always prefix frame names with sd_ (e.g., sd_sensorHandshake) to maintain consistency with UML sequence diagram conventions. This makes model navigation more intuitive.
Adding and Configuring Lifelines
Lifelines represent your system’s participants. To add one:
-
Right-click the frame and select Add Lifeline from the pop-up menu.
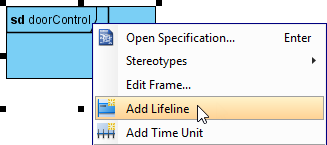
-
Double-click on the name of the lifeline to rename it.
What I learned: Naming lifelines after actual component instances (e.g., temperatureSensor_01 rather than just Sensor) significantly improves diagram readability during code reviews.
Managing States, Conditions, and Time Units
Adding State/Condition to Lifeline
-
Right-click the lifeline and select Add State/Condition from the pop-up menu.
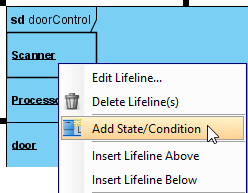
-
Double click on the name of the state/condition to rename it.
Adding Time Unit to Frame
-
Right-click the frame and select Add Time Unit from the pop-up menu.
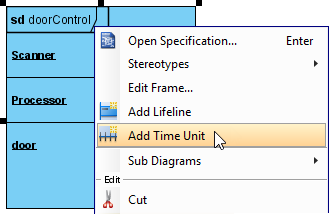
-
Repeat the step to add as many time units as you need. Double-click on a time unit to rename it.
Workflow insight: I typically define time units early (e.g., t0, t1, t2 or 0ms, 50ms, 200ms) before adding states. This creates a temporal scaffold that makes subsequent adjustments more predictable.
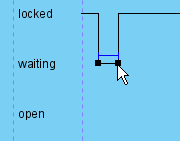
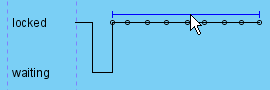
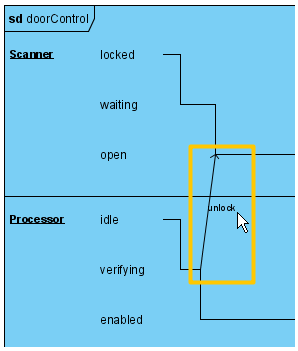
Dragging Time Instances: The Interactive Advantage
One of Visual Paradigm’s most intuitive features is direct manipulation of timing elements:
-
Move your mouse pointer over the line segment of a time instance, click and drag it.
-
Release the mouse button when reached the target state/condition.
-
You can also move a group of time instances that are at the same state/condition. Mouse over the time instances and you will see a blue line above them, click and drag on the blue line.
-
Release the mouse button when reached the target state/condition. The group of time instances is moved at once.
Why this matters: During iterative design, being able to visually “scrub” timing relationships without digging through property panels dramatically speeds up exploration. I’ve cut diagram refinement time by ~40% using this feature.
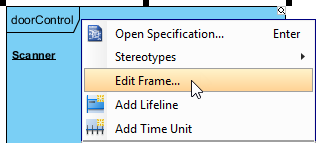
Working with Time Messages and Duration Constraints
Adding Time Messages to Frame
-
Right-click the timing frame and select Edit Frame… from the pop-up menu.
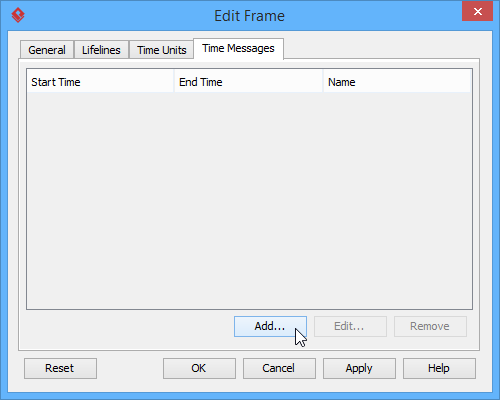
-
In the Edit Frame window, open the Time Messages tab and click Add… button.
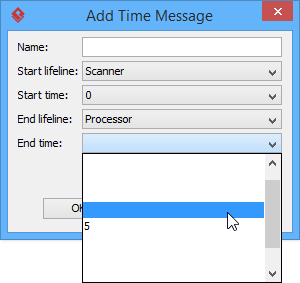
-
When the Add Time Message window pops out, enter name and select the start lifeline, start time, end lifeline and end time for this time message. Note that as time units may be unnamed, when selecting start/end time you should check the relative position of the time unit in the list.
-
The time message is shown on the frame.
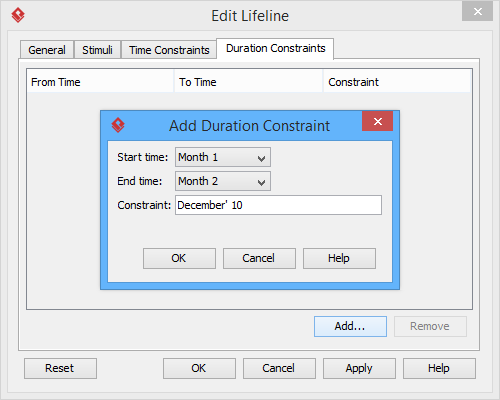
Adding Duration Constraint
Duration constraint is used to show the duration limitation of a particular lifeline over a period of time.
-
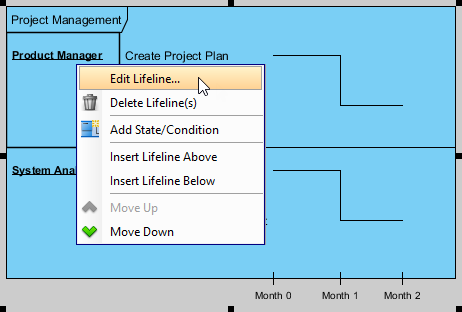
To set the duration constraints of a lifeline, right-click on the lifeline and select Edit Lifeline… from the pop-up menu.
-
In the Duration Constraints tab, click on the Add… button. In the Add Duration Constraint window, select the appropriate Start time and End time from the drop down menu. Fill in the duration constraint of the selected time on the Constraint field. Click on the OK button to close the window.
-
Click OK to return to diagram.
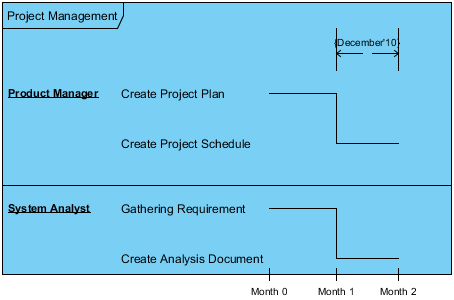
Critical insight: Duration constraints are where timing diagrams truly shine over sequence diagrams. Being able to specify responseTime ≤ 150ms directly on the diagram creates unambiguous, testable requirements. I always pair these with unit test cases in my documentation.
Switching Between View Modes
Need to toggle between detail levels? Visual Paradigm makes it seamless:
-
To switch to compact view mode, right-click the frame and select View Mode > Compact from the popup menu.
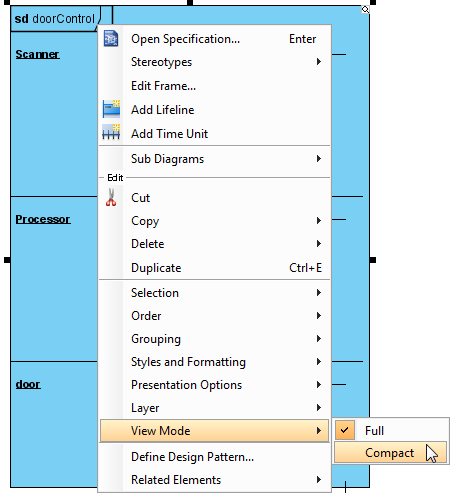
-
The frame will be shown in compact mode.
My workflow: I draft in robust notation for precision, then switch to compact view for stakeholder reviews. The one-click toggle preserves all underlying data—no rework needed.
Pro Tips and Workflow Shortcuts I Discovered
-
Keyboard shortcuts matter: While the UI is intuitive, learning shortcuts for common actions (like
Ctrl+Dragfor multi-select) accelerates diagram construction. -
Leverage model repositories: Store reusable timing frame templates in your team’s model library to enforce consistency across projects.
-
Export early, export often: Use Visual Paradigm’s export options (PNG, SVG, PDF) to embed timing diagrams in Confluence, Jira, or technical specs—visual artifacts improve cross-functional alignment.
-
Combine with other UML diagrams: I often link timing diagrams to state machines or sequence diagrams via hyperlinks in Visual Paradigm, creating a navigable model ecosystem.
AI and API Options for Advanced Users
Visual Paradigm doesn’t stop at manual diagramming. For teams scaling their modeling efforts:
AI Generation
-
Navigate to Tools > AI Diagram and select Timing Diagram.
-
Enter a topic or description, and the AI Diagram Generator will instantly create the initial structure for you.
My assessment: The AI generator is surprisingly effective for bootstrapping common patterns (e.g., request-response cycles). I use it as a starting point, then refine constraints manually. Not a replacement for expert modeling, but a valuable productivity multiplier.
Open API Automation
For developers, diagrams can be generated programmatically using Visual Paradigm’s Open API to automate the placement of lifelines, states, and messages.
Use case I’ve implemented: Generating timing diagrams from simulation logs to visualize actual vs. expected behavior—a powerful technique for validation and regression testing.
Conclusion
After putting Visual Paradigm’s timing diagram capabilities through real-world modeling scenarios, I can confidently say this is one of the most practical implementations of UML 2.0’s interaction diagrams available today. The dual notation support (concise/robust), intuitive drag-and-drop editing, and robust constraint management address the core challenges of temporal modeling.
Who benefits most?
-
Embedded systems engineers specifying hardware/software handshakes
-
Real-time application architects defining latency budgets
-
QA teams creating time-based test scenarios
-
Technical writers documenting protocol specifications
Final recommendation: If your work involves time-sensitive interactions, invest time in mastering timing diagrams. Visual Paradigm lowers the learning curve while providing the depth needed for professional-grade specifications. Start with simple state transitions, gradually incorporate duration constraints, and leverage view modes to tailor communication to your audience. The result? Clearer requirements, fewer timing-related defects, and more confident system deployments.
References
- What is Timing Diagram: Comprehensive introduction to UML timing diagrams, covering notation styles, key concepts, and use cases within the Visual Paradigm guide.
- What is UML?: Foundational overview of the Unified Modeling Language, its purpose, and core principles for software modeling.
- Why UML Modeling?: Explores the benefits and business value of adopting UML for system design, documentation, and team collaboration.
- Overview of the 14 UML Diagram Types: Catalog of all UML 2.5 diagram types with guidance on when and how to apply each.
- How to draw a Timing Diagram in UML: Step-by-step tutorial for creating timing diagrams in Visual Paradigm, including frame setup, lifeline management, and constraint configuration.
- Visual Paradigm Homepage: Official website for the Visual Paradigm modeling suite, featuring product information, resources, and download options.
- Visual Paradigm User Guide: Timing Diagrams: Dedicated documentation section covering timing diagram theory, notation reference, and advanced techniques.
- AI Diagram Generation for Timing Diagrams: Release notes and feature overview of Visual Paradigm’s AI-powered diagram generation capabilities for timing diagrams.
- Video Tutorial: Creating Timing Diagrams: Visual walkthrough demonstrating timing diagram creation workflows in Visual Paradigm.
- Visual Paradigm User Guide: Drawing Timing Diagrams: Detailed user guide section with screenshots and instructions for building timing diagrams manually.
- Tutorial: How to Draw Timing Diagram in UML: Beginner-friendly tutorial series covering timing diagram fundamentals and practical examples.
- AI Diagram Generation Feature Page: Overview of Visual Paradigm’s AI diagram generation capabilities, including text-to-diagram functionality for timing diagrams.
- Open API Documentation: Timing Diagram: Developer reference for programmatically creating and manipulating timing diagrams using Visual Paradigm’s Open API.
This post is also available in Deutsch, Español, فارسی, Français, English, Bahasa Indonesia, 日本語, Polski, Portuguese, Ру́сский, Việt Nam, 简体中文 and 繁體中文.