


What is a flowchart?
A flowchart is a graphical representation of the operations involved in a data processing system.
operations in the system. Often, the best way to understand a problem is to draw a diagram. Diagrams usually give us a more complete picture of a situation than a short set of words or phrases. However, the combination of visual symbols )(shapes) and text provides a very powerful tool for communication and problem solving. Algorithms can be developed more quickly when a flowchart is created to represent them. Flowcharts are much easier to understand than algorithms.
A Flowchart Shows:
• shows logic of an algorithm
• emphasizes individual steps and their interconnections
• e.g. control flow from one action to the next
Flowchart Symbols
Flowcharts have many standard symbols. Flowcharts use boxes of different shapes are used to represent different types of instructions. The actual instructions are written inside the boxes. These boxes are connected by solid lines with arrows that indicate the flow direction of the flowchart. The flow direction of the flowchart. The boxes used in flowcharts are standardized and have specific meanings. The symbols for these flowcharts have been developed by the American National Standards Institute (ANSI).
| Element | Description | Symbol |
| START / STOP terminator | START and one STOP terminator in your entire flowchart. In case a program logic involves a pause, it is also indicated with the terminal symbol. | 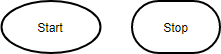 |
| Input / Output | This symbol is used to denote any input/output function in the program. Thus if there is any input to the program via an input device, like a keyboard, tape, card reader, etc. it will be indicated in the flowchart with the help of the Input/output symbol. Similarly, all output instructions, for output to devices like printers, plotters, magnetic tapes, disk, monitors, etc. are indicated in the Input/output symbol. |  |
| Decision | Represents a decision point in the process, usually requiring a `yes’ or `no’ response, then branching to different parts of the flowchart. |  |
| On/Off Page Reference. | Represents a connection with another process. | 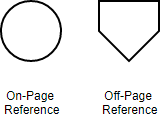 |
| Flow Lines | Indicates the direction of flow. Horizontal arrows depict procedures or linear sequence of events, and vertical arrows depict sub- or superordinate skills and knowledge. | |
| Process | A process symbol is used to represent arithmetic and data movement instructions in the flowchart. All arithmetic processes of addition, subtraction, multiplication, and division are indicated in the process symbol. The logical process of data movement from one memory location to another is also represented in the process box. |  |
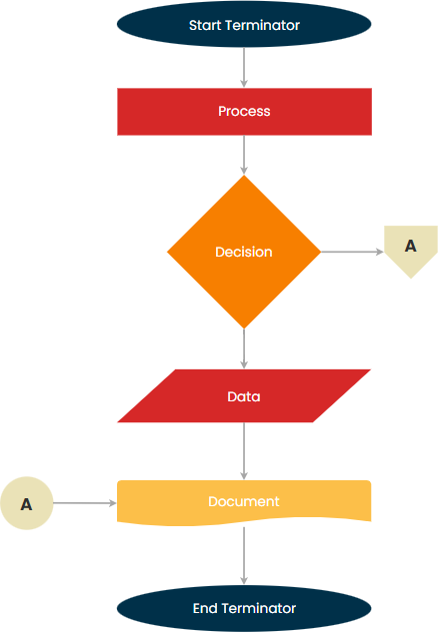
Flowchart at a Glance: Symbol illustration
The flowchart should have a starting point and one or more ending points, and should be arranged in a top-to-bottom, left-to-right direction.
A simple flow chart showing the symbols described above can be seen below:
Representing Algorithm in Structured Programming with Flow Chart
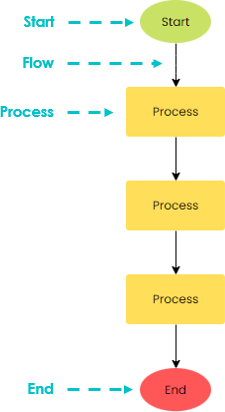
Flowcharts are often used to represent algorithms for structured programming. Flowcharts outline the structure and logic of an algorithm, as well as the sequence of operations to be followed in solving the problem.
- Flowcharts are useful for complex programs containing many branches because they describe the interrelationships between individual branches and loops.
- They also help to detect and correct errors in the logic and develop more efficient structures.
Finally, a flowchart is an excellent vehicle for documenting a program. It provides a convenient means of communication between both programmers and nonprogrammers.
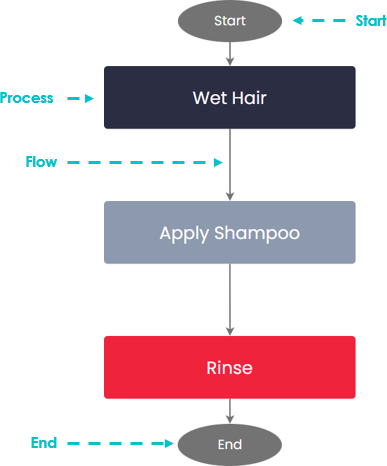
Sequence – A series of processes / steps that follow in order.
For example, to wash your hair;
1. Wet hair
2. Apply shampoo
3. Rinse
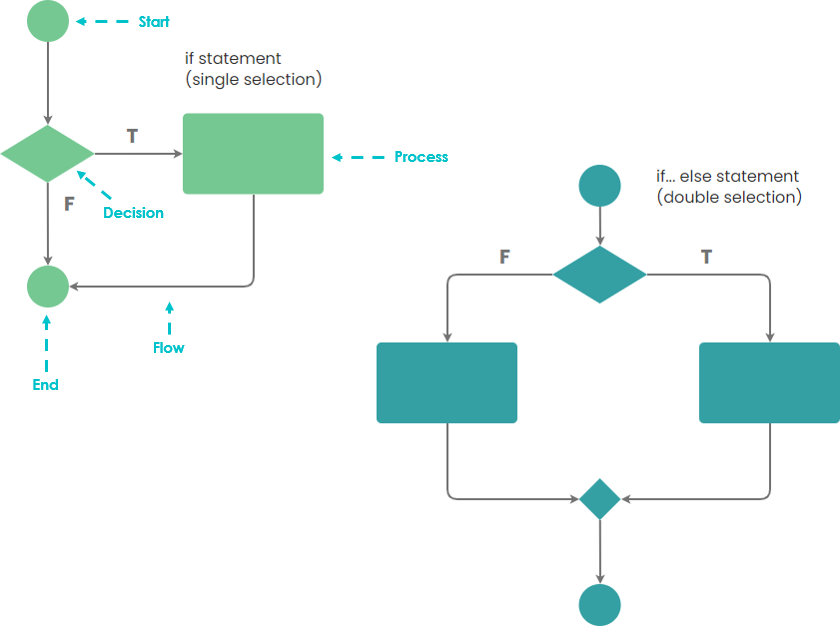
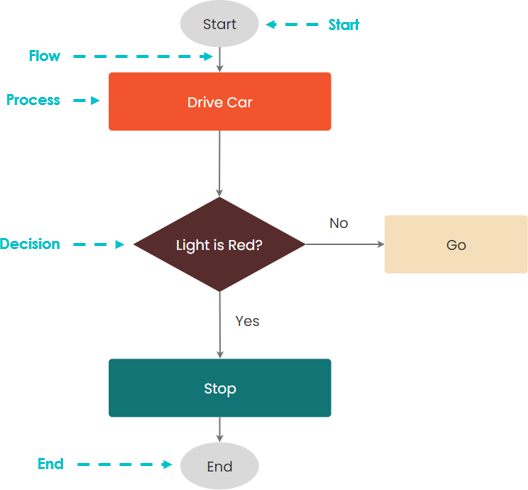
Selection – A condition exists that may change the order or types of processes to be followed.
For example, IF the light is red THEN I will stop OTHERWISE I will go.
Online flowchart example: Edit now
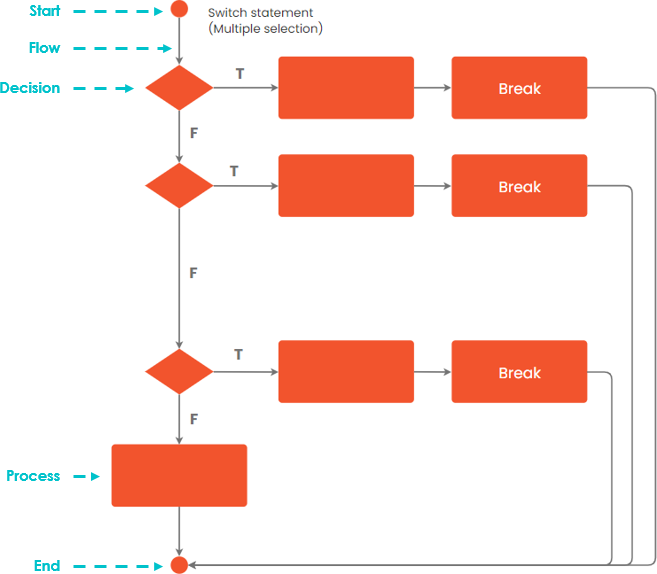
Case Statement
Edit flowchart: Online flowchart maker
Repetition – Often, we may want to execute the same set of processes multiple times, and we can execute a loop that does the same set of actions over and over until a stop condition occurs. Failure to provide a stop condition will cause the process to enter an infinite loop
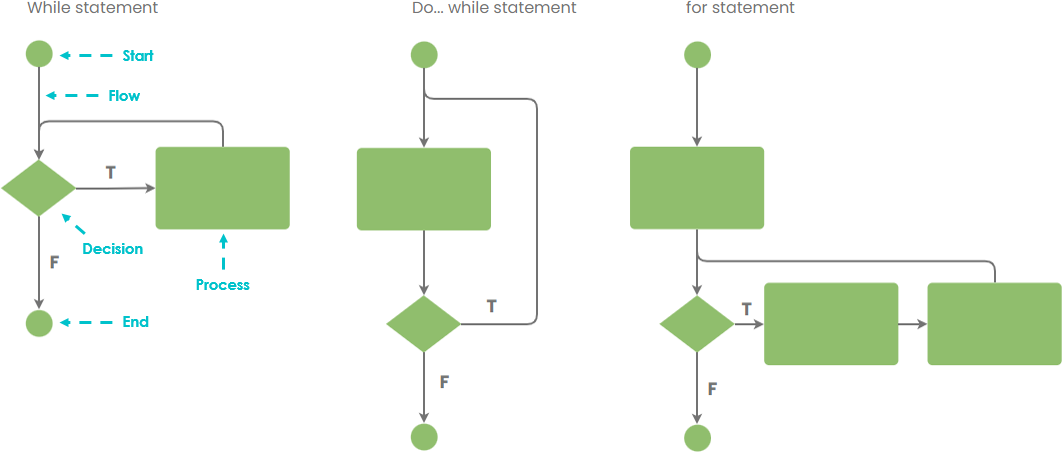
Edit in our online flowchart editor
An example of a LOOP could be to display the word ‘SCHOOL’ on the screen 7 times.
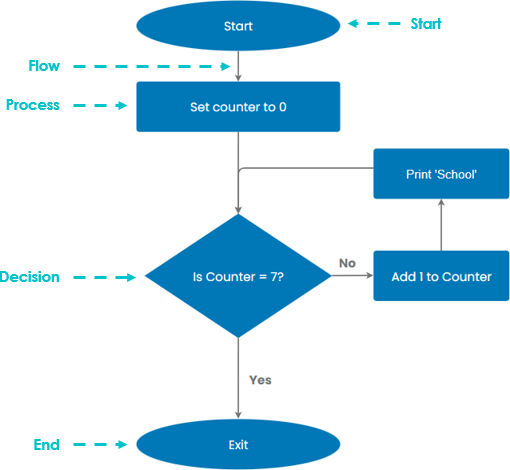
Edit in our flowchart software
Develop Flowchart with Stepwise Refinement
Stepwise refinement is the process of breaking down a programming problem into a series of steps. You start with some general steps to solve the problem and refine each step in turn. Once you have refined each step, you further break these general steps into a series of smaller sub-steps. Once that is done, you continue until you have described the problem in such detail that you can write code for its solution.
Stepwise refinement: design a problem solution by
-
- stating the solution at a high level
- refining steps of the solution into simpler steps
- repeating step 2, until steps are simple enough to execute
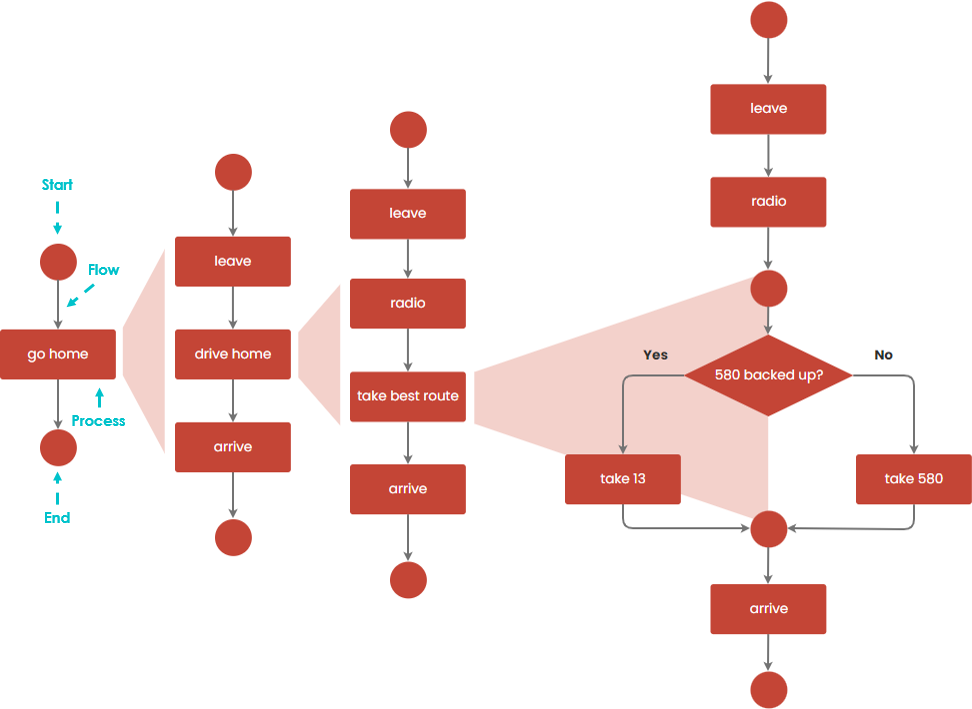
Stepwise Refinement with Flowchart Example – Go home
The most effective way to solve a complex problem is to break it down into successively simpler subproblems. You start by breaking down the entire task into simpler parts. Some of these tasks may themselves need to be subdivided. This process is called stepwise refinement (or top-down decomposition). You can follow the steps and create a flowchart using the stepwise refinement technique.
The flowchart below illustrates the progressive refinement of these four stages.
- We are refining one thing at a time.
- The light blue trapezoid shows how one step in the diagram on the left is refined (expanded) in the next flowchart on the right.
Flowchart Stepwise Refinement Example – Wash Hands
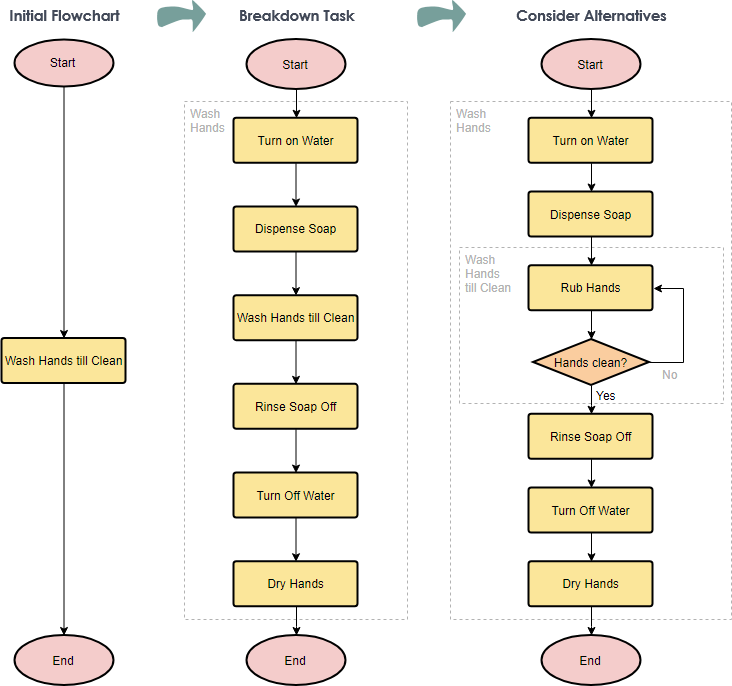
Edit this flowchart example [Flowchart Software]
flowchart Example – Solve an algorithm
Express an algorithm that gets two numbers from the user (the dividend and the divisor) and tests to ensure that the divisor is not zero. Ensure that the divisor is not zero and use a flowchart to show their quotient.
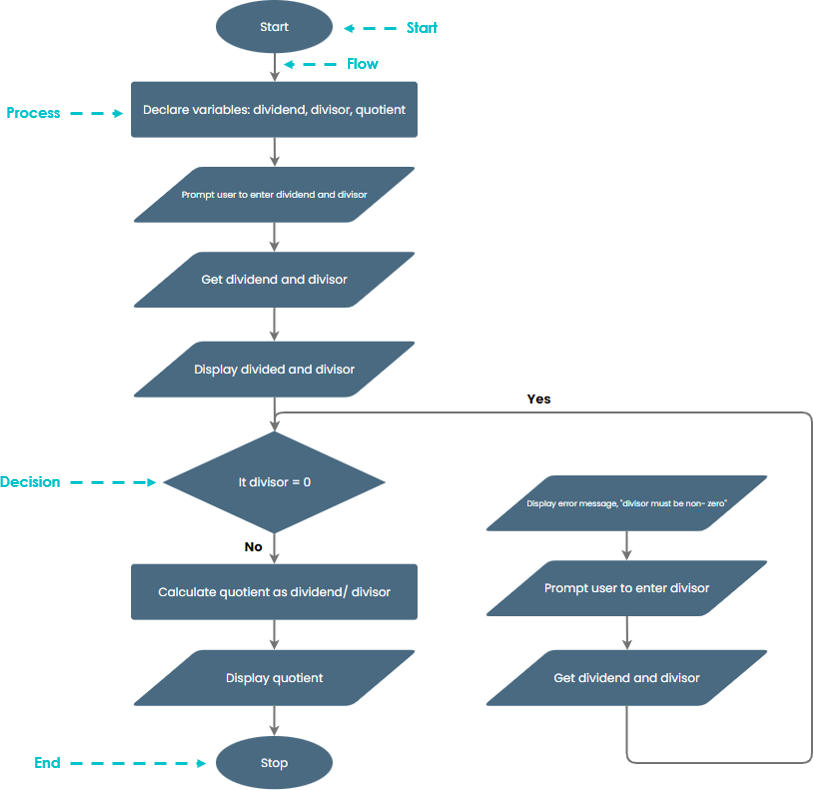
Flowchart software – Edit this flowchart example [Flowchart Maker]
Flowchart Example – the process for making a cup of tea can now be demonstrated in more detail:
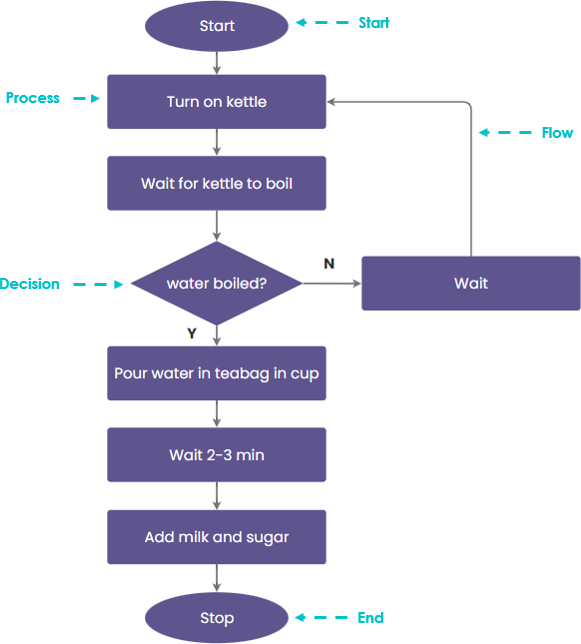
Flowchart editor online – Edit this flowchart example
Flowchart Example: Convert Temperature Fahrenheit to Celsius
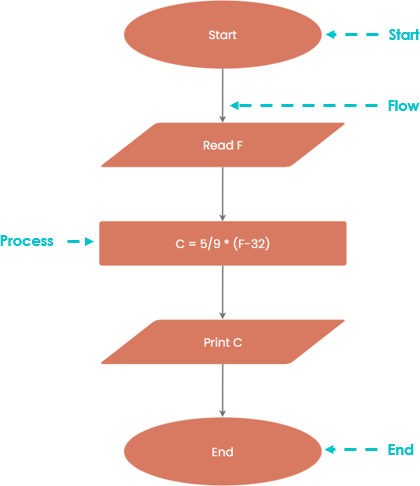
Edit this flowchart example – online flowchart maker
Learn More about Flowchart – by examples
A flowchart is one of the most widely used diagrams that represents an algorithm, workflow or process, showing the steps in various boxes and connecting them in order by arrows. You can create a flowchart from scratch, or simply start with the flowchart templates available in Visual Paradigm Online flowchart software.
Need some inspiration? We’ve put together some flowchart examples below to help you get started. Click on a flowchart to view it, or click the Edit button to start editing.


")
")
")
")


")
")


This post is also available in Deutsch, Español, فارسی, Français, English, Bahasa Indonesia, 日本語, Polski, Portuguese, Ру́сский, Việt Nam, 简体中文 and 繁體中文.