


What is a Flowchart?
In 1921, Frank Gilbert developed the flowchart, which was first presented to the American Society oBasi Mechanical Engineers (ASME). In the 1930s, industrialist Allan Mogensen discovered flowcharts applicable to industry and business. Mogenson initiated educational conferences and taught students how to use flow charts. In 1947, Douglas Hartree explained that the collaboration between Herman Goldstine and John Vbasic-flowchart-vs-cross-functional-flowcharon Neumann led to the development of flowchart applications in computer programming. Flowcharts were then applied as a technique for simplifying computer algorithms.
Traditionally, flowcharts are often used to illustrate the logic of a program. helps to plan or explain the logic of the program and explain the details of the program. As a programmer, it is often necessary to draw flowcharts to show the running process of the system or to express the logic of certain business. It can be said that drawing flowcharts is already a skill that programmers must master.
Since then, flowcharts have evolved and become more complex, leading to the development of the Unified Modeling Language Activity Diagram. Interactive computer terminals have reduced the importance of flowcharts by providing highly readable algorithms.
Nowadays, flowcharts are widely used in many industries, including engineering, physical sciences, computer programming, and even entertainment. In addition, flowcharts can can also be used to document other sequential plans. for example, a business process.
Why We need a Flowchart?
One of the advantages of flowcharts is that they can convey how a process is or should be without any domain-specific terminology. Some things are difficult to explain in words alone. But when a concept is presented to us through a visual graphic, it is much easier to understand. That’s why many people use different types of simple flowcharts to communicate ideas. The various advantages of using a flowchart include:
- Problem-solving
- Instant communication
- Visual clarity
- Enhance efficiency
- simplify documentation
- Instant communication
- validate requirement
Flowchart symbols:
A flowchart consists of the following key elements: process start and end nodes, activities to be carried out, decision nodes and connectors.
The different flowchart symbols have different conventional meanings.
The various symbols used in Flowchart Designs are given below.
- Terminal: In the flowchart, it is represented with the help of a circle for denoting the start and stop symbol. The symbol given below is used to represent the terminal symbol.

- Input/output: The input symbol is used to represent the input data, and the output symbol is used to display the output operation. The symbol given below is used for representing the Input/output symbol.

- Processing Symbol: It is represented in a flowchart with the help of a rectangle box used to represent the arithmetic and data movement instructions. The symbol given below is used to represent the processing symbol.

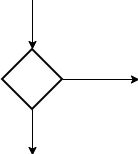
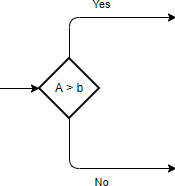
- Decision Symbol: Diamond symbol is used for represents decision-making statements. The symbol given below is used to represent the decision symbol.
- Connector: The connector symbol is used if flows discontinued at some point and continued again at another place. The following symbol is the representation of the connector symbol.

- Flow lines: It represents the exact sequence in which instructions are executed. Arrows are used to represent the flow lines in a flowchart. The symbol given below is used for representing the flow lines:

- On-Page Reference Symbol: This symbol contains a letter inside that indicates the flow continues on a matching symbol containing the same letters somewhere else on the same page. The symbol given below is used for representing the on-page reference symbol.

- Off-Page Reference: This symbol contains a letter inside indicating that the flow continues on a matching symbol containing the same letter somewhere else on a different page. The symbol given below is used to represent the off-page reference symbol.

- Internal storage symbol: The symbol given below is used to represent the internal storage symbol.

7 Steps to Develop a Flowchart?
Here are the general steps for creating a flowchart.
- Identify the problem: What is the process that needs to be visualized?
- Define the purpose
- List the steps of the main path in the correct order
- Determine each step as input/output/data, process, document, or other
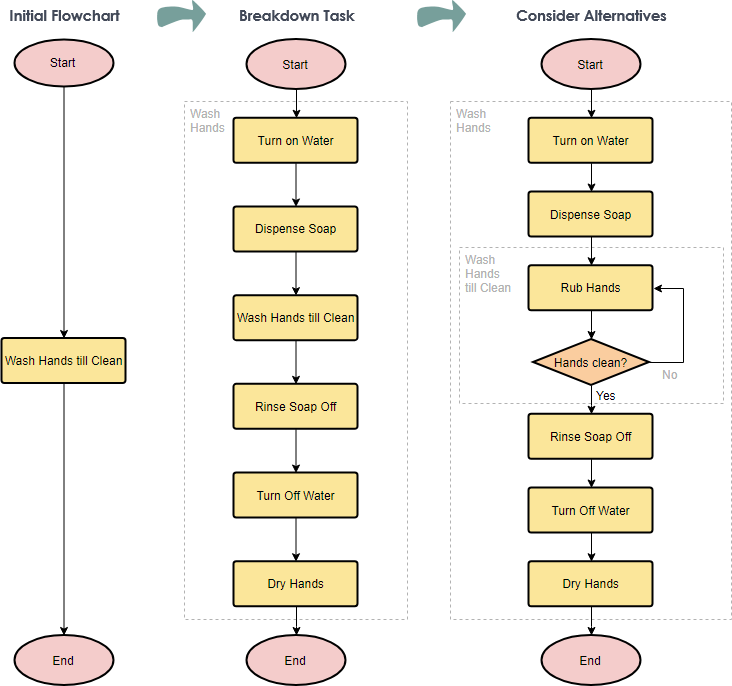
- Refine your flowchart by breaking down some complex tasks into smaller and specific steps.
- Consider and refine selection and iteration paths and logic
- Review and touch up the flowchart according to the purpose.
Flowchart Example – Hand Washing Example
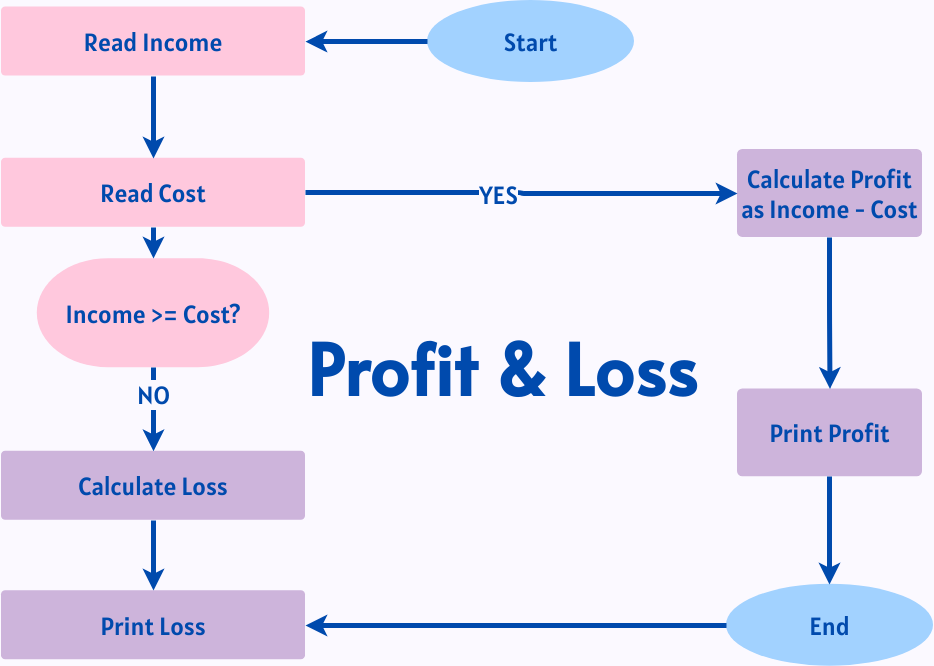
Example 1: Calculate Profit and Loss
Design a flowchart for adding two numbers entered by the user.
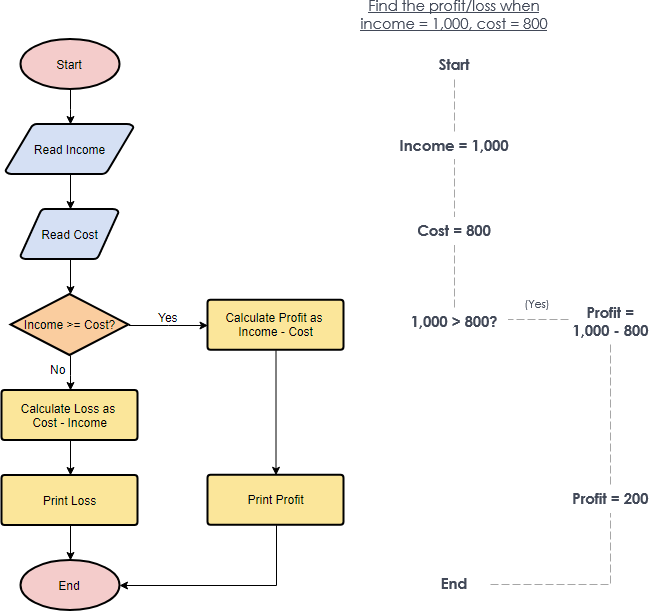
Example 2:
Design a flowchart for calculating the profit and loss according to the value entered by the user.
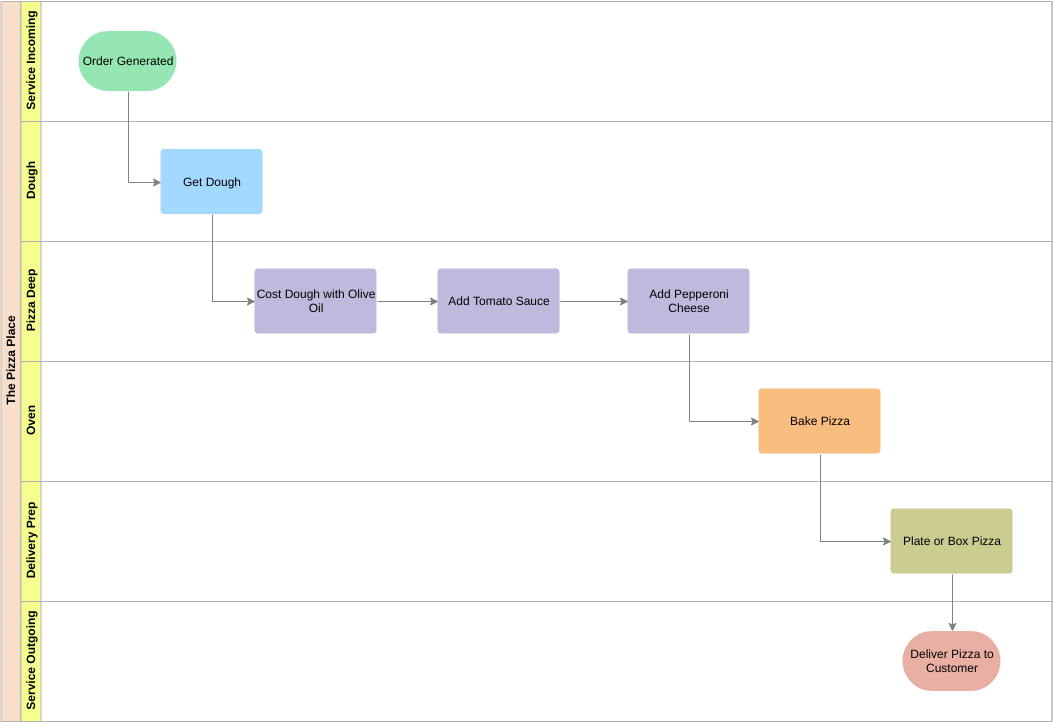
Cross Functional Flowcharts vs Basic Flowchart
The flowchart we are talking about is actually a traditional management business flowchart, containing both basic flowcharts and cross-functional flowcharts (swimlane diagrams).
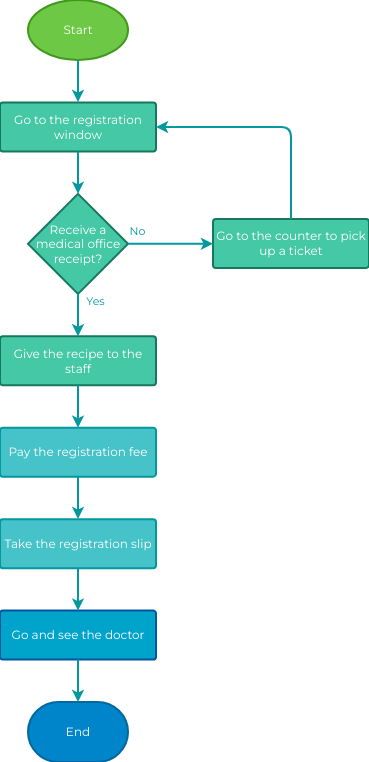
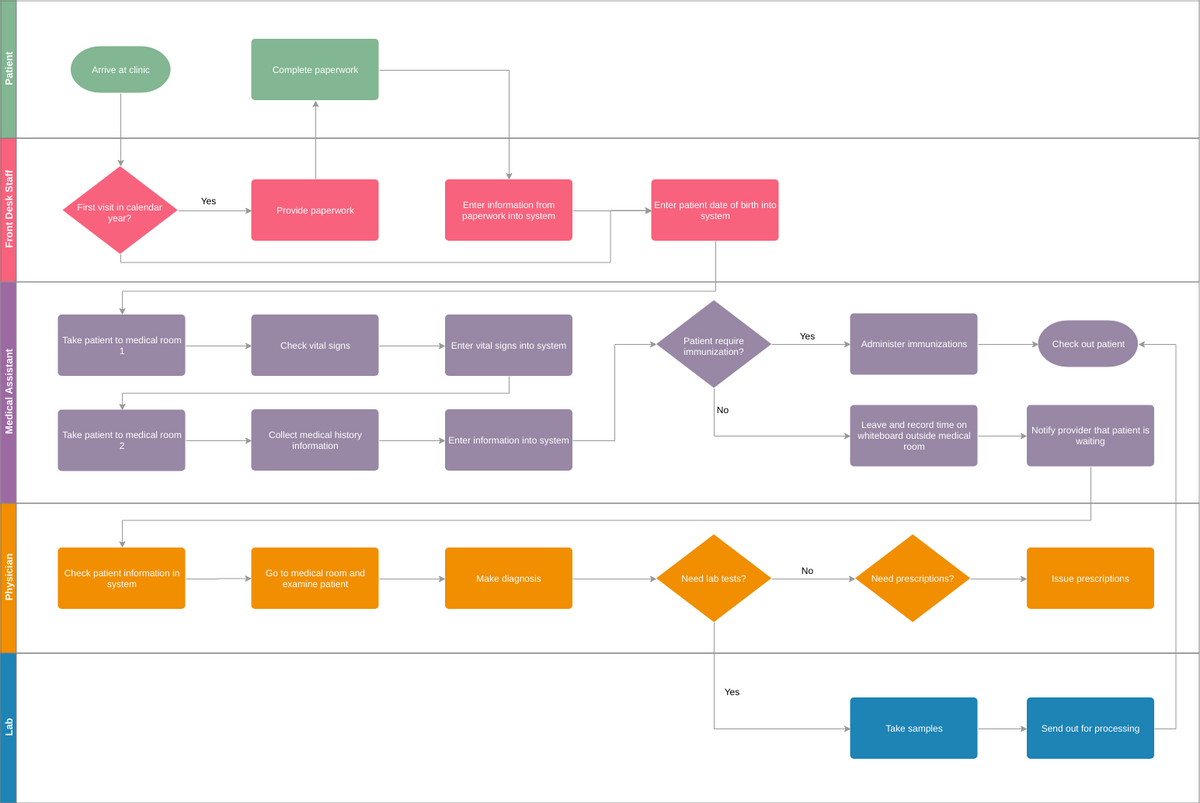
Take the hospital registration process as an example.
Business process description: To go to the hospital, you need to go to the service desk to get the small ticket of the department you want to see (assuming you have to get it), then go to the registration window and hand the small ticket to the staff, pay the registration fee and get the registration slip, then go to the specific department to see the doctor.
Basic Flowchart
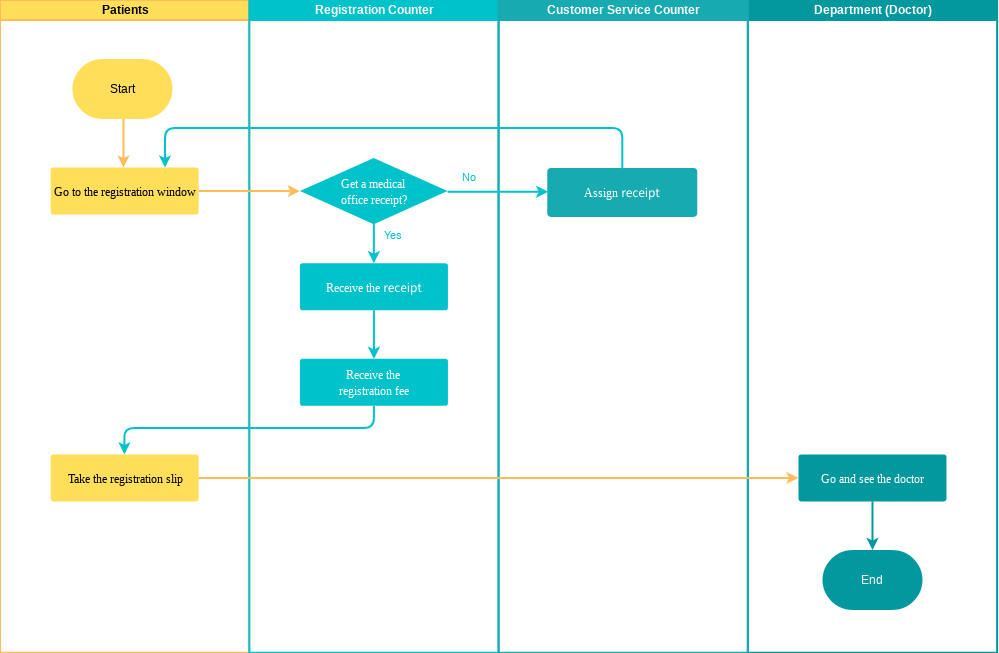
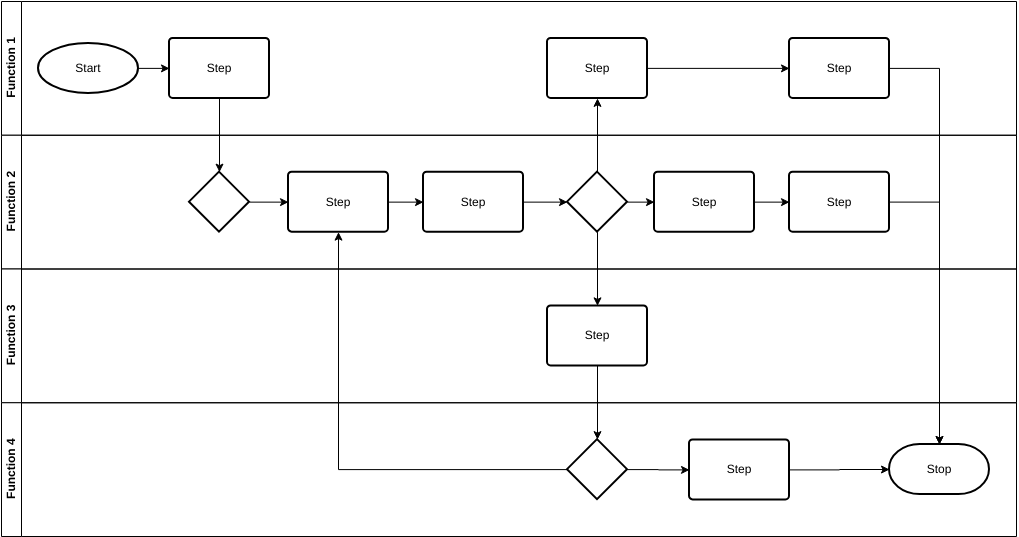
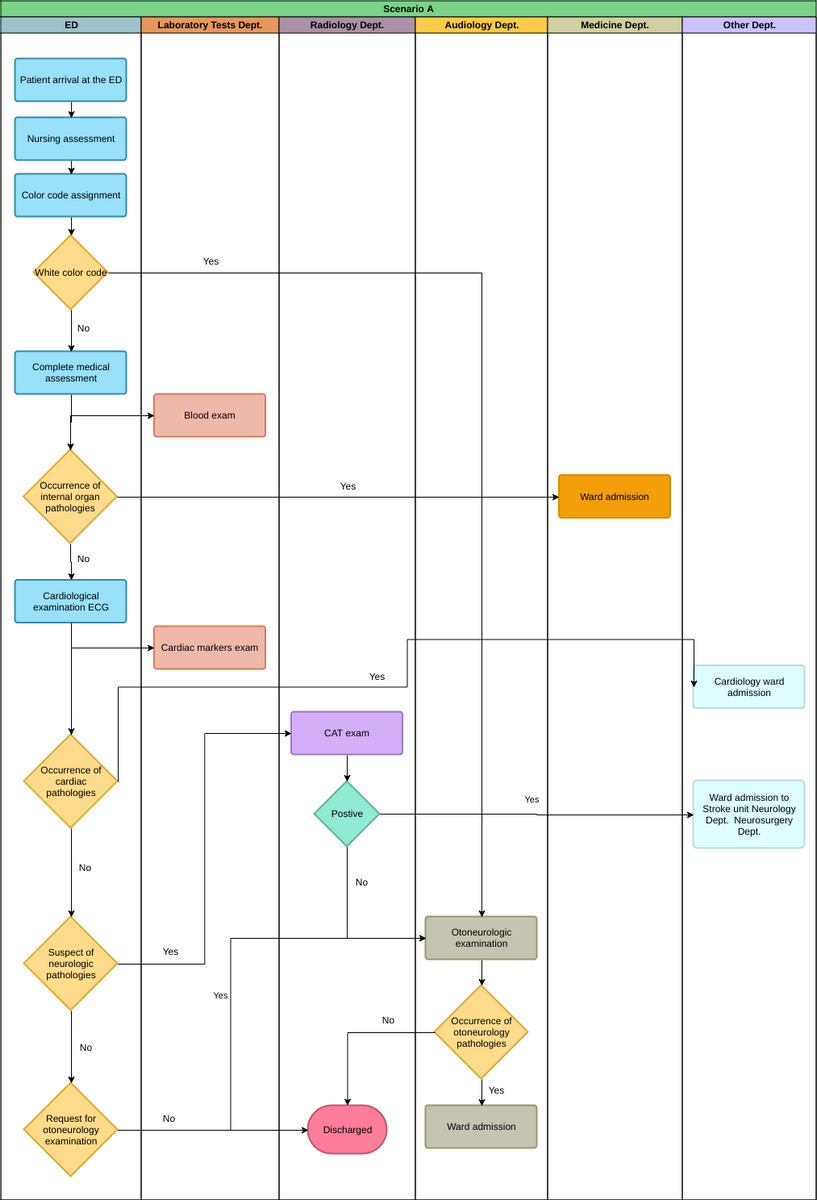
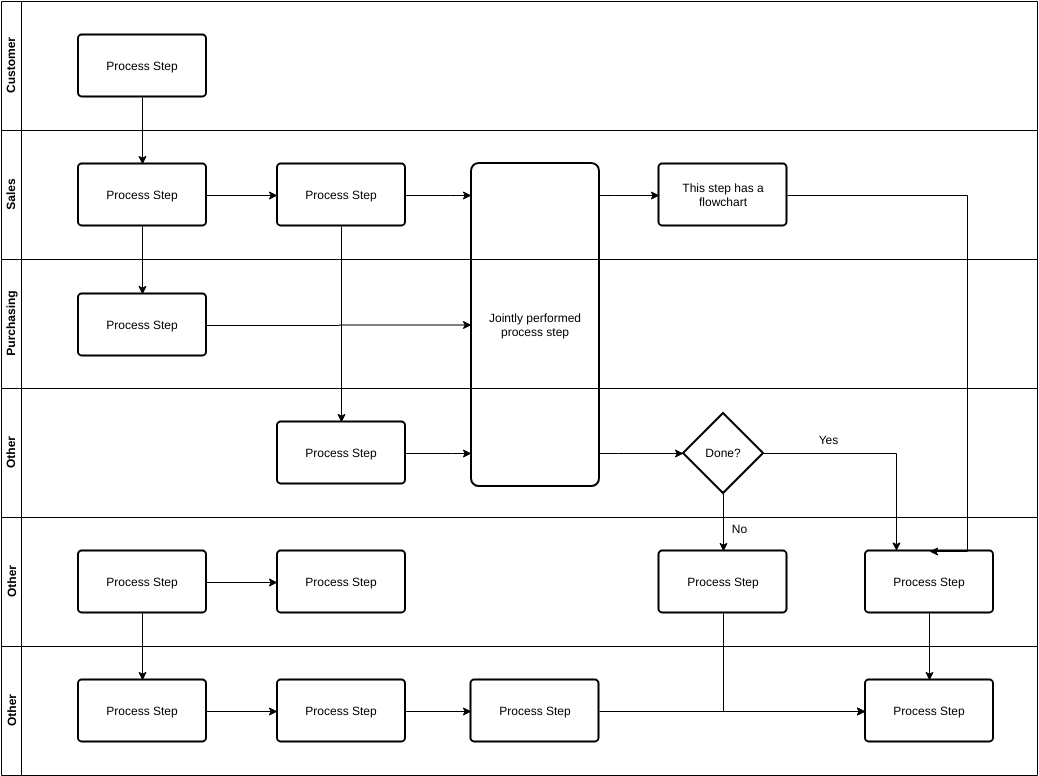
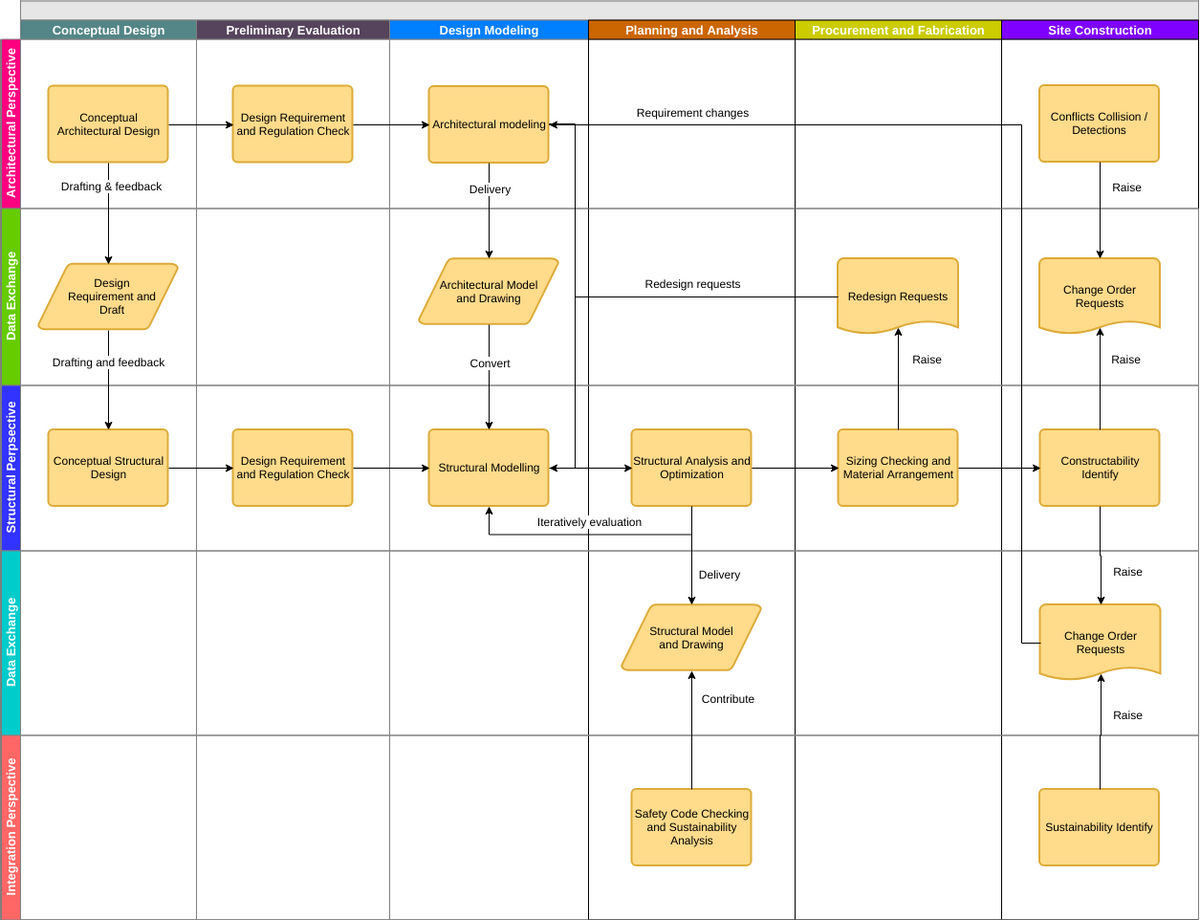
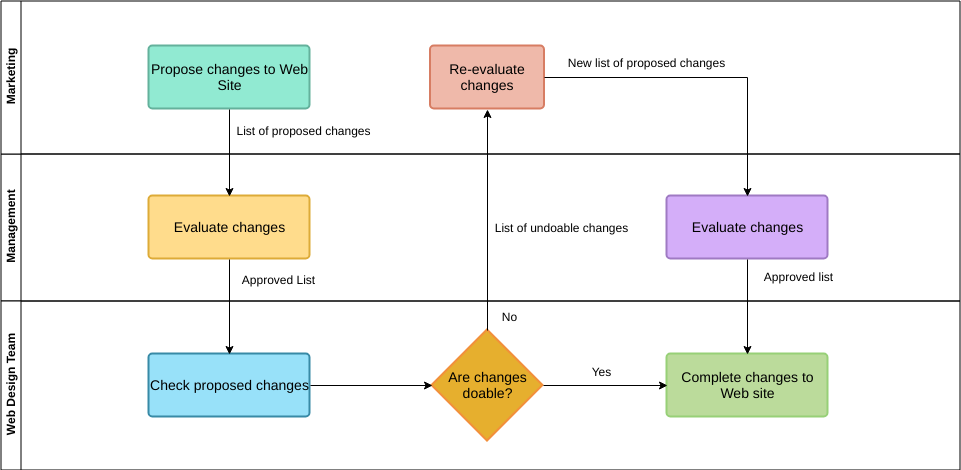
Cross-Functional (Swimlane) flowchart vs Basic Flowchart
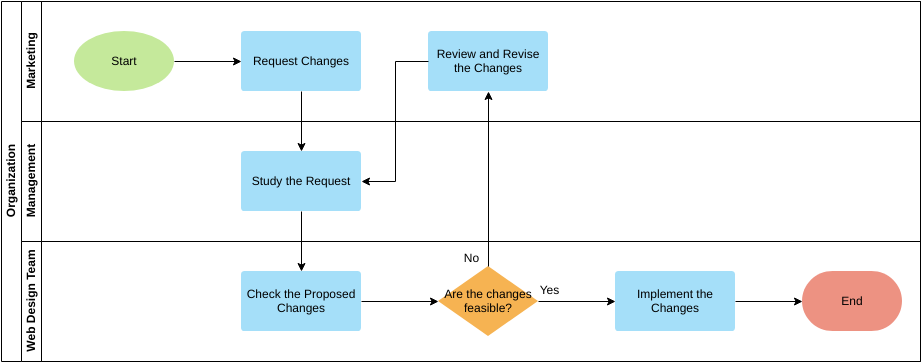
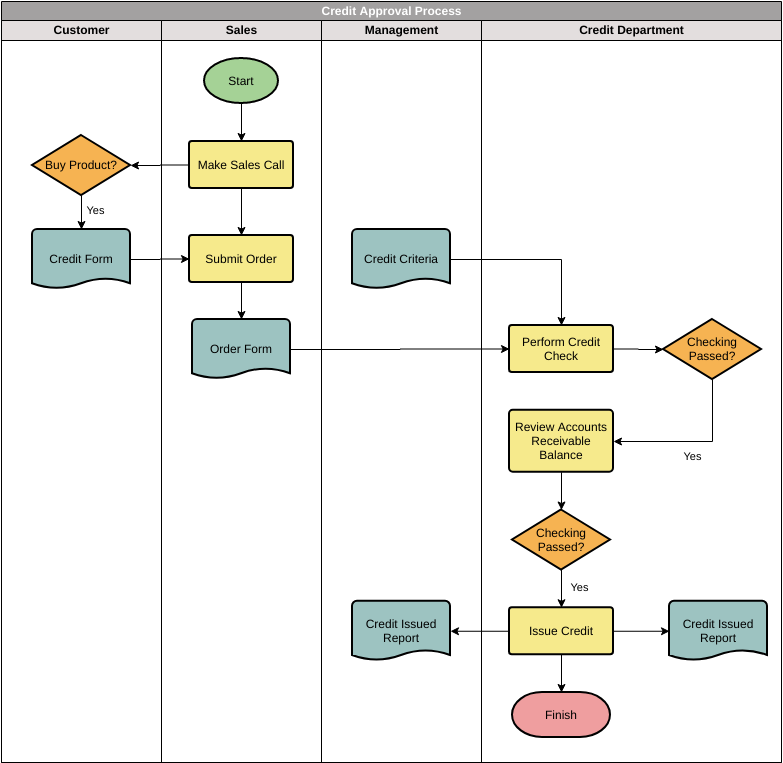
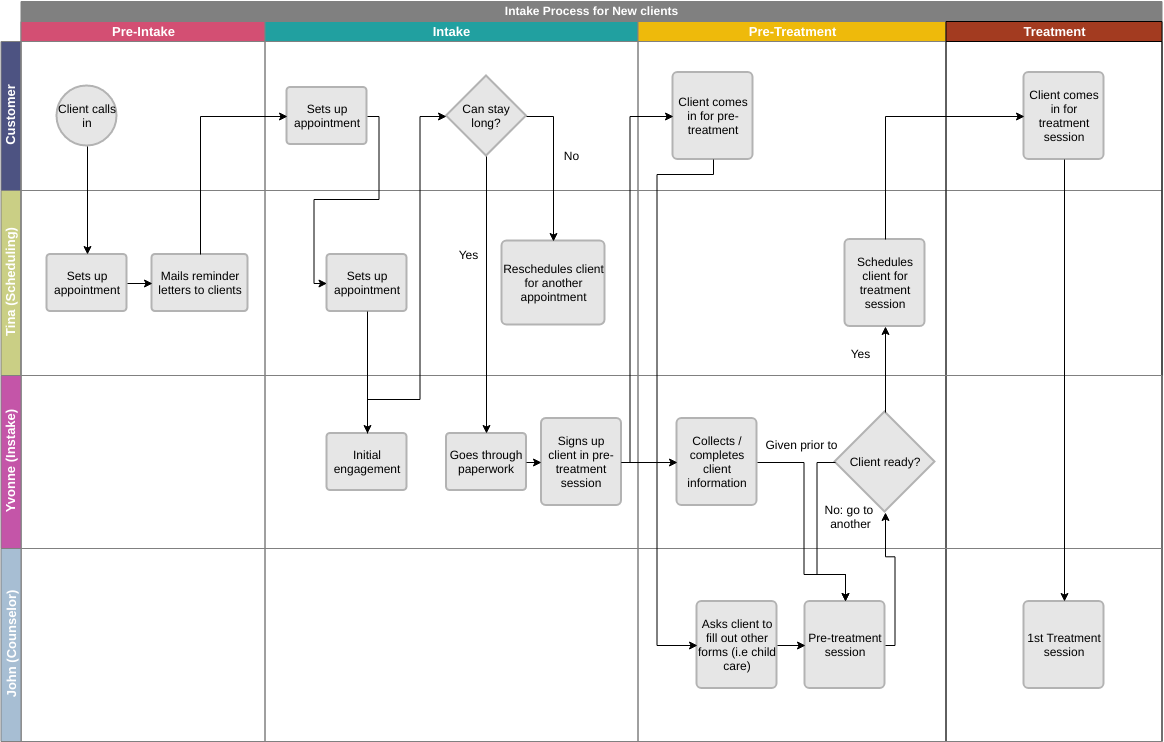
While the basic flowchart clearly illustrates the entire process, it does not clearly show which role is responsible for each step of the process. In order to effectively represent who is responsible for each process, it can be realized by swimlane flowchart, which not only reflects the whole activity control flow, but also clearly knows the responsibility that each role takes in the process.
Management business flow diagrams have basically been able to meet the expression of business process direction, but in complex system interactions, when expressing the concept of concurrency, the traditional management business flow diagrams have been unable to express, which requires the use of UML activity diagram or UML BPMN swimlane.
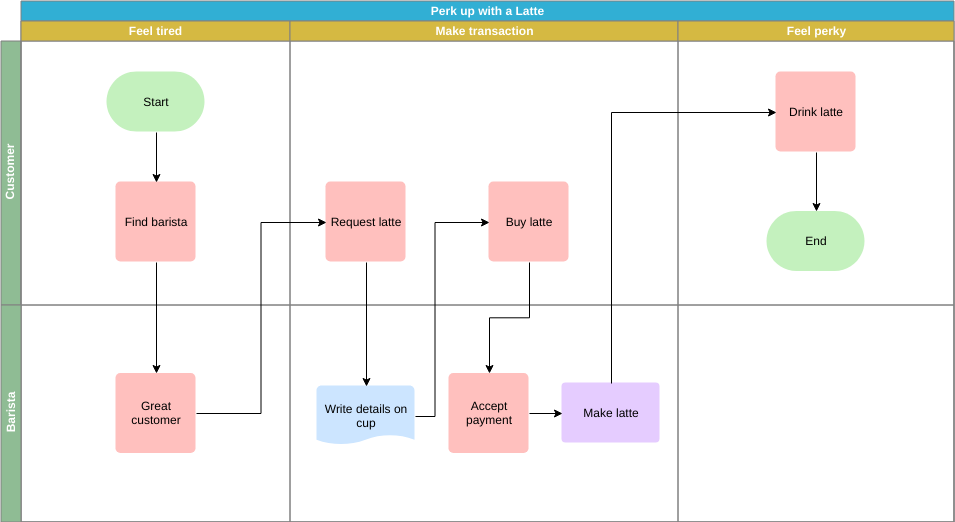
Edit this Cross Functional Flowchart Template
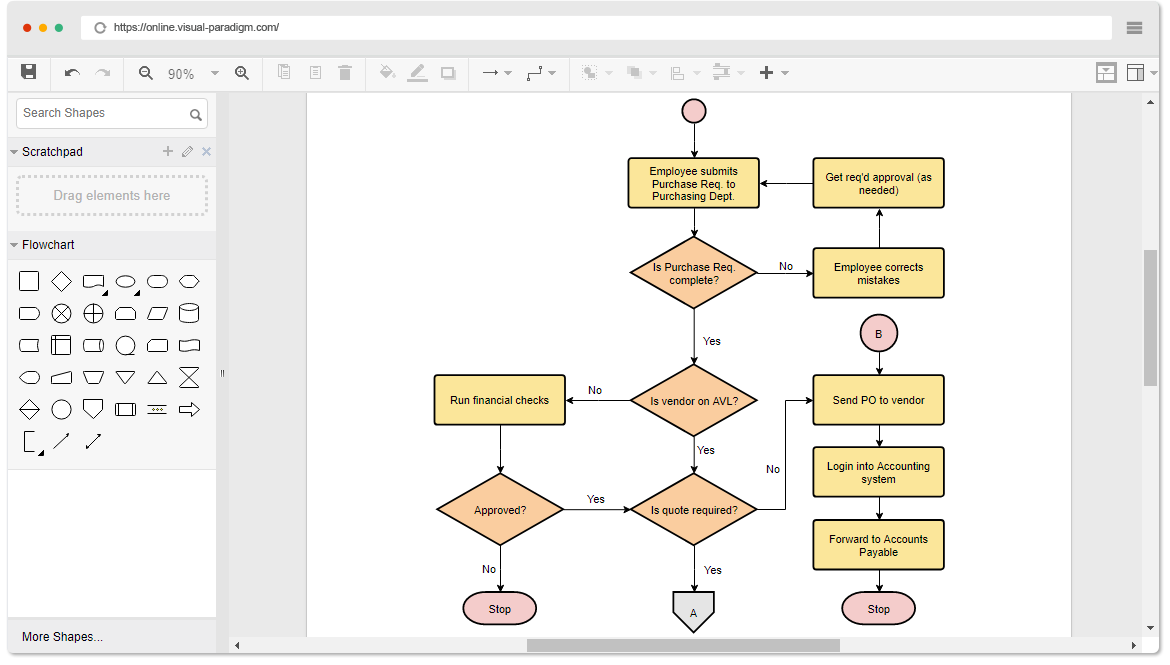
Finding a flowchart software?
Visual Paradigm Online features a simple flowcharting tool that allows you to create flowcharts in a flexible and easy way. As an all-in-one diagramming solution, VP Online also supports mind maps, organization charts, UML, ERD and floor plans. Try it out today. No registration required.
Learn More flowchart Examples:


")
")
")
")


")
")


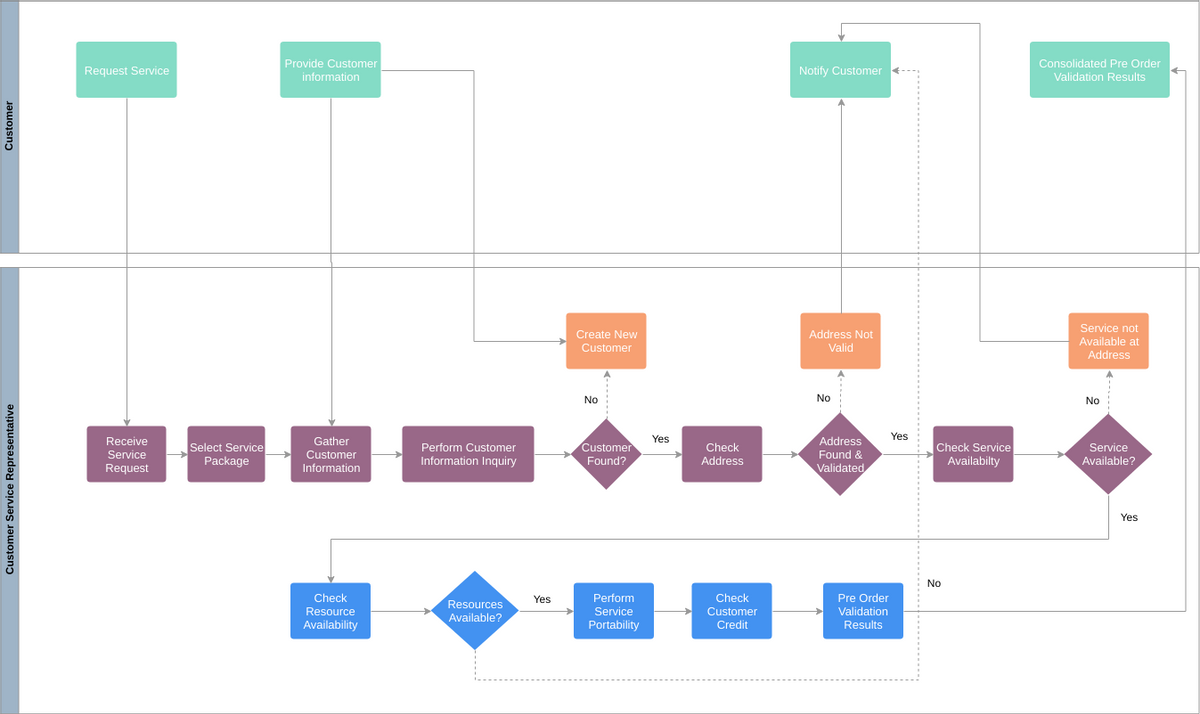
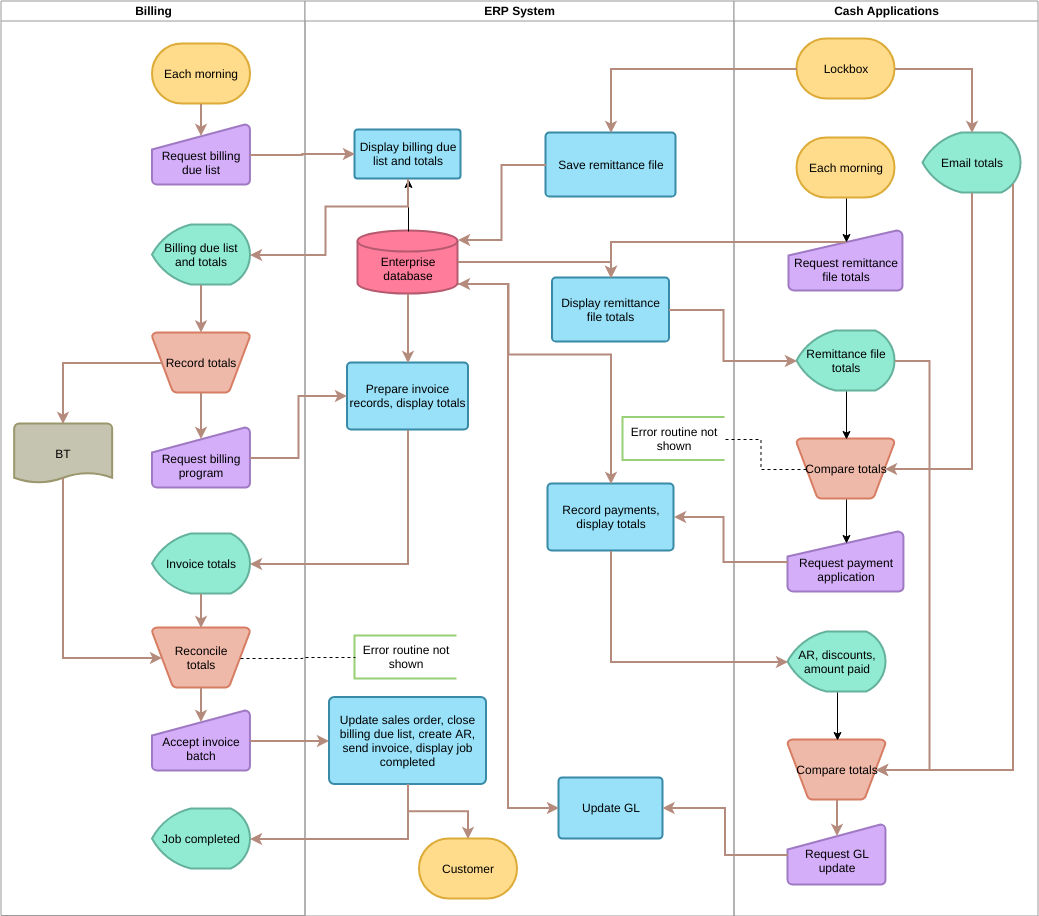
Cross-Functional Flowchart Examples:
This post is also available in Deutsch, Español, فارسی, Français, English, Bahasa Indonesia, 日本語, Polski, Portuguese, Ру́сский, Việt Nam, 简体中文 and 繁體中文.