UML क्या है? UML का अर्थ है एकीकृत मॉडल भाषा, जो 14 अलग-अलग प्रकार के UML आरेखों के समूह से
Continue reading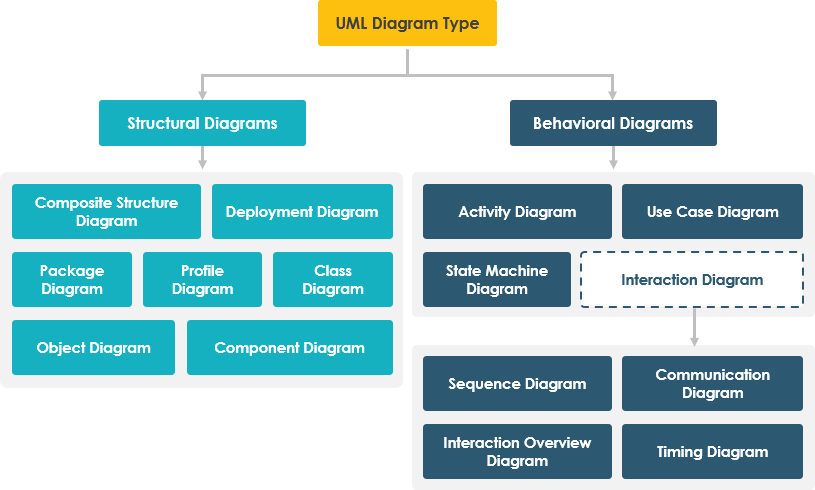
Learning one new thing everyday
UML क्या है? UML का अर्थ है एकीकृत मॉडल भाषा, जो 14 अलग-अलग प्रकार के UML आरेखों के समूह से
Continue reading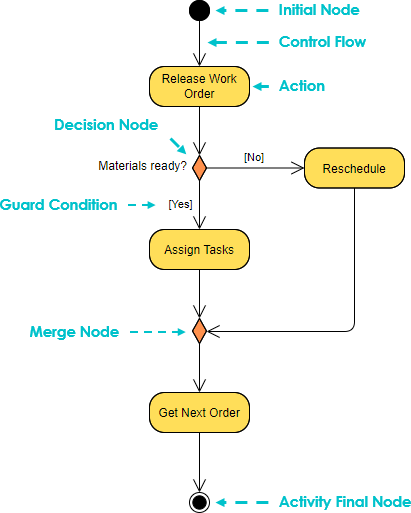
एक एक्टिविटी डायग्राम एक व्यापार वर्कफ्लो डायग्राम (या बीपीएमएन) या एक सरल फ्लोचार्ट के समान है, जिसमें अधिक सार्थकता होती
Continue reading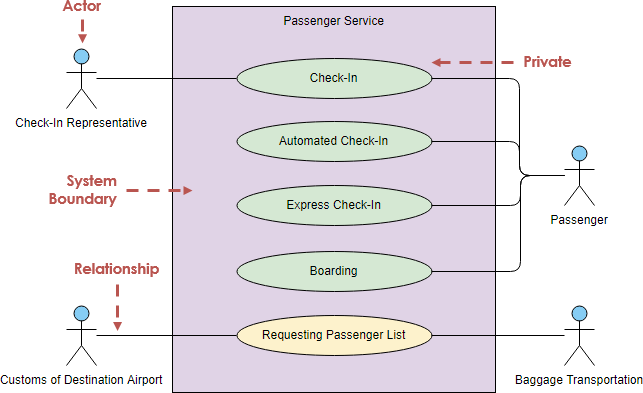
उपयोग केस क्या है? जब भी हम किसी प्रणाली की आवश्यकताओं के बारे में चर्चा करते हैं, तो हम इस
Continue reading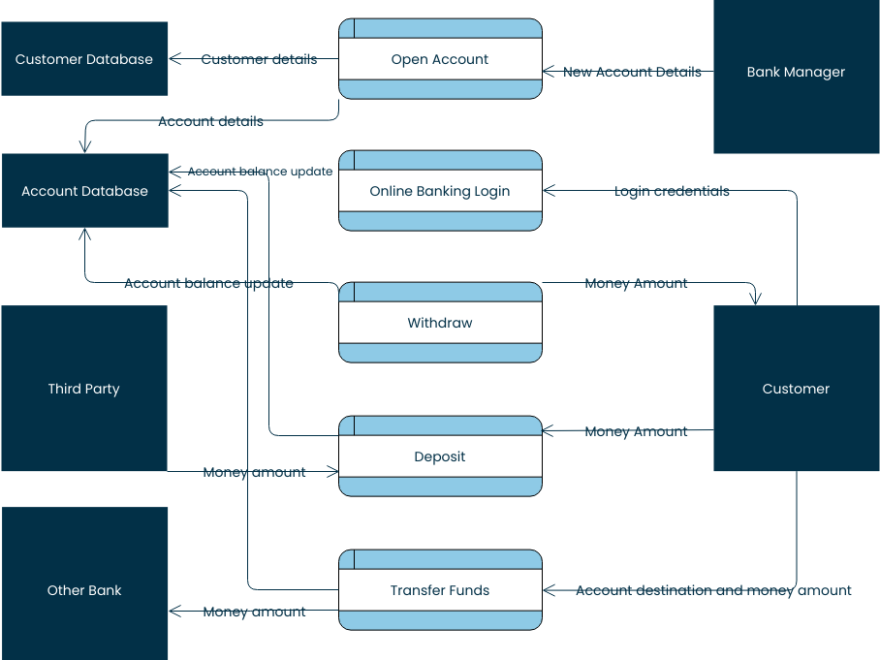
डेटा फ्लो डायग्राम क्या है? एक डेटा फ्लो डायग्रामएक सूचना प्रणाली में डेटा के प्रवाह का आरेखीय प्रतिनिधित्व है। इसमें
Continue reading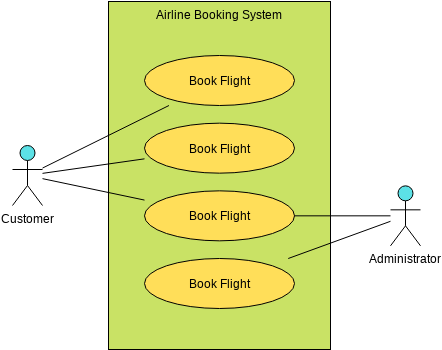
उपयोग केस मॉडलिंग आवश्यकताओं को एकत्र करने के लिए एक उपयोगी उपकरण है। यह सॉफ्टवेयर प्रणाली की आवश्यकताओं का एक
Continue reading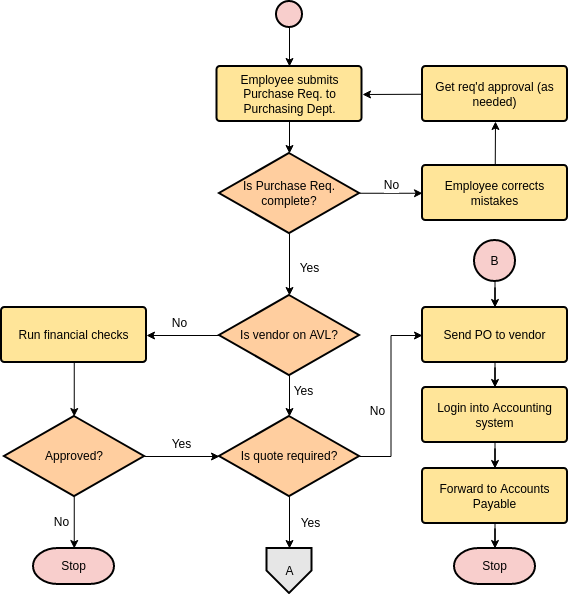
एक फ्लोचार्टएक ऐसा उपकरण है जो आपको किसी भी प्रक्रिया को व्यक्तिगत गतिविधियों में बांटने और उनके बीच तार्किक संबंध
Continue reading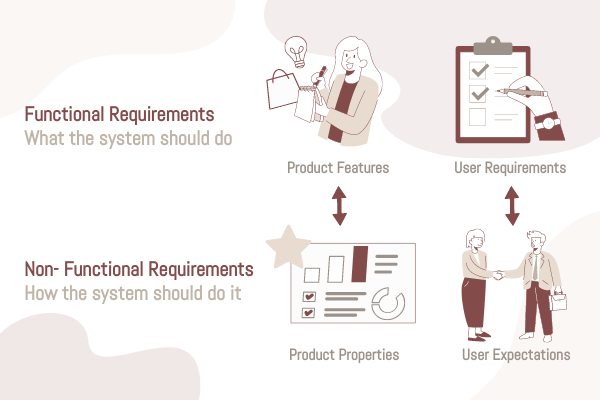
एक नए उत्पाद, सेवा, प्रक्रिया या प्रणाली को परिभाषित करने का पहला चरण आवश्यकताओं को परिभाषित करना है, अर्थात विशिष्ट
Continue reading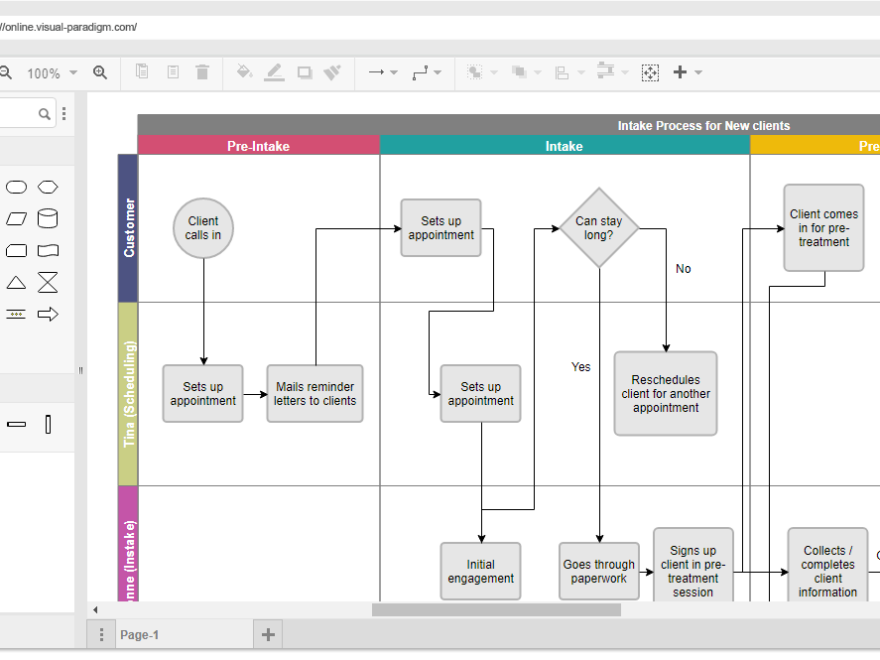
Cross-functional Flowcharts (or known as swimlane diagram, Swimlane flowchart, cross-functional process diagram) bring clarity to processes by defining who does what. Each swim lane is representative of a person, team, or stakeholder, making it evident who is responsible for which stage in the process to help avoid confusion.
Continue reading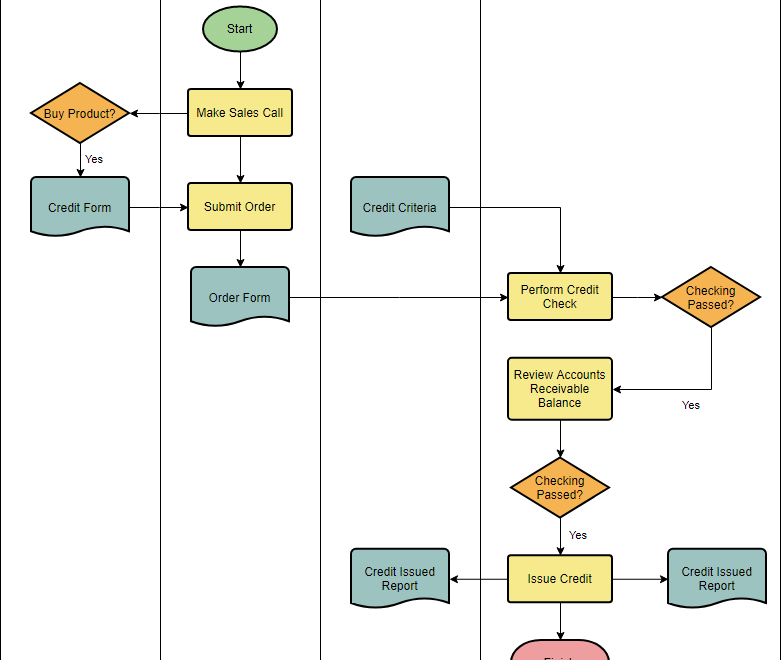
While the basic flowchart clearly illustrates the entire process, it does not clearly show which role is responsible for each step of the process. In order to effectively represent who is responsible for each process, it can be realized by swimlane flowchart, which not only reflects the whole activity control flow, but also clearly knows the responsibility that each role takes in the process.
Continue reading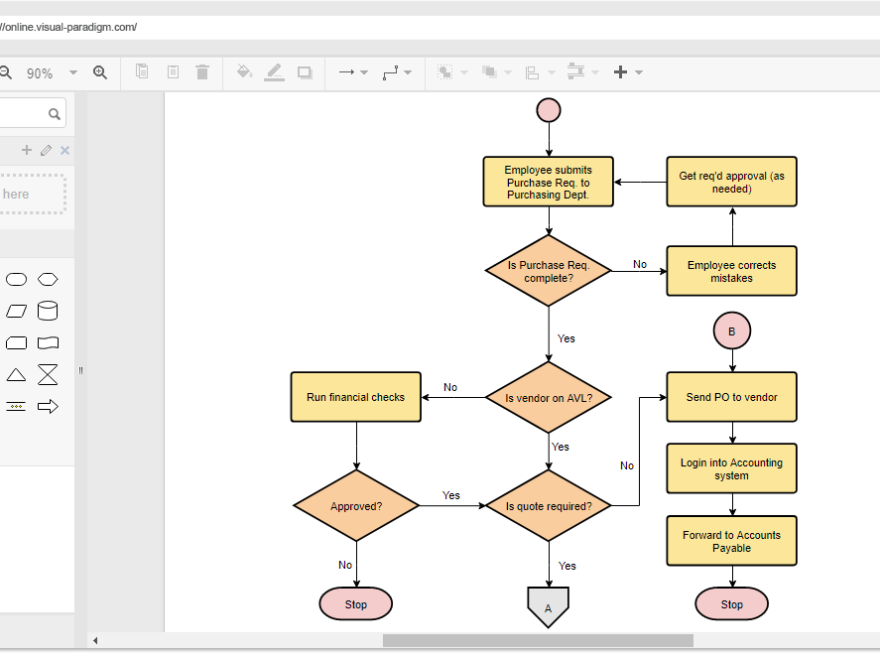
A flowchart is a graphical representation of the operations involved in a data processing system. operations in the system. Often, the best way to understand a problem is to draw a diagram. Diagrams usually give us a more complete picture of a situation than a short set of words or phrases. However, the combination of visual symbols )(shapes) and text provides a very powerful tool for communication and problem solving. Algorithms can be developed more quickly when a flowchart is created to represent them. Flowcharts are much easier to understand than algorithms.
Continue reading