


—— Best Practices Sharing with Visual Paradigm AI Chatbot + VPasCode
Hi everyone, I’m Angus. As a Product Manager with over 7 years of experience, I know how critical clear communication is. Recently, while exploring the “Diagram as Code” (DaC) workflow, I deeply evaluated the combination of Mermaid with Visual Paradigm (VP) AI Chatbot and VPasCode.
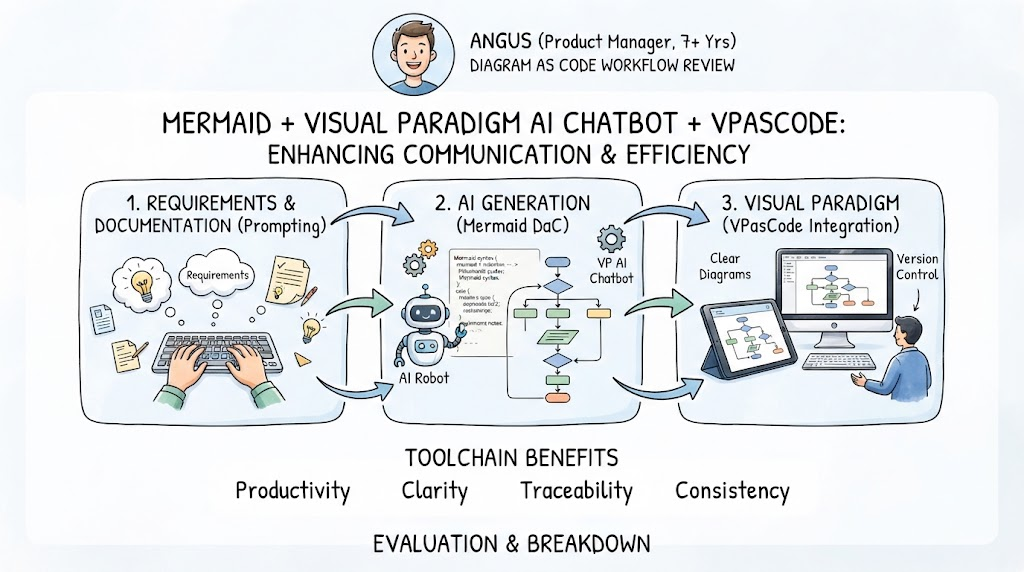
Today, I want to share a product review and functional breakdown of this toolchain, covering its core value, key concepts, and practical use cases. My goal is to help you improve efficiency in documentation, requirement sorting out, and technical communication.
1. Background & Pain Points: Why do we need “Diagram as Code”?
In traditional product work, we often use GUI tools like Visio, Lucidchart, or XMind. While intuitive, they have several obvious pain points:
-
Difficult Version Control: Binary files cannot be Git-diffed, making it hard to track change history.
-
High Collaboration Cost: Team members need specific software installed to view or edit diagrams.
-
Maintenance Lag: Code changes, but diagrams don’t, leading to documentation that is out of sync with the actual system.
“Diagram as Code” (DaC) was born to solve these problems. By defining diagrams as text code, it brings the following core values:
-
✅ Version Control Friendly: Manage diagrams like code, supporting Branch/Merge.
-
✅ Automation Ready: Can be integrated into CI/CD pipelines to automatically generate the latest architecture diagrams.
-
✅ Consistency Guaranteed: Ensures uniform output style across the team through templates and code standards.
-
✅ Reproducibility: Diagrams can be rebuilt anytime as long as the source file exists.
2. Product Overview: What is Mermaid?
Mermaid is a JavaScript-based diagramming library that uses Markdown-like text syntax to dynamically generate diagrams.
💡 Why Choose Mermaid?
-
Low Barrier to Entry: Simple syntax, highly human-readable.
-
Wide Ecosystem: Native support for GitHub, GitLab, Notion, VS Code, and other mainstream platforms.
-
Real-time Rendering: Instant preview upon code modification, providing a short feedback loop.
-
Highly Extensible: Supports custom themes and styles.
3. Key Feature Analysis: Core Concepts of Mermaid
When using Mermaid, several core concepts form its “product logic”:
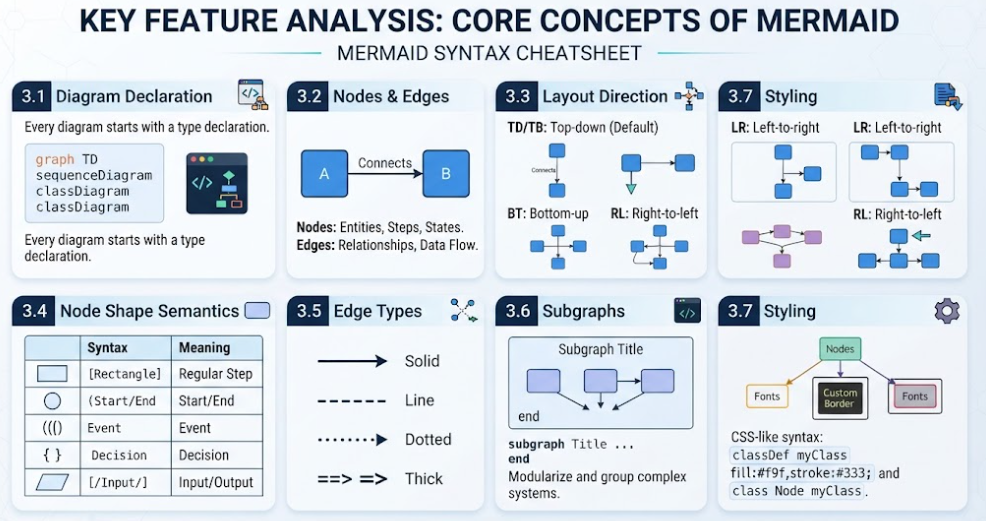
3.1 Diagram Declaration
Every diagram must start with a type declaration, such as graph TD. This is equivalent to defining the product’s “mode.”
3.2 Nodes & Edges
-
Nodes: Represent entities, process steps, or states.
-
Edges: Define relationships and data flow between nodes.
3.3 Layout Direction
Controls visual flow to adapt to different reading habits:
-
TD/TB: Top-down (default, suitable for flowcharts) -
LR: Left-to-right (suitable for timelines or sequences) -
BT/RL: Bottom-up / Right-to-left
3.4 Node Shape Semantics
Different shapes convey different business meanings:
-
[ ]: Rectangle (regular step) -
( ): Rounded rectangle (start/end) -
(( )): Circle (event) -
{ }: Rhombus (decision point) -
[/ /]: Parallelogram (input/output)
3.5 Edge Types
-
-->: Solid arrow -
---: Line without arrow -
-.->: Dotted arrow (usually indicates async or optional) -
==>: Thick arrow (emphasizes main path)
3.6 Subgraphs
Used to modularize and group complex systems, improving readability and logical hierarchy.
3.7 Styling
Supports CSS-like syntax, allowing customization of colors, borders, and fonts to meet brand guidelines.
4. Environment Setup & Integration: The Advantage of the Visual Paradigm Ecosystem
While Mermaid can be used in any text editor, combining it with the Visual Paradigm (VP) toolchain significantly enhances the experience.
🛠️ Recommended Tool Combination: Visual Paradigm AI Chatbot + VPasCode
Visual Paradigm provides powerful enterprise-grade support, while the VPasCode plugin serves as the bridge between the GUI and code.
5. Getting Started: Basic Syntax
Let’s look at a simple flowchart example to understand its “code structure”:
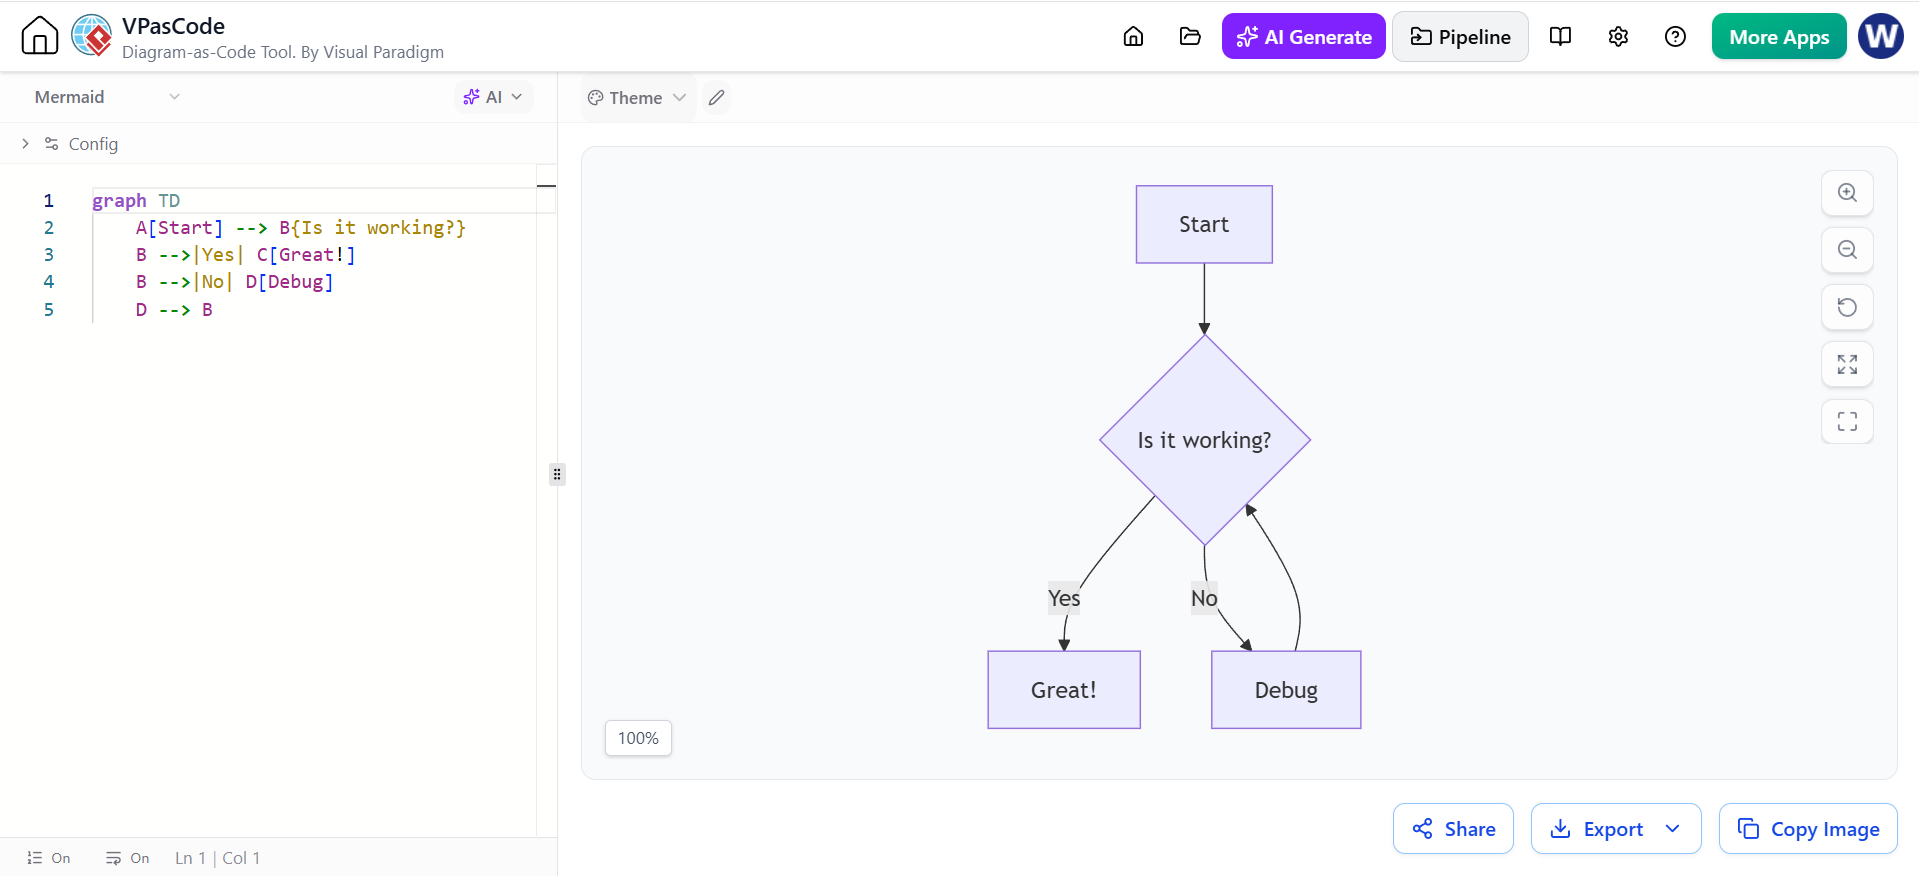
graph TD
    A[Start] --> B{Is it working?}
    B -->|Yes| C[Great!]
    B -->|No| D[Debug]
    D --> B
Code Breakdown:
-
graph TD: Defines a top-down flowchart. -
A[Start]: Node with ID ‘A’, displaying text “Start”. -
-->: Defines the flow direction. -
B{...}: Diamond node, representing a decision. -
|Yes|: Label on the connecting line.
6. Scenario-Based Use Cases: Common Diagram Types
As PMs, we frequently need to draw different types of diagrams. Here are high-frequency application scenarios for Mermaid:
6.1 Flowchart
Use Case: User login, order processing flows
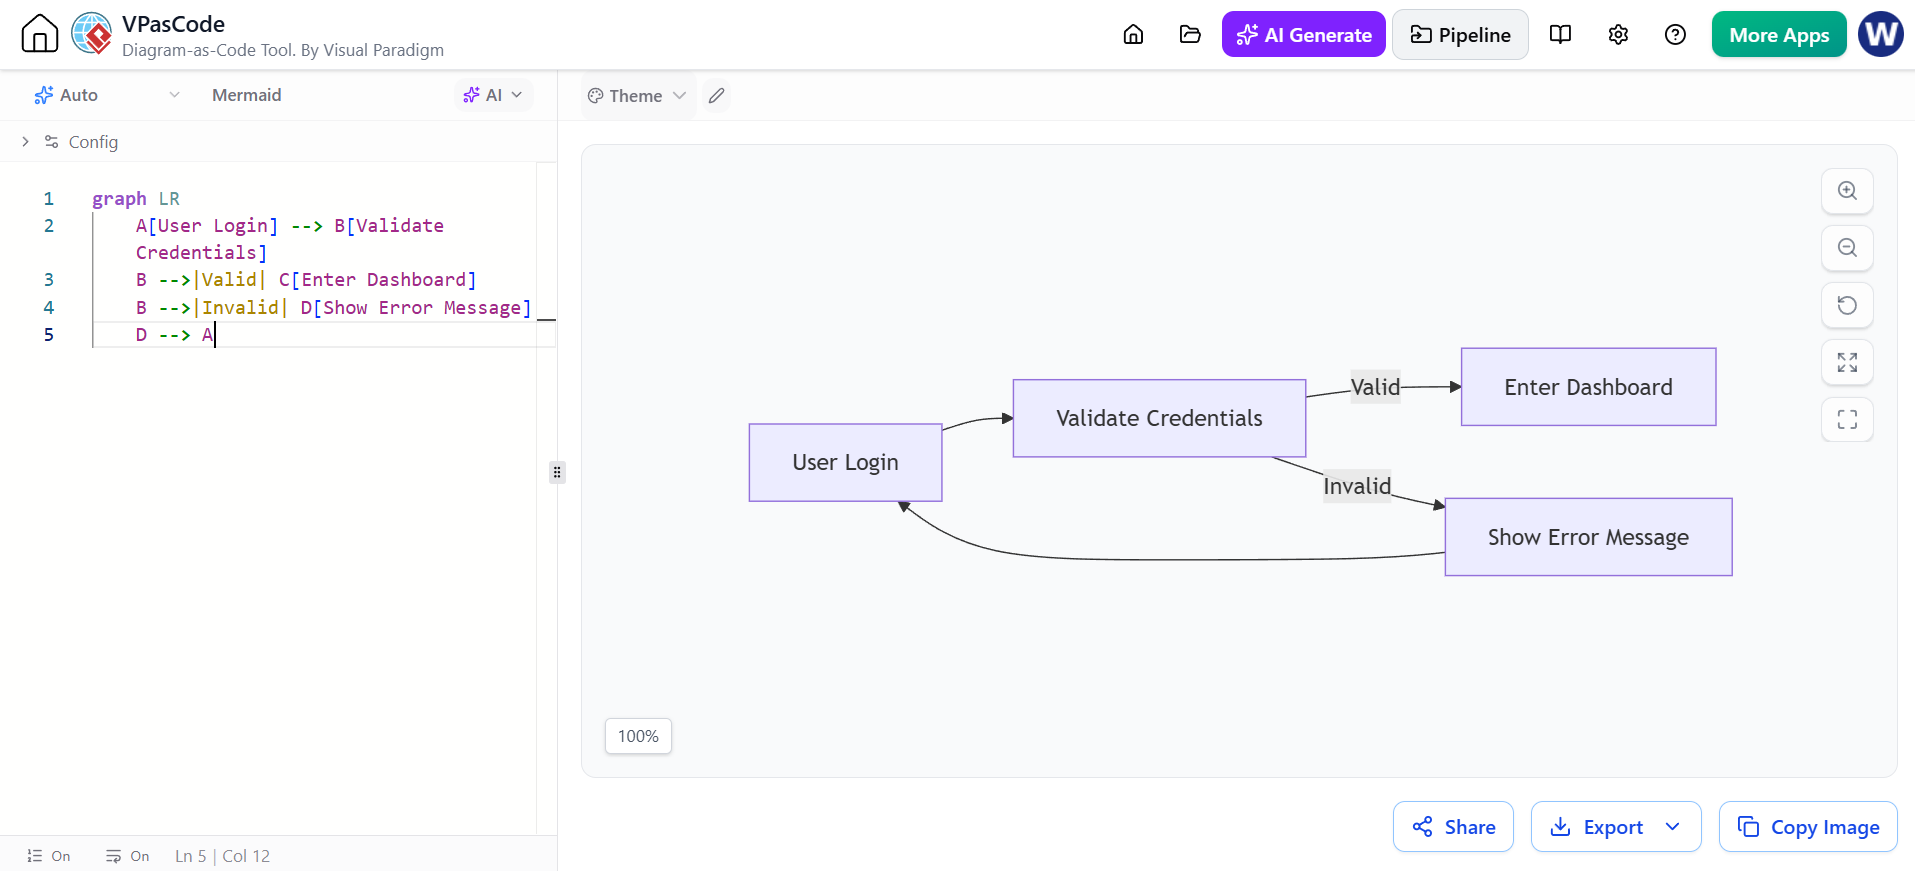
graph LR
    A[User Login] --> B[Validate Credentials]
    B -->|Valid| C[Enter Dashboard]
    B -->|Invalid| D[Show Error Message]
    D --> A
6.2 Sequence Diagram
Use Case: API interactions, microservice calls
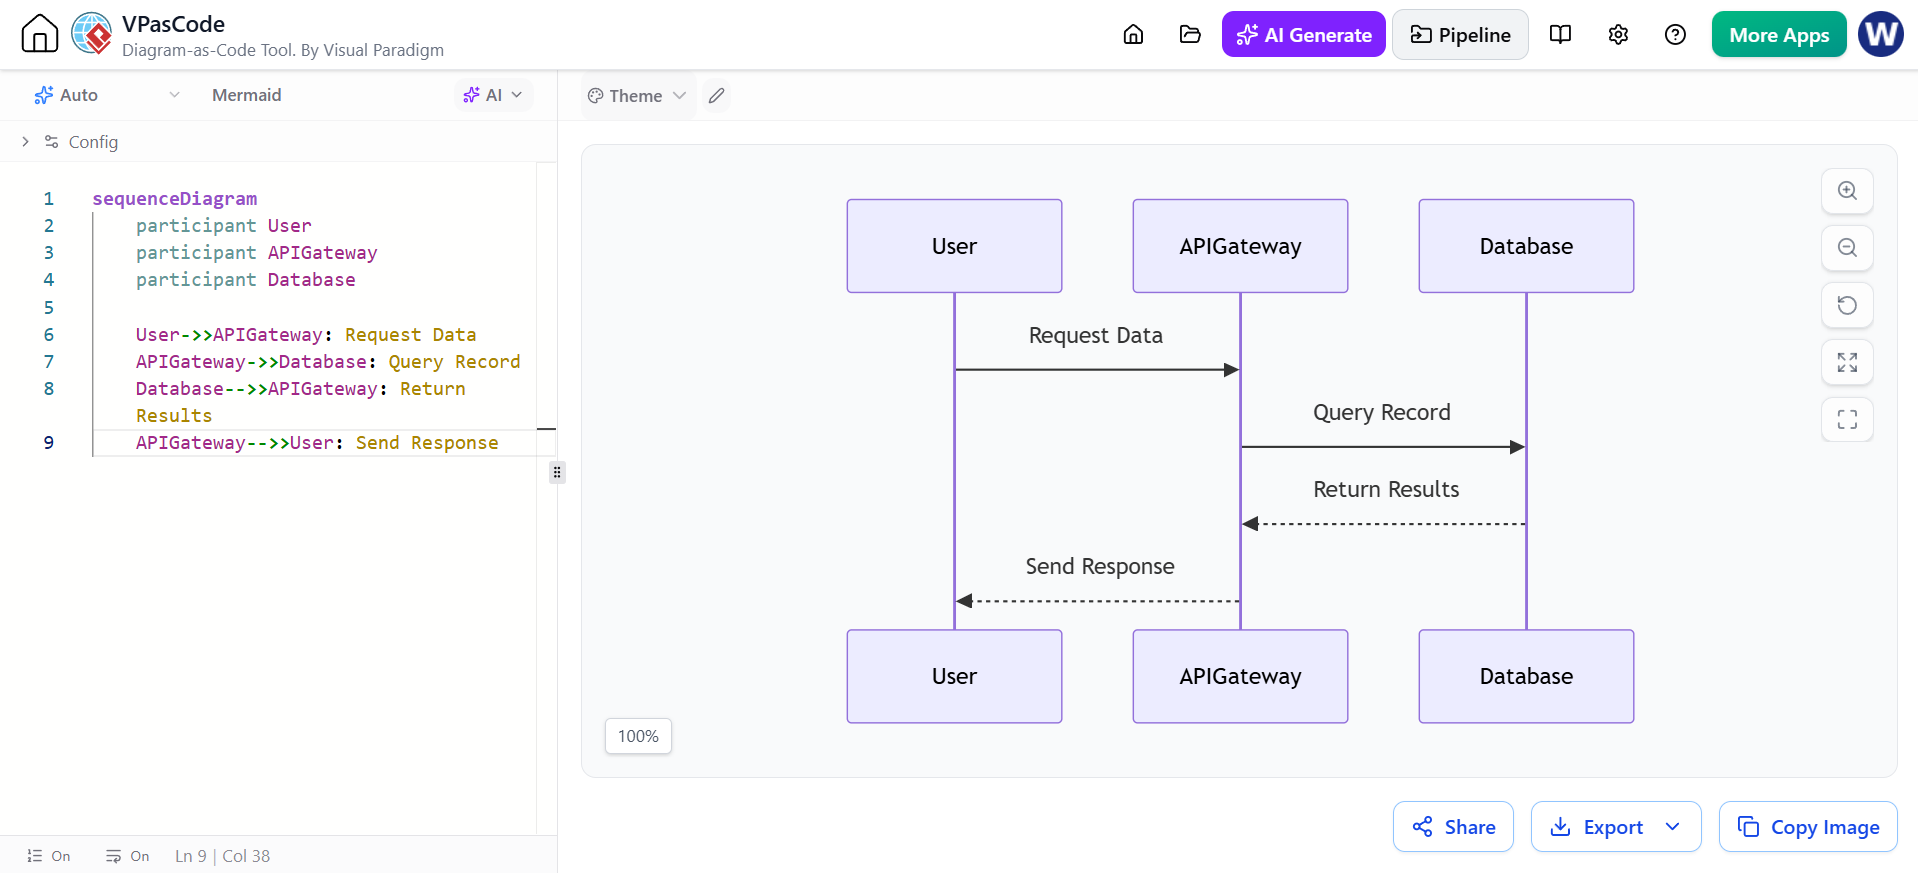
sequenceDiagram
    participant User
    participant APIGateway
    participant Database

    User->>APIGateway: Request Data
    APIGateway->>Database: Query Record
    Database-->>APIGateway: Return Results
    APIGateway-->>User: Send Response
6.3 Class Diagram
Use Case: Domain model design, object relationship sorting
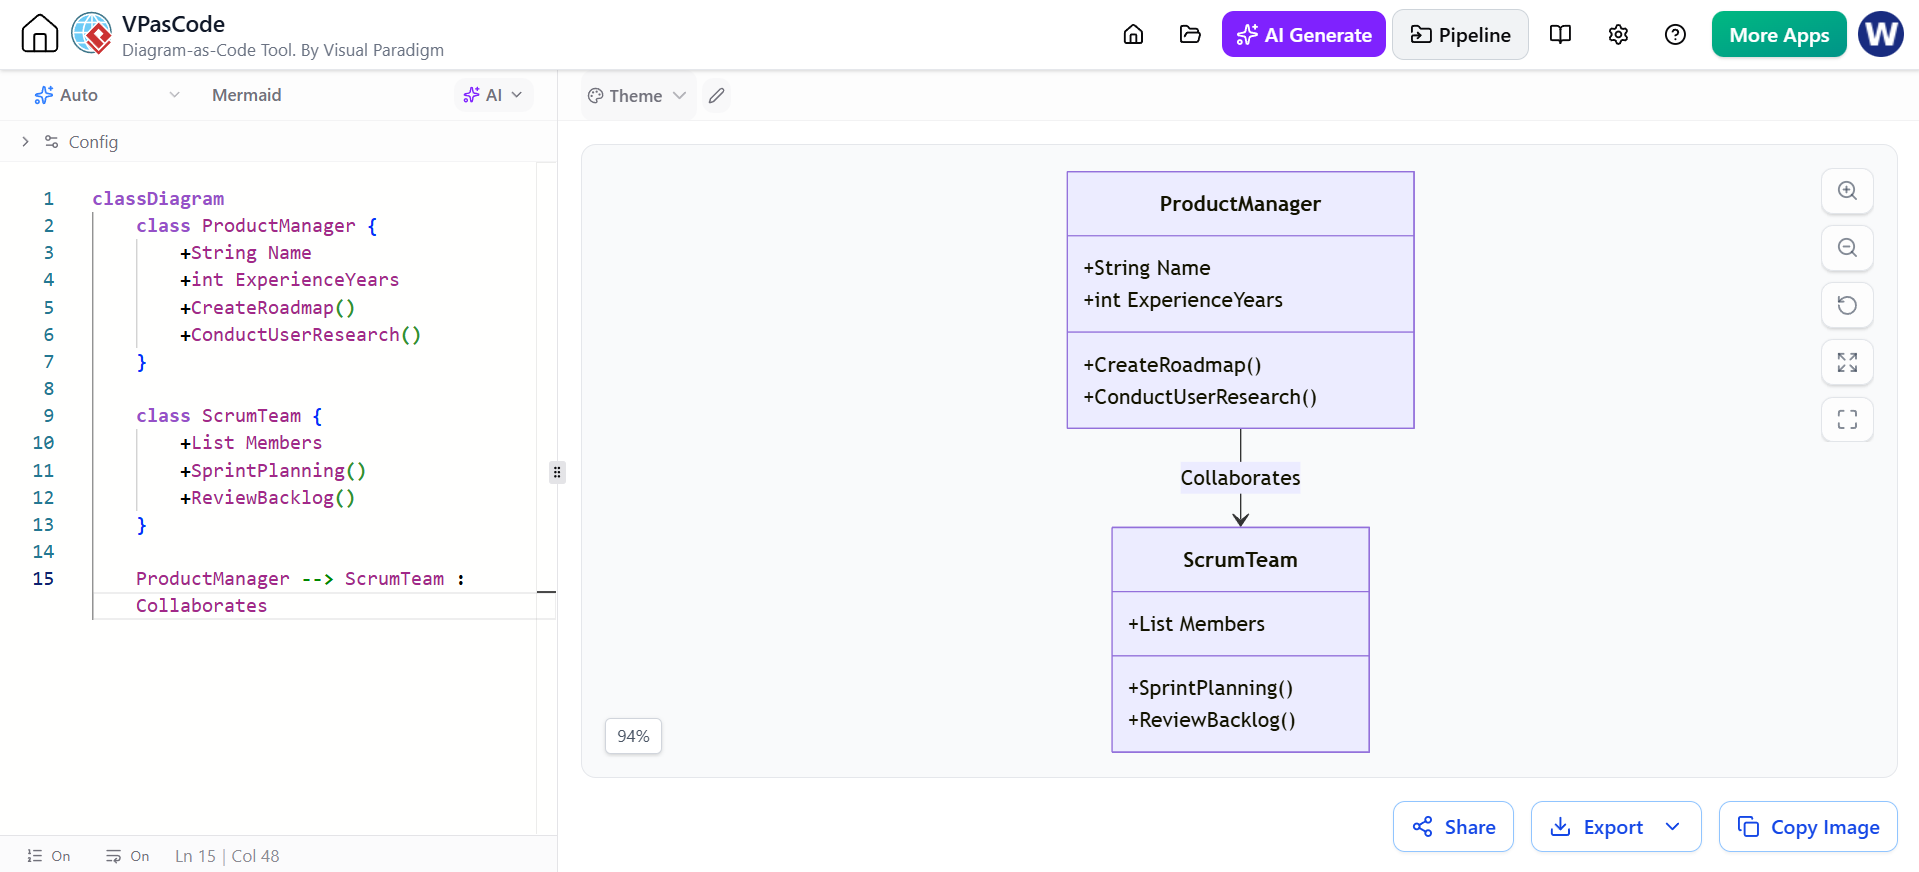
classDiagram
    class ProductManager {
        +String Name
        +int ExperienceYears
        +CreateRoadmap()
        +ConductUserResearch()
    }

    class ScrumTeam {
        +List Members
        +SprintPlanning()
        +ReviewBacklog()
    }

    ProductManager --> ScrumTeam : Collaborates
6.4 State Diagram
Use Case: Order status transitions, approval workflows
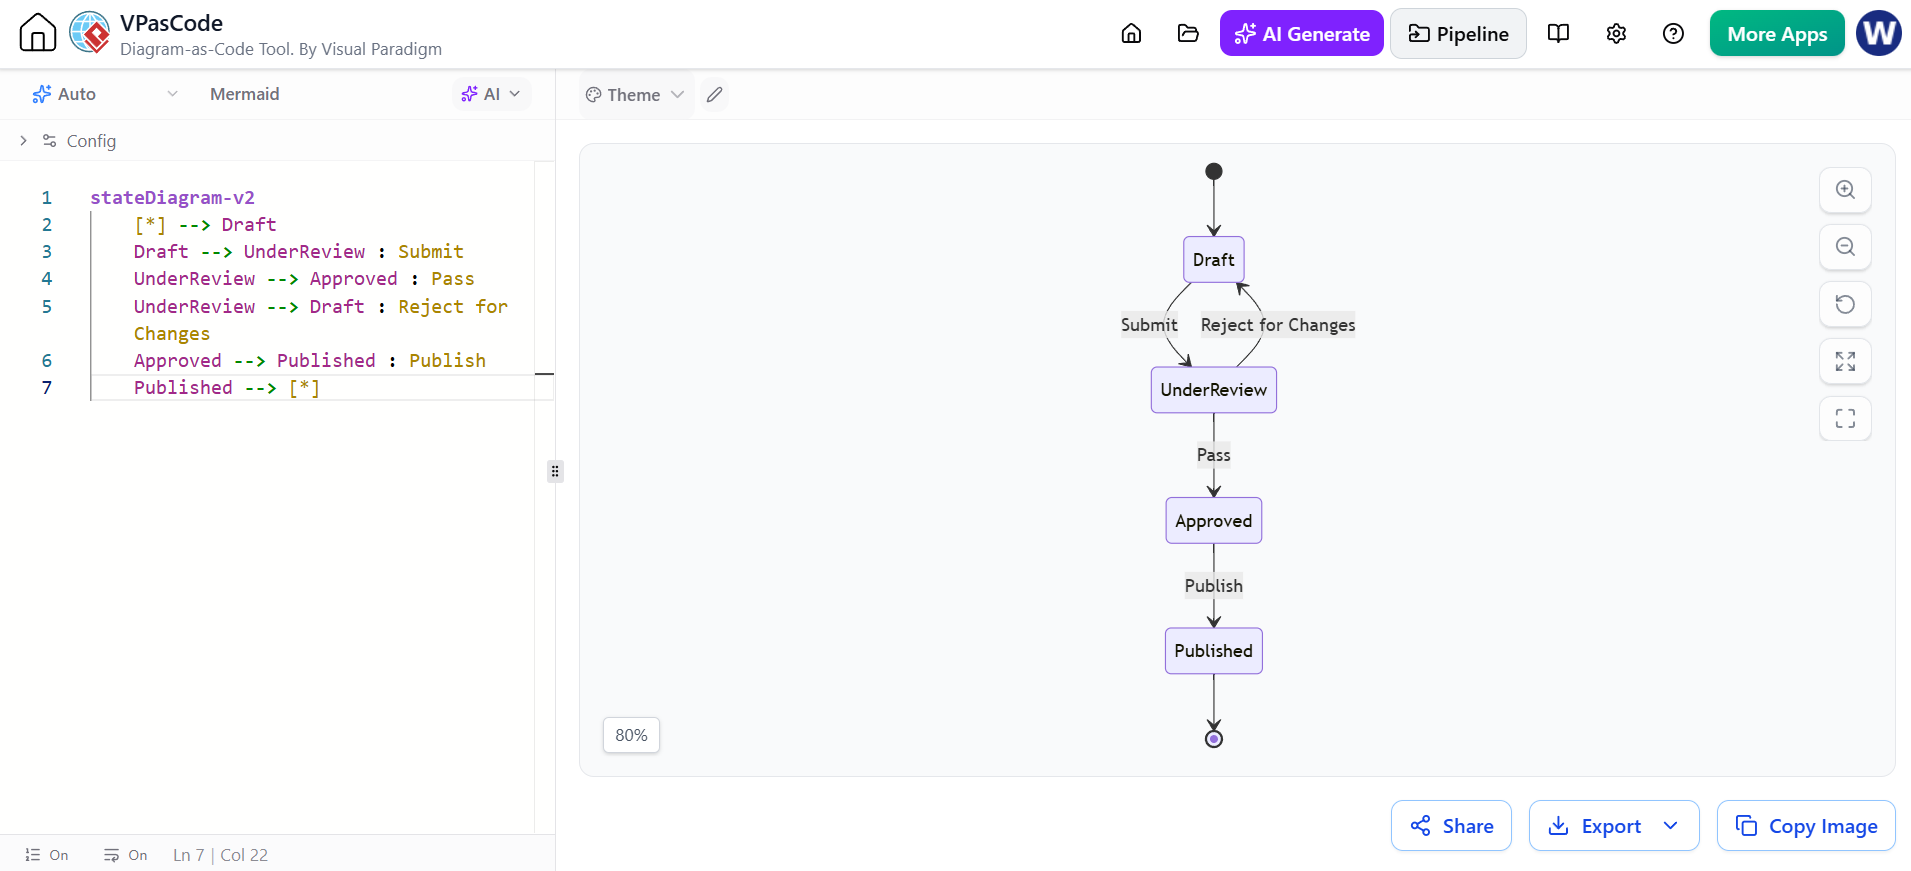
stateDiagram-v2
    [*] --> Draft
    Draft --> UnderReview : Submit
    UnderReview --> Approved : Pass
    UnderReview --> Draft : Reject for Changes
    Approved --> Published : Publish
    Published --> [*]
6.5 Entity Relationship Diagram (ERD)
Use Case: Database design, data modeling
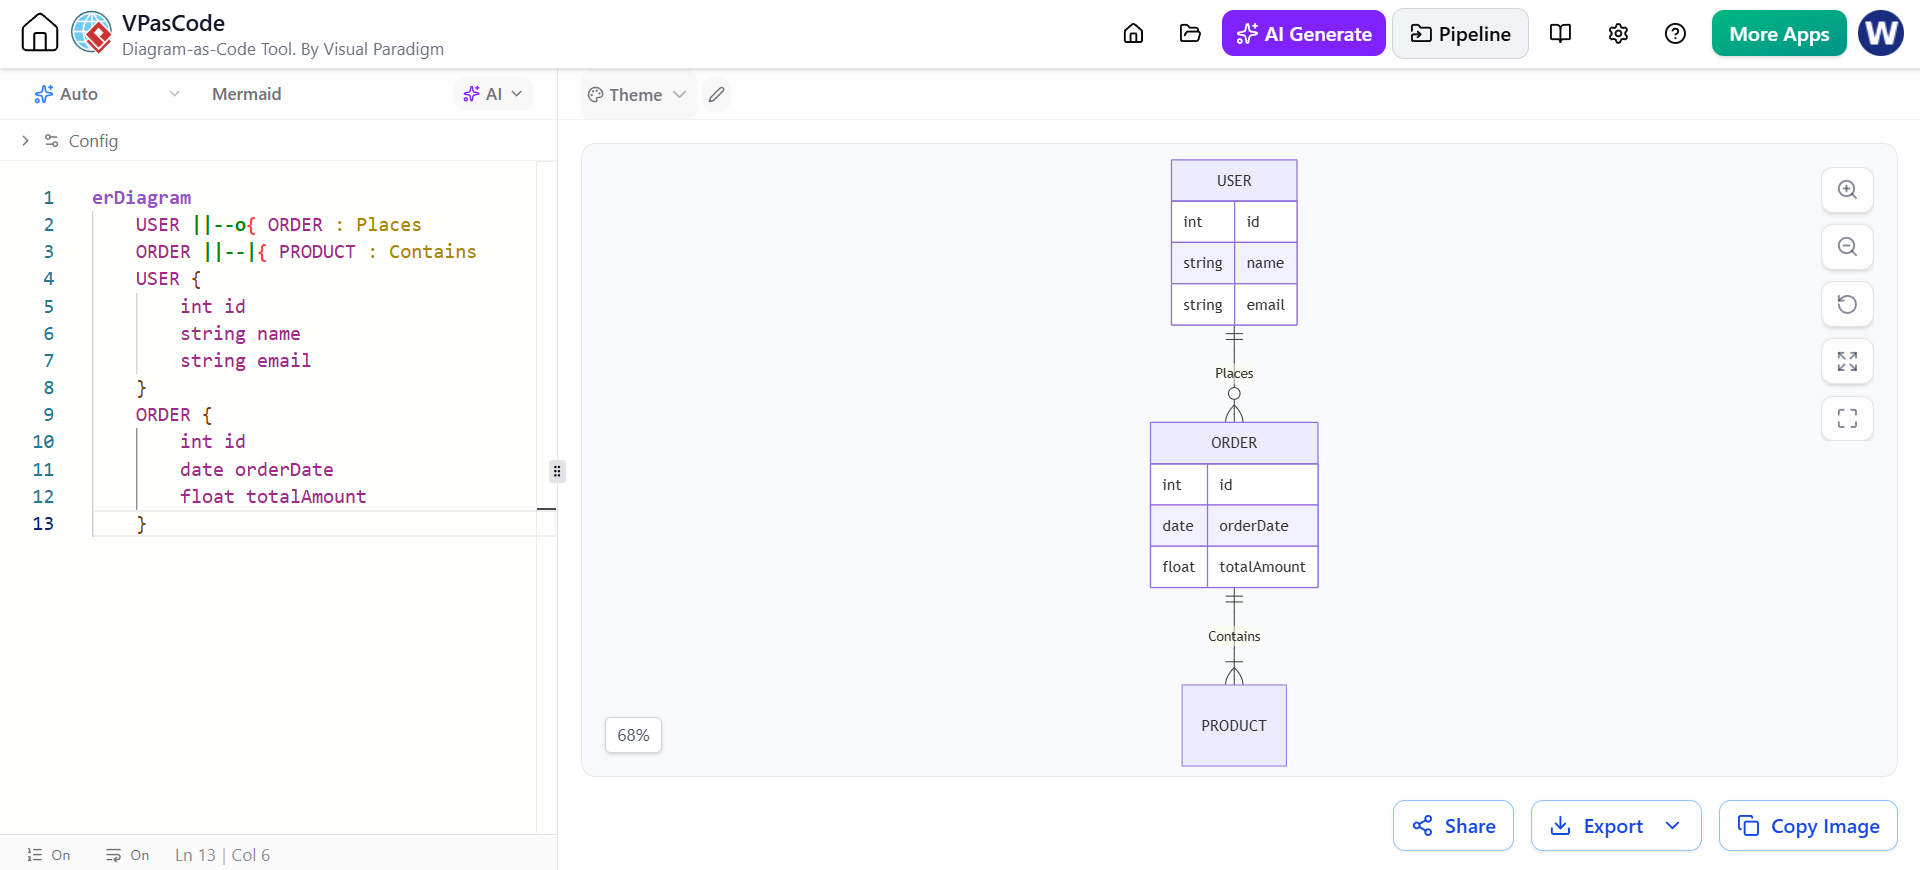
erDiagram
    USER ||--o{ ORDER : Places
    ORDER ||--|{ PRODUCT : Contains
    USER {
        int id
        string name
        string email
    }
    ORDER {
        int id
        date orderDate
        float totalAmount
    }
6.6 Gantt Chart
Use Case: Project scheduling, Roadmap display
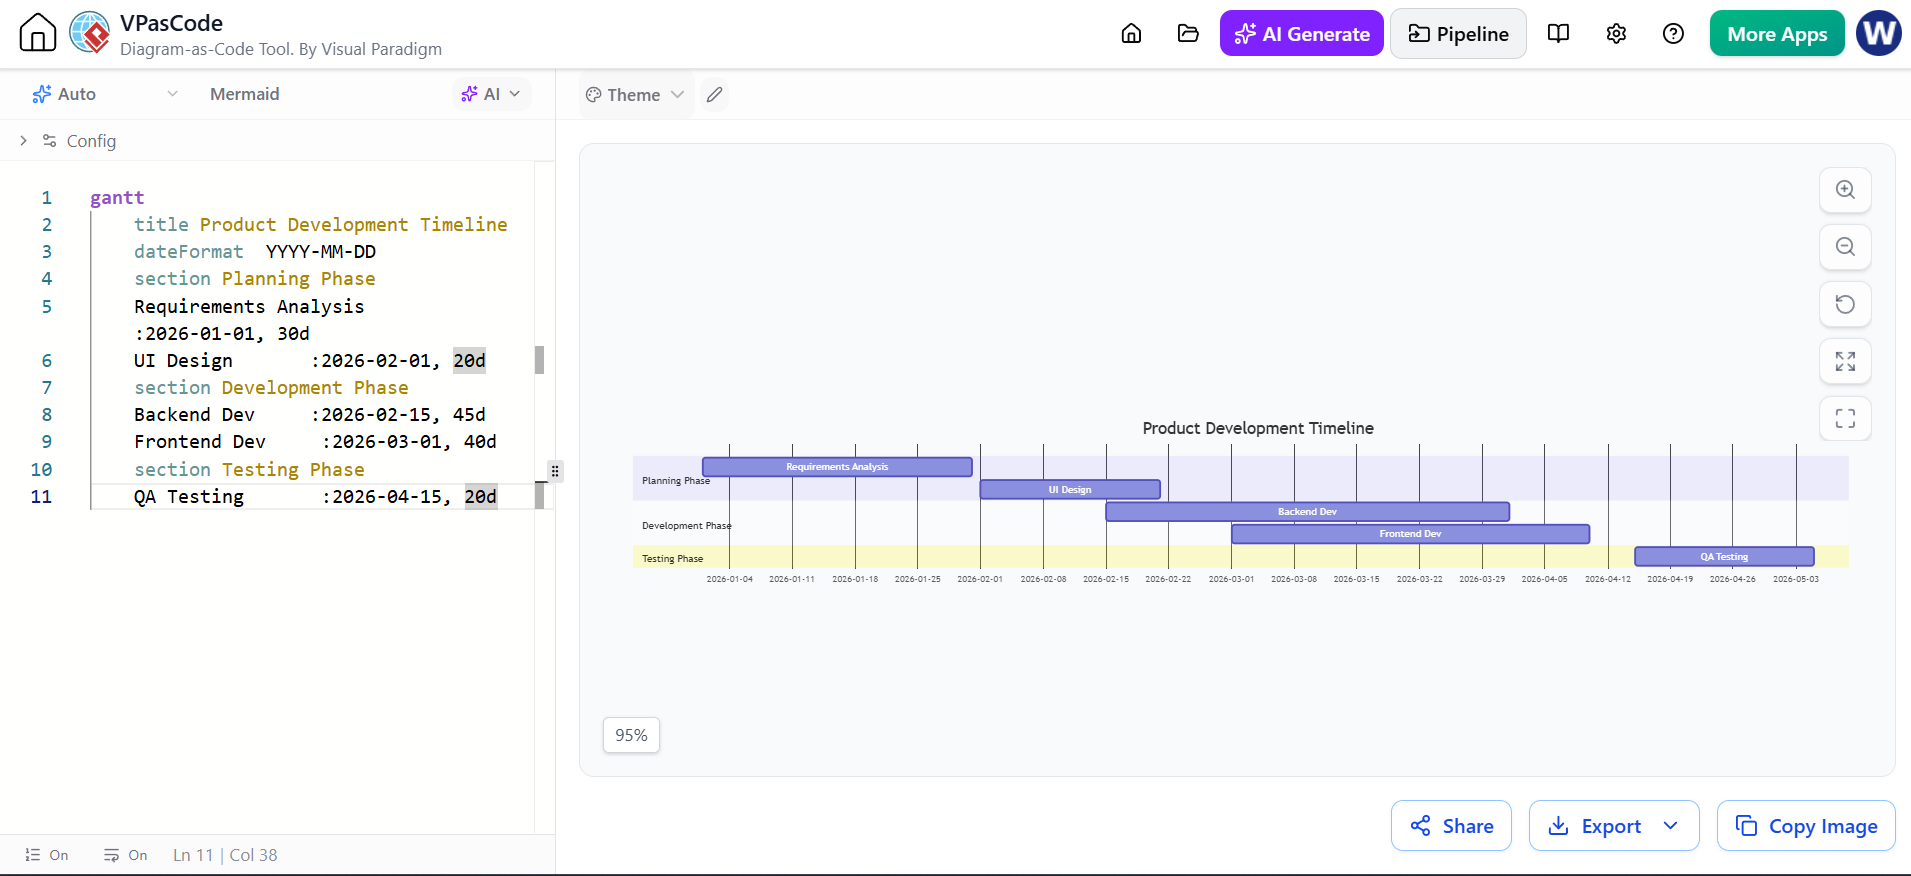
gantt
    title Product Development Timeline
    dateFormat  YYYY-MM-DD
    section Planning Phase
    Requirements Analysis     :2026-01-01, 30d
    UI Design       :2026-02-01, 20d
    section Development Phase
    Backend Dev     :2026-02-15, 45d
    Frontend Dev     :2026-03-01, 40d
    section Testing Phase
    QA Testing       :2026-04-15, 20d
6.7 Pie Chart
Use Case: Resource allocation, time distribution analysis
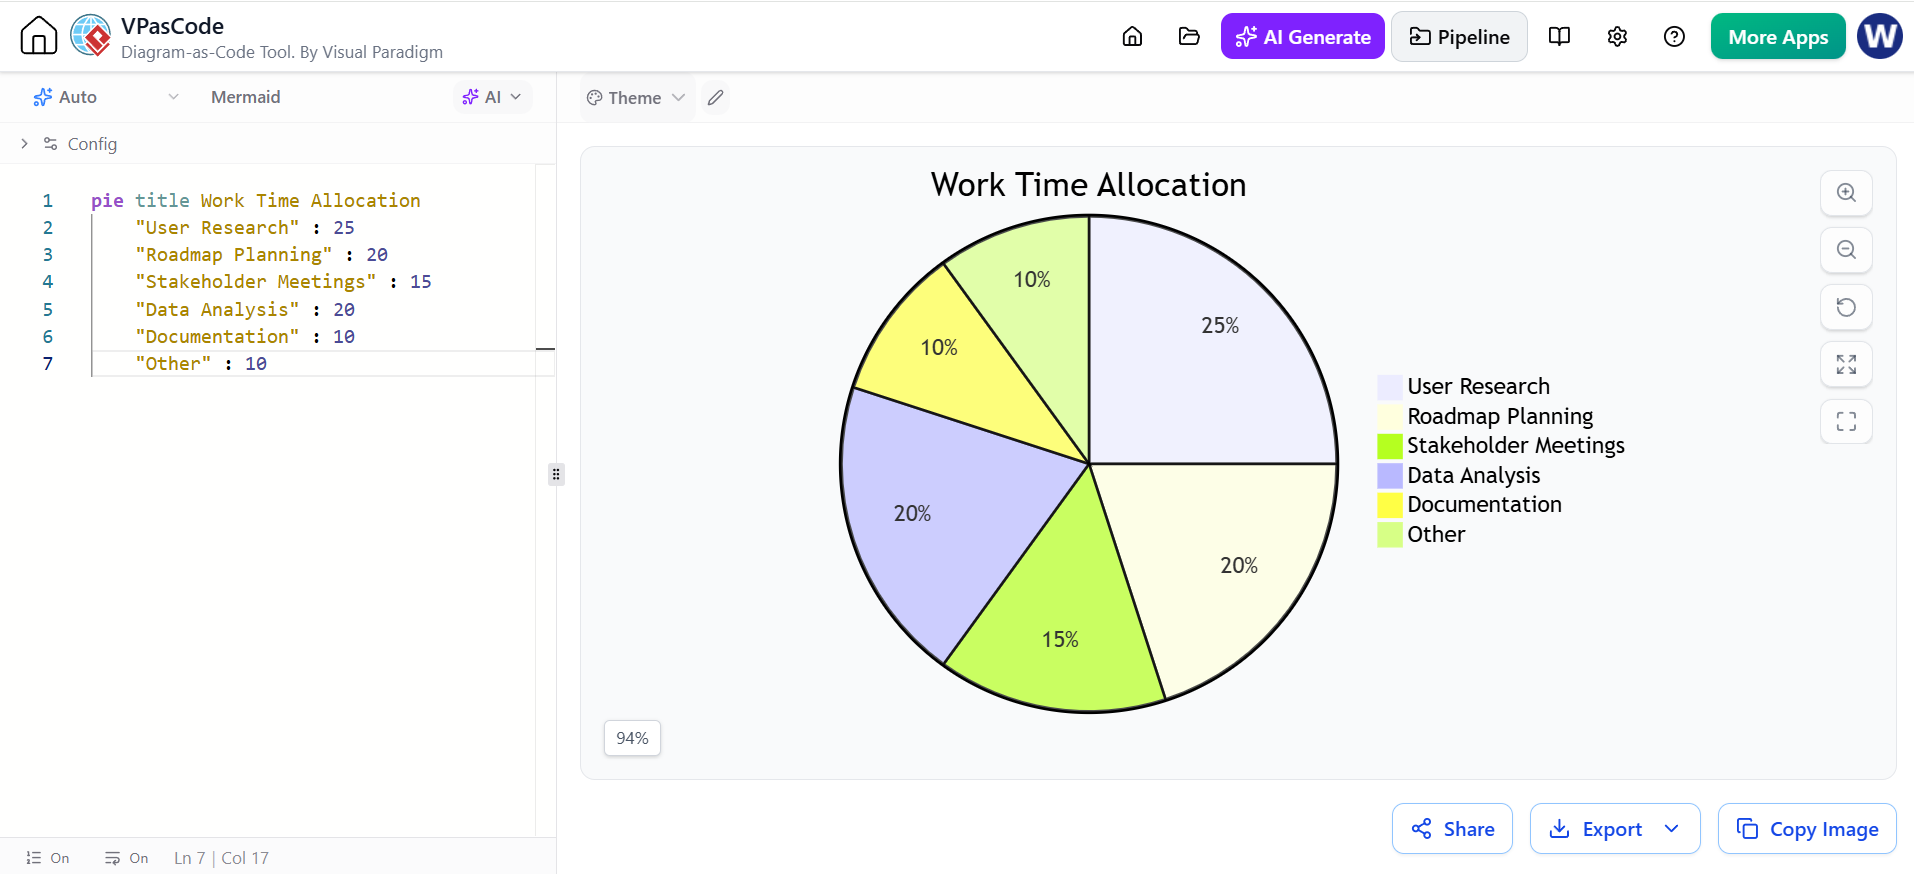
pie title Work Time Allocation
    "User Research" : 25
    "Roadmap Planning" : 20
    "Stakeholder Meetings" : 15
    "Data Analysis" : 20
    "Documentation" : 10
    "Other" : 10
7. Advanced Feature Review: Styling, Subgraphs, and Interaction
7.1 Subgraphs – Modular Thinking
When systems are complex, use subgraphs to break large diagrams into logical blocks.
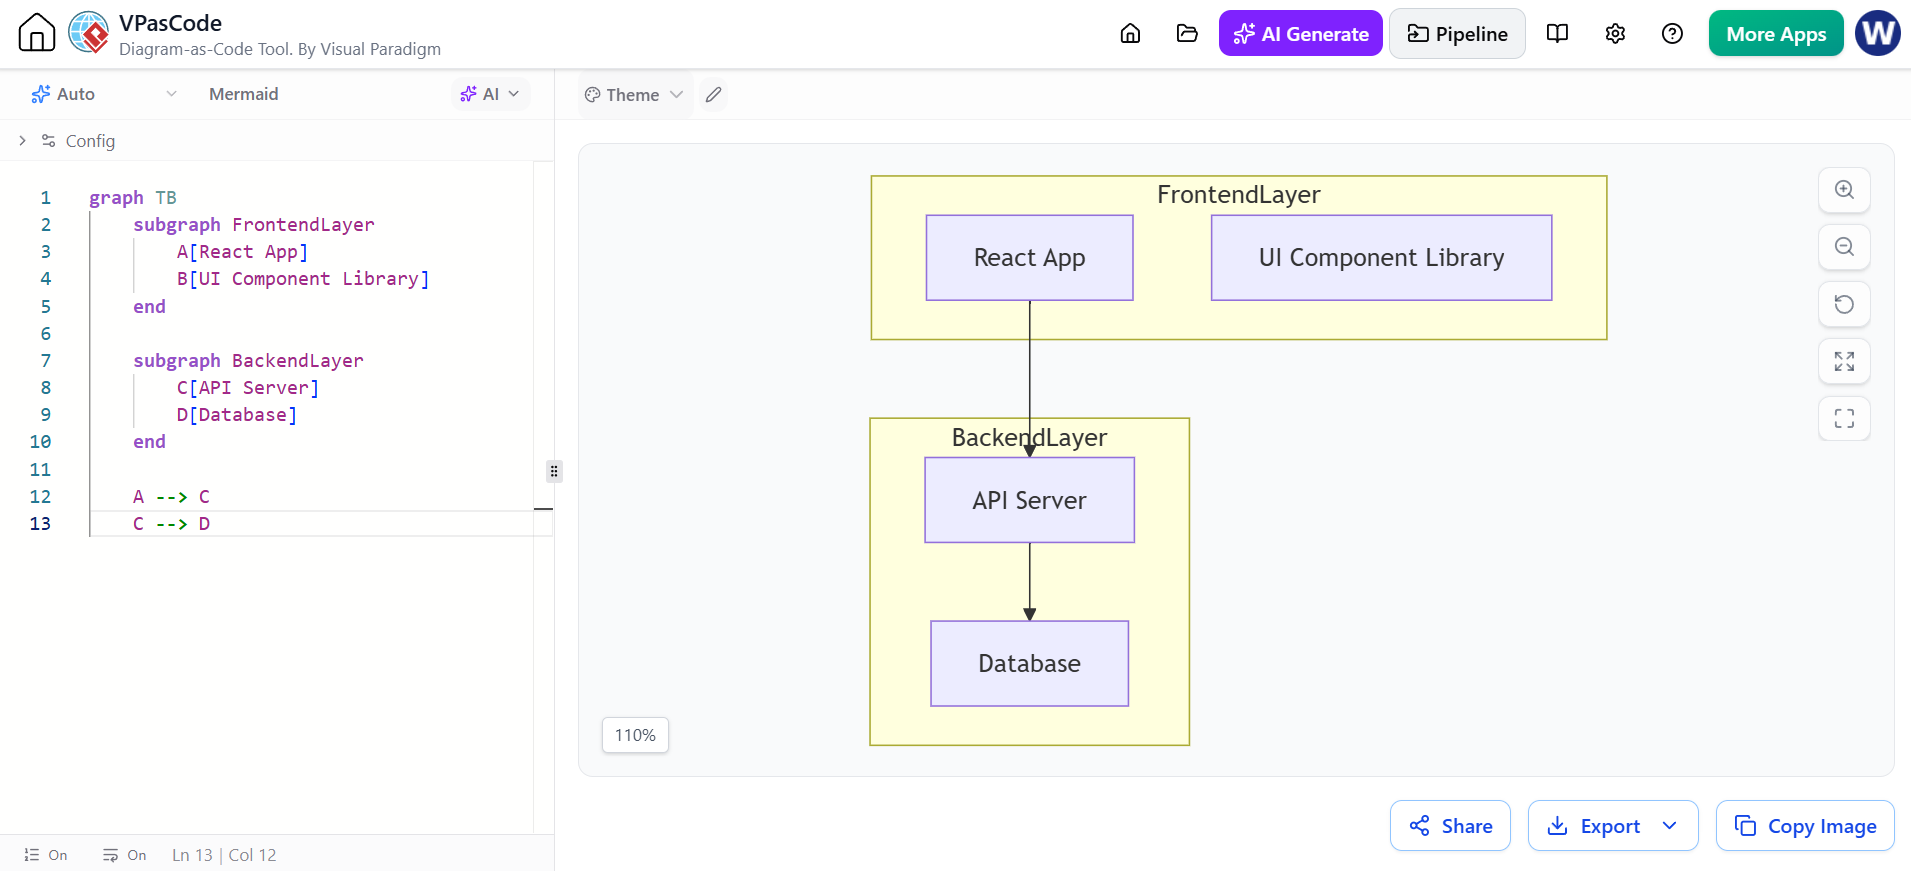
graph TB
    subgraph FrontendLayer
        A[React App]
        B[UI Component Library]
    end

    subgraph BackendLayer
        C[API Server]
        D[Database]
    end

    A --> C
    C --> D
7.2 Styling – Brand Consistency
You can add CSS styles to specific nodes using the style keyword.
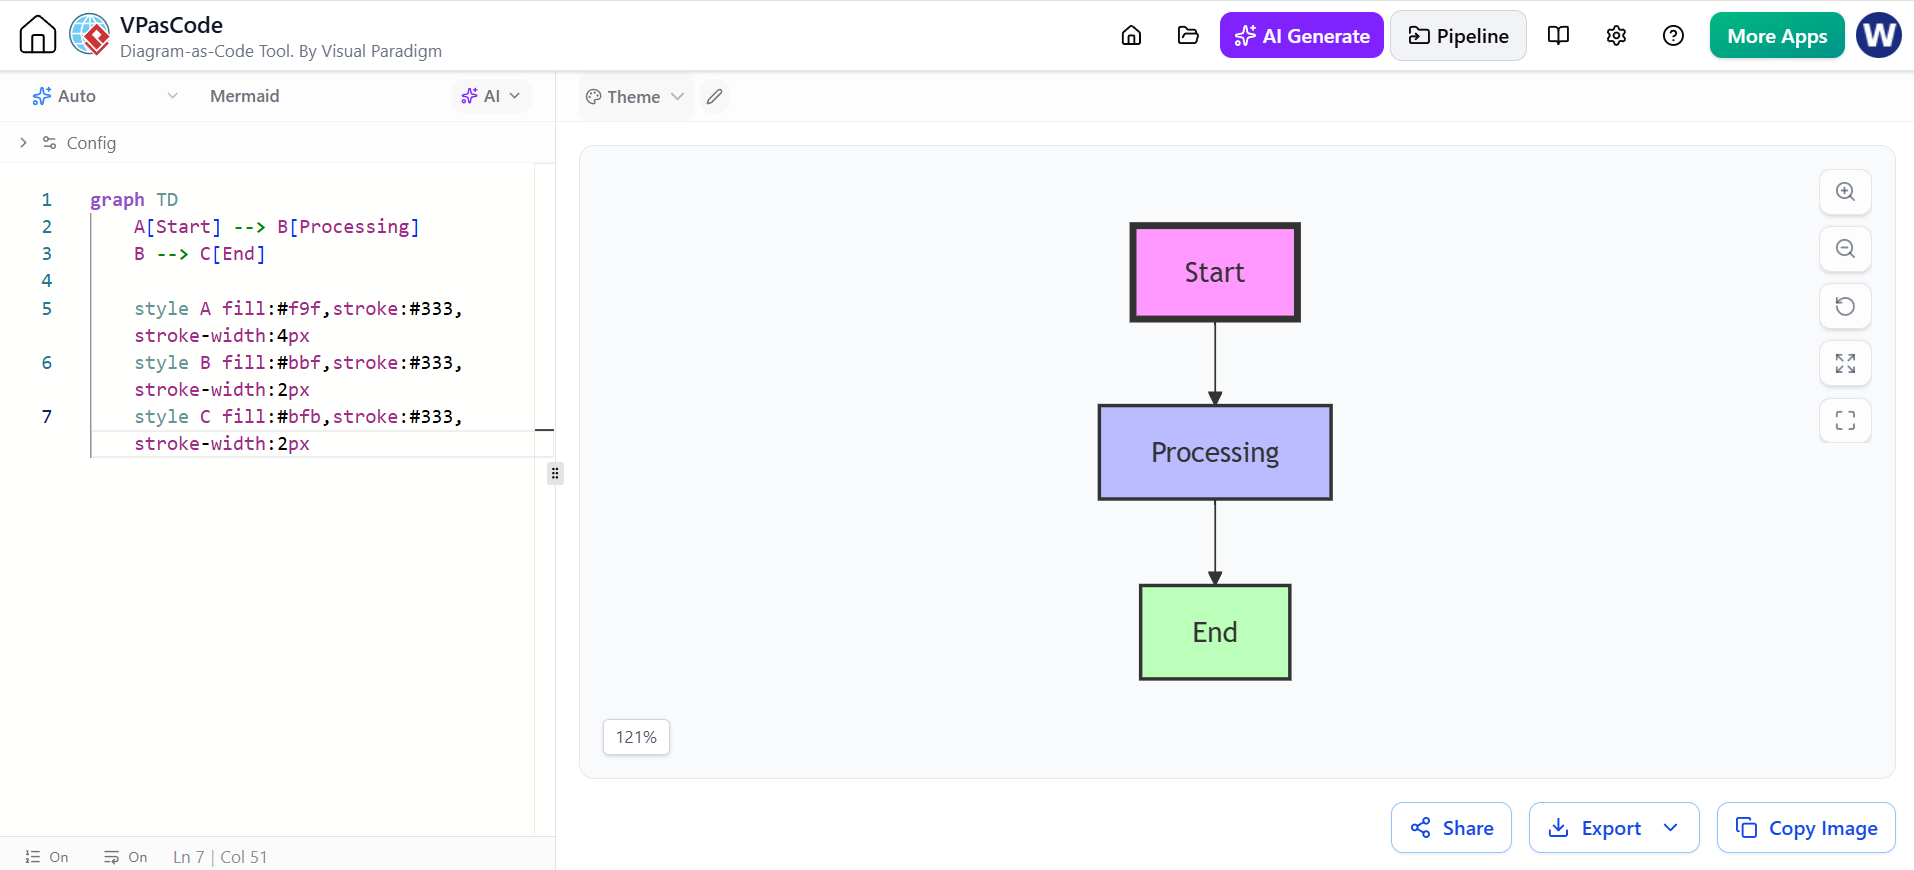
graph TD
    A[Start] --> B[Processing]
    B --> C[End]

    style A fill:#f9f,stroke:#333,stroke-width:4px
    style B fill:#bbf,stroke:#333,stroke-width:2px
    style C fill:#bfb,stroke:#333,stroke-width:2px
7.3 Click Events and Links
Enhance interactivity, making diagrams navigable documents.
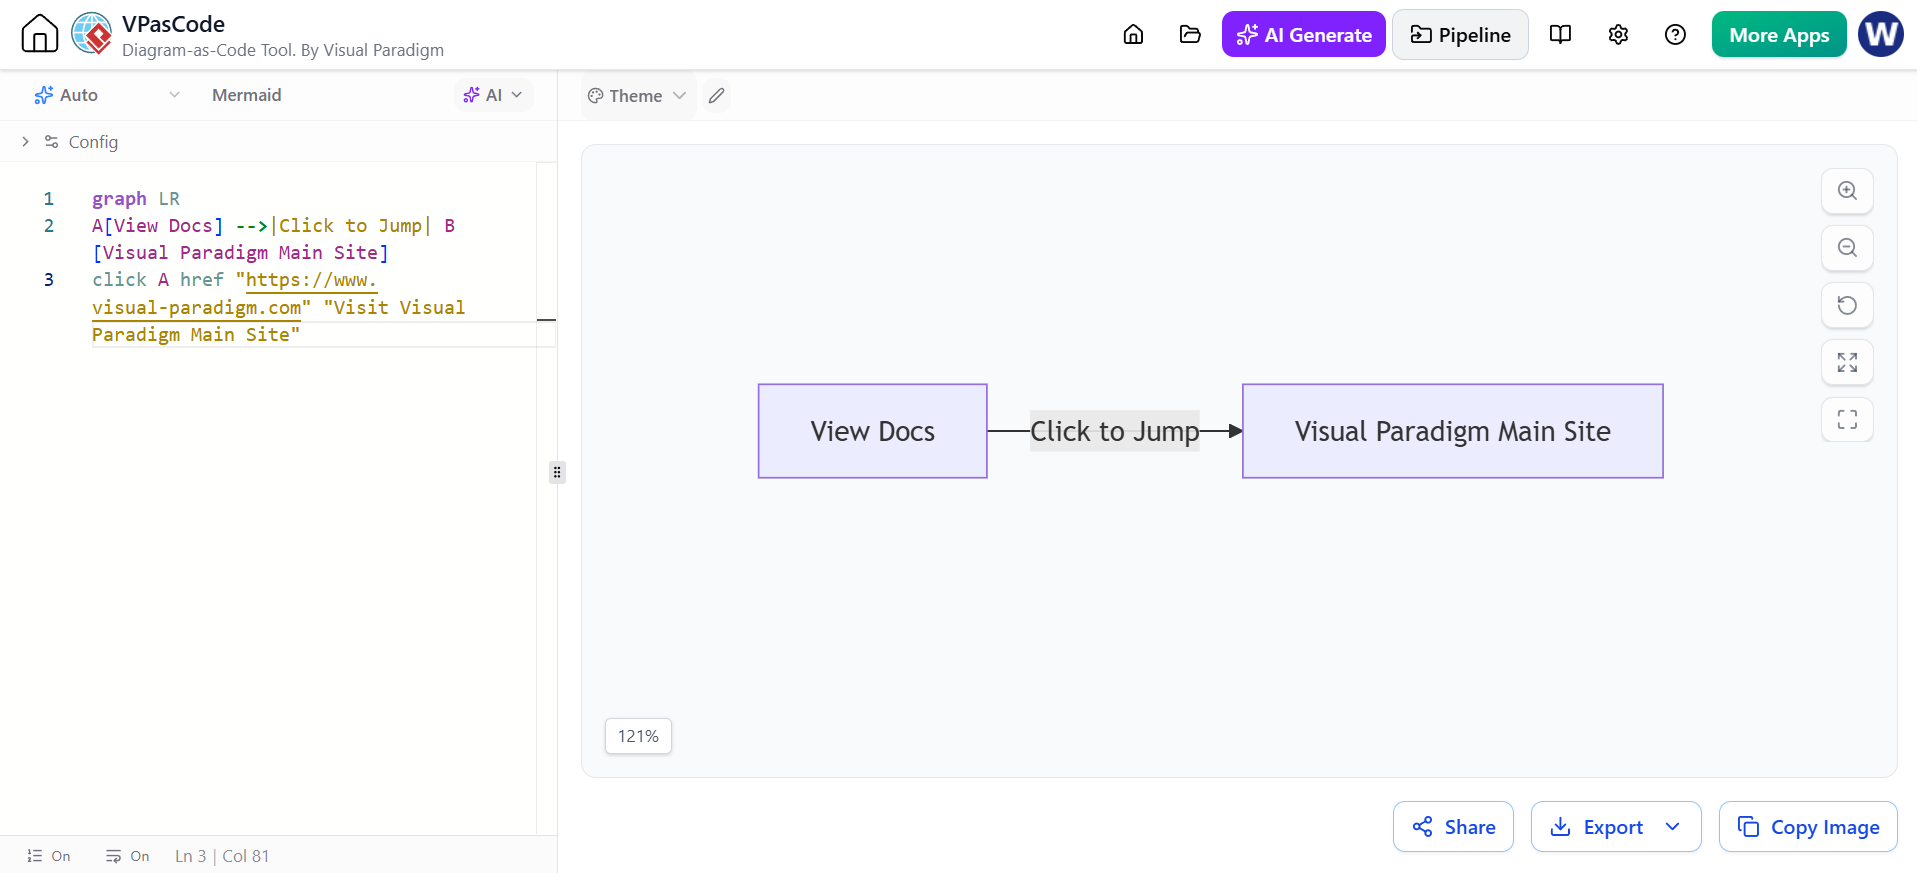
graph LR
A[View Docs] -->|Click to Jump| B[Visual Paradigm Main Site]
click A href "https://www.visual-paradigm.com" "Visit Visual Paradigm Main Site"
8. AI-Enabled Workflow: VP AI Chatbot + VPasCode in Action
This is the part I want to share most. Visual Paradigm AI Chatbot combined with VPasCode has completely changed the way we create diagrams.
8.1 Core Advantages
-
Natural Language Generation: Just describe the requirement, and AI automatically generates Mermaid code.
-
Bidirectional Conversion: Convert existing GUI diagrams to code, or render code into GUI for fine-tuning.
-
Smart Validation: Automatically detects syntax errors and provides fix suggestions.
-
Multi-format Export: One-click export to PNG, SVG, PDF, convenient for embedding in PPTs or reports.
8.2 Practical Workflow Demo
Step 1: Describe Requirements in Natural Language
I input into VP AI Chatbot:
“I need a sequence diagram for an OAuth2 user authentication flow, including User, Client App, Auth Server, and Resource Server.”
Step 2: AI Generates Initial Code
The AI quickly generates the following Mermaid code:
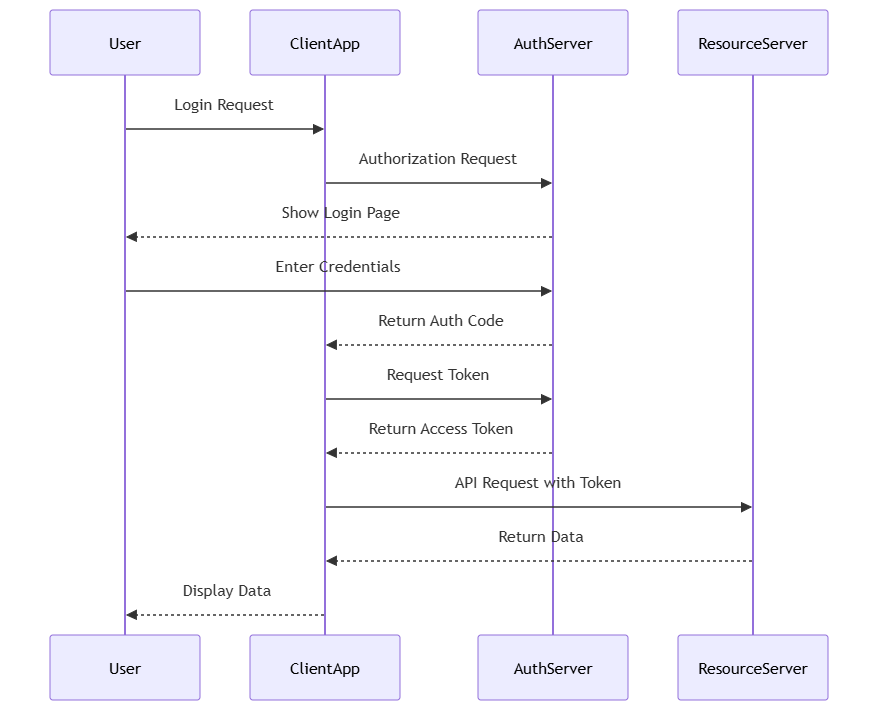
sequenceDiagram
    participant User
    participant ClientApp
    participant AuthServer
    participant ResourceServer

    User->>ClientApp: Login Request
    ClientApp->>AuthServer: Authorization Request
    AuthServer-->>User: Show Login Page
    User->>AuthServer: Enter Credentials
    AuthServer-->>ClientApp: Return Auth Code
    ClientApp->>AuthServer: Request Token
    AuthServer-->>ClientApp: Return Access Token
    ClientApp->>ResourceServer: API Request with Token
    ResourceServer-->>ClientApp: Return Data
    ClientApp-->>User: Display Data
Step 3: Iterative Optimization
I follow up:
“Please add an error handling branch for ‘invalid credentials’.”
The AI updates the code, adding conditional logic.
Step 4: Export and Integration
Use VPasCode to export the final code as a high-resolution SVG and embed it into my Product Requirement Document (PRD). Meanwhile, commit the .mmd source file to the Git repository to ensure other team members can trace and modify it.
8.3 Comprehensive Case: Product Management Workflow
Here is a complete product lifecycle flowchart generated with AI assistance:
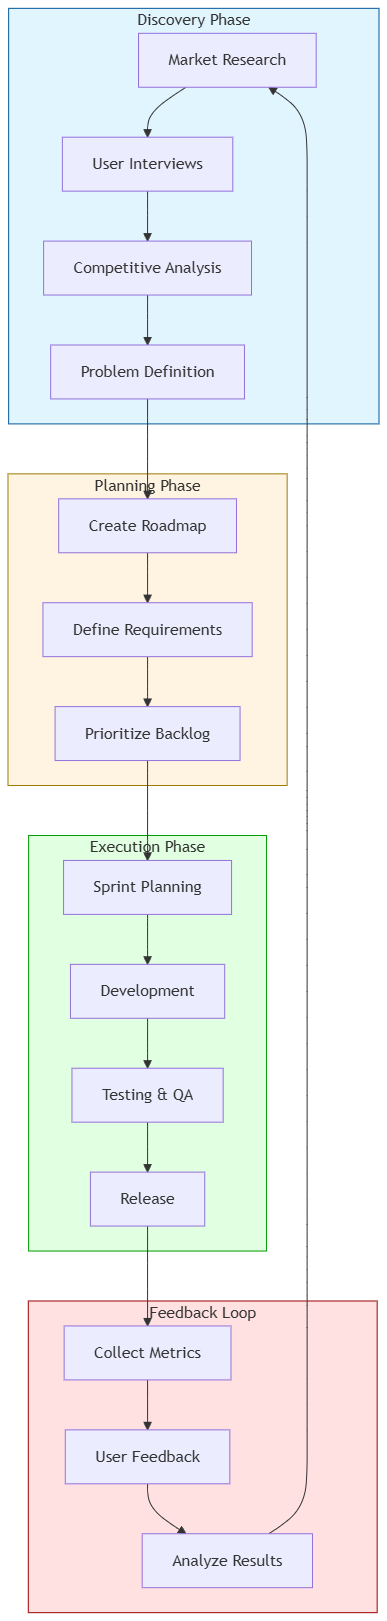
graph TB
    subgraph Discovery["Discovery Phase"]
        A[Market Research] --> B[User Interviews]
        B --> C[Competitive Analysis]
        C --> D[Problem Definition]
    end

    subgraph Planning["Planning Phase"]
        D --> E[Create Roadmap]
        E --> F[Define Requirements]
        F --> G[Prioritize Backlog]
    end

    subgraph Execution["Execution Phase"]
        G --> H[Sprint Planning]
        H --> I[Development]
        I --> J[Testing & QA]
        J --> K[Release]
    end

    subgraph Feedback["Feedback Loop"]
        K --> L[Collect Metrics]
        L --> M[User Feedback]
        M --> N[Analyze Results]
        N --> A
    end

    style Discovery fill:#e1f5ff,stroke:#01579b
    style Planning fill:#fff4e1,stroke:#9b7a01
    style Execution fill:#e1ffe1,stroke:#019b01
    style Feedback fill:#ffe1e1,stroke:#9b0101
8.4 Usage Tips
-
Be Specific: The more detailed your prompt to the AI (including node names, relationship types), the more accurate the generated code.
-
Small Steps: Generate the skeleton first, then gradually add details.
-
Leverage Templates: VP has many built-in industry-standard templates that can be reused directly.
-
Early Validation: Let AI check syntax legality before making large-scale modifications.
9. Best Practices: Tips to Avoid Pitfalls
Based on my experience, here are a few recommendations:
9.1 Naming Conventions
-
Meaningful IDs: Try to use
Start,Process,Endinstead ofA,B,Cfor easier maintenance. -
Concise Labels: Keep node text brief; avoid long paragraphs.
9.2 Layout Optimization
-
Choose the Right Direction: Use
TDfor flowcharts,LRfor sequences. -
Reduce Crossings: Reduce line clutter by adjusting node order or using subgraphs.
-
Control Complexity: If a single diagram exceeds 20 nodes, consider splitting it into multiple sub-diagrams or linked charts.
9.3 Maintenance Strategy
-
Git Management: Be sure to include
.mmdfiles in version control. -
Document Context: Explain the business background and scope of the diagram in code comments.
-
Regular Review: Regularly check if diagrams still reflect reality as the product iterates.
9.4 Accessibility
-
Provide Alt Text: Add detailed text descriptions for diagrams to assist visually impaired users or text readers.
-
Color Contrast: Ensure style colors have sufficient contrast.
9.5 Team Collaboration
-
Share Source Code: Don’t just share images; share source files.
-
Unified Style: Agree on color schemes and naming conventions within the team.
-
Code Review: Include diagram code changes in the PR review process.
10. Complete Case Studies
Case 1: Agile Sprint Workflow

graph LR
    subgraph SprintPlanning["Sprint Planning"]
        A[Review Backlog] --> B[Estimate Stories]
        B --> C[Commit to Sprint Goal]
    end

    subgraph DailyWork["Daily Work"]
        C --> D[Daily Standup]
        D --> E[Development]
        E --> F[Code Review]
        F --> G[Testing]
    end

    subgraph Review["Review & Retro"]
        G --> H[Demonstrate Work]
        H --> I[Gather Feedback]
        I --> J[Retrospective]
        J --> K[Identify Improvements]
    end

    K --> A

    style SprintPlanning fill:#cce5ff
    style DailyWork fill:#d4edda
    style Review fill:#f8d7da
Case 2: Microservices Architecture Overview
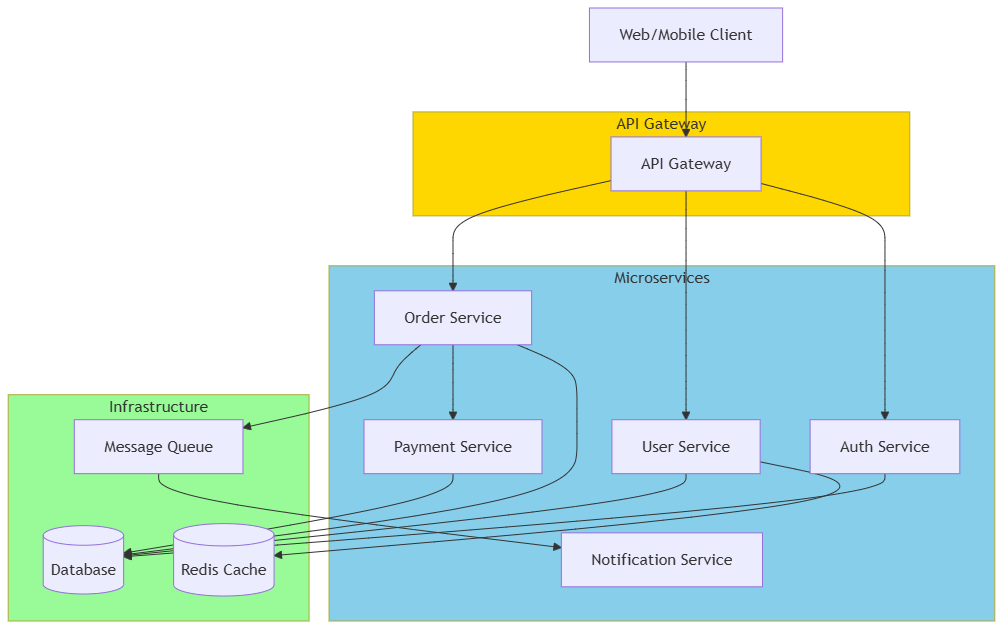
graph TB
    Client[Web/Mobile Client]

    subgraph APIGateway["API Gateway"]
        GW[API Gateway]
    end

    subgraph Services["Microservices"]
        Auth[Auth Service]
        User[User Service]
        Order[Order Service]
        Payment[Payment Service]
        Notification[Notification Service]
    end

    subgraph Infrastructure["Infrastructure"]
        DB[(Database)]
        Cache[(Redis Cache)]
        Queue[Message Queue]
    end

    Client --> GW
    GW --> Auth
    GW --> User
    GW --> Order
    Order --> Payment
    Order --> Queue
    Queue --> Notification

    Auth --> DB
    User --> DB
    User --> Cache
    Order --> DB
    Payment --> DB

    style APIGateway fill:#ffd700
    style Services fill:#87ceeb
    style Infrastructure fill:#98fb98
Case 3: Feature Prioritization Decision Tree
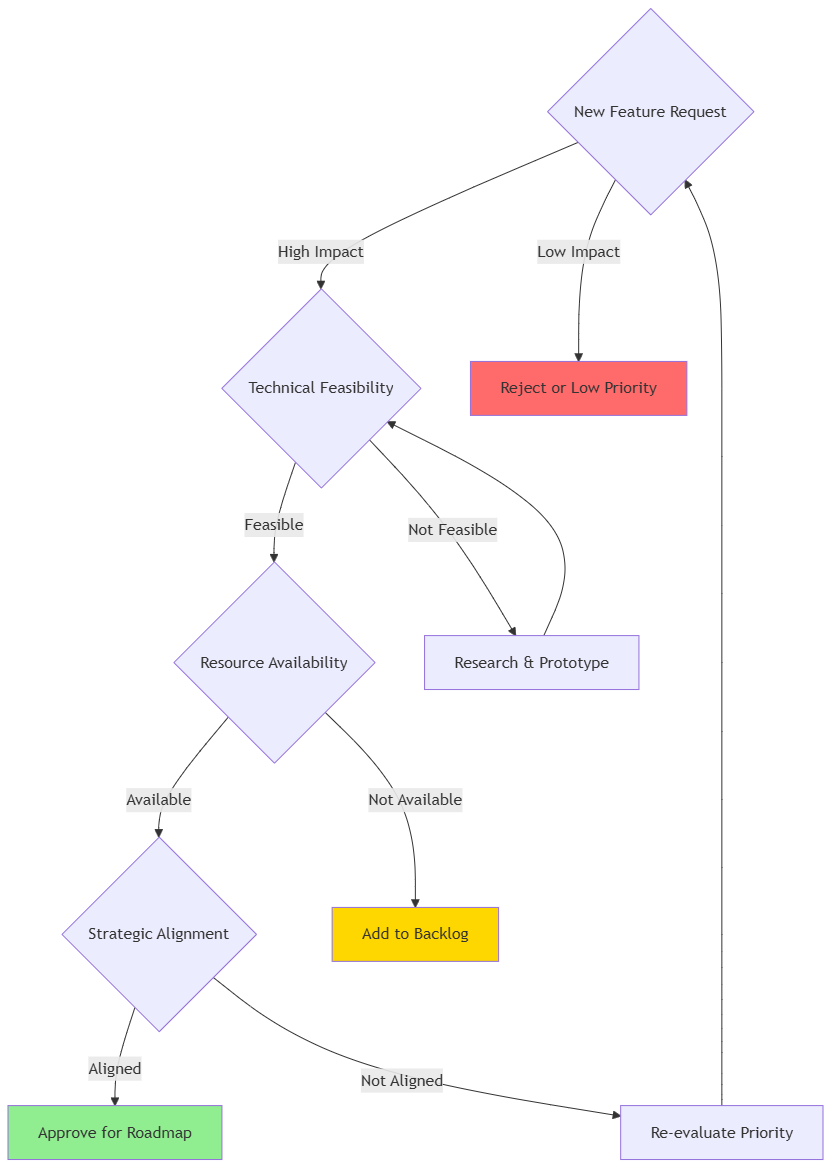
graph TD
    Start{New Feature Request}

    Start -->|High Impact| A{Technical Feasibility}
    Start -->|Low Impact| Reject[Reject or Low Priority]

    A -->|Feasible| B{Resource Availability}
    A -->|Not Feasible| Research[Research & Prototype]

    B -->|Available| C{Strategic Alignment}
    B -->|Not Available| Backlog[Add to Backlog]

    C -->|Aligned| Approve[Approve for Roadmap]
    C -->|Not Aligned| Reconsider[Re-evaluate Priority]

    Research --> A
    Reconsider --> Start

    style Approve fill:#90ee90
    style Reject fill:#ff6b6b
    style Backlog fill:#ffd700
📝 Conclusion
Through this period of practice, I believe that Mermaid + Visual Paradigm AI Chatbot + VPasCode is a highly potential “Diagram as Code” solution.
-
For Individuals: It lowers the barrier to drawing, allowing you to focus on logic rather than layout.
-
For Teams: It solves the problems of document synchronization and version management, improving collaboration efficiency.
-
For Enterprises: It achieves structuring and automation of knowledge assets, aligning with DevOps and Agile concepts.
If you are still struggling with updating architecture diagrams or wish to improve the professionalism and maintainability of your product documentation, I strongly recommend trying this workflow.
Hope this sharing helps! If you have specific usage questions, feel free to communicate anytime.
(Note: All Mermaid code in this article can be rendered directly in VPasCode supporting Mermaid in Visual Paradigm.)
References
- AI Chart Generation: Create with Chatbot, Edit with VPasCode: Official release notes on the AI chart generator workflow, enabling chart creation via chatbot and direct editing in VPasCode for data and style refinement .
- From Code to Clarity: A Beginner’s Guide to Seamless Diagramming with VPasCode and OpenDocs: A tutorial (French) covering the VPasCode-to-OpenDocs pipeline for pushing diagrams directly into documentation, with practical PlantUML examples .
- Product Review: Visual Paradigm AI Chatbot – The “AI Accelerator” for Developer Modeling: A hands-on review (Chinese) detailing how the AI Chatbot generates UML use case diagrams from prompts, handles
<<include>>and<<extend>>relationships, and supports iterative conversational refinement . - VPasCode: Free Text to Diagram Tool & Diagram-as-Code Editor: The official product page for VPasCode, highlighting its support for PlantUML, Mermaid, and Graphviz, along with AI-powered features like syntax error fixing and diagram translation .
- 60-Second VPasCode Quickstart Guide: A quickstart guide showing how to create, customize, and share a diagram in under a minute using VPasCode’s real-time preview and shareable URLs .
- Seamless Diagram Lifecycle Management: Edit & Sync AI-Generated Diagrams from AI Chatbot to OpenDocs via VPasCode: Announcement of an enhanced pipeline where users can generate a diagram with the AI Chatbot, document it in OpenDocs, and re-edit it via VPasCode for full lifecycle control .
- Mastering Data Flow Diagrams: A Hands-On Review of Visual Paradigm’s AI-Powered DFD Generator: A review of the AI Chatbot’s DFD generation capabilities, focusing on system boundaries and the integration with VPasCode for instant customization using Graphviz syntax .
- What’s New in VPasCode – Launch Feature Roundup: A feature roundup detailing VPasCode’s multi-syntax support, AI code error fixing, AI translation, and its integration with Visual Paradigm OpenDocs for documentation .
- Seamlessly Connect Diagrams to Documentation with OpenDocs: An article explaining how VPasCode acts as a bridge to OpenDocs, transforming static diagrams into living documentation assets and solving the problem of “doc-rot” .
- Hands-on Review: Using AI-Assisted DFD Top-Down Decomposition with Visual Paradigm + VPasCode: A user’s experience (Chinese) using the AI Chatbot as a “private DFD coach” for top-down decomposition, and using VPasCode to edit and refine the diagrams .
- In-depth Review: VPasCode with Apache ECharts & AI – Say Goodbye to Drag-and-Drop: A developer’s review (Chinese) showcasing how VPasCode unifies Diagram-as-Code with AI to generate ECharts dashboards and PlantUML diagrams, along with a 5-step guide to getting started .
This post is also available in Deutsch, Español, فارسی, Français, English, Bahasa Indonesia, 日本語, Polski, Portuguese, Ру́сский, Việt Nam, 简体中文 and 繁體中文.