What is BPMN?
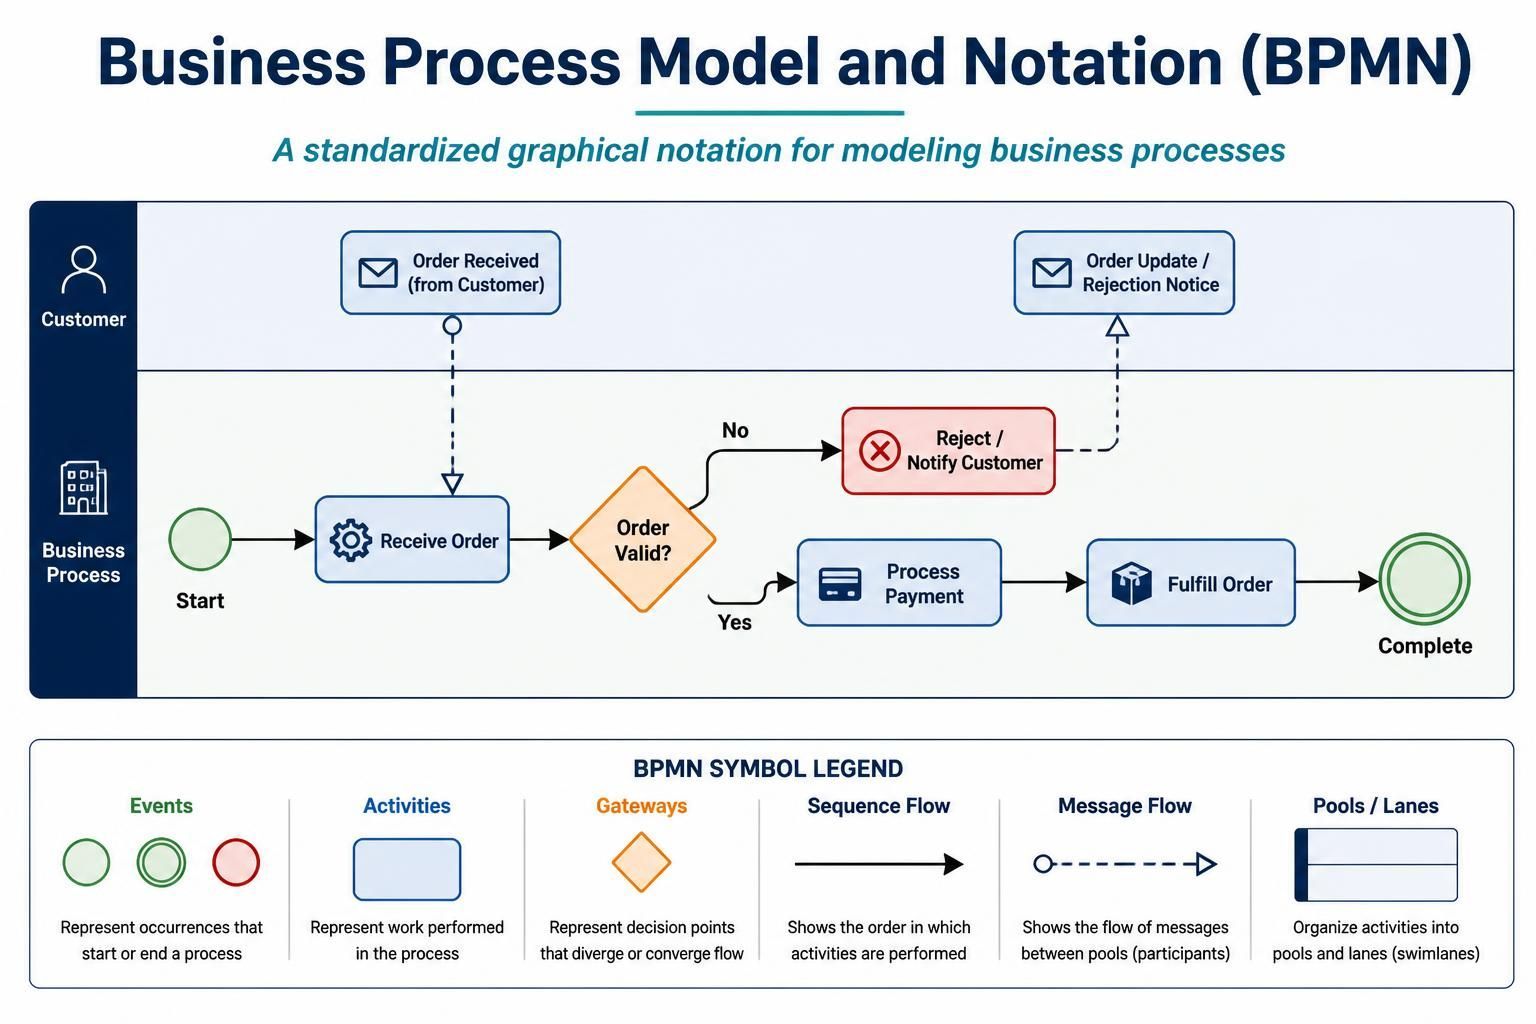
Business Process Model and Notation (BPMN) is a standardized graphical notation for modeling business processes. It provides a flowchart method that details the steps of a planned business process from end to end. As a cornerstone of Business Process Management (BPM), it visually depicts the detailed sequence of business activities and information flows required to complete a process.
Purpose and Evolution
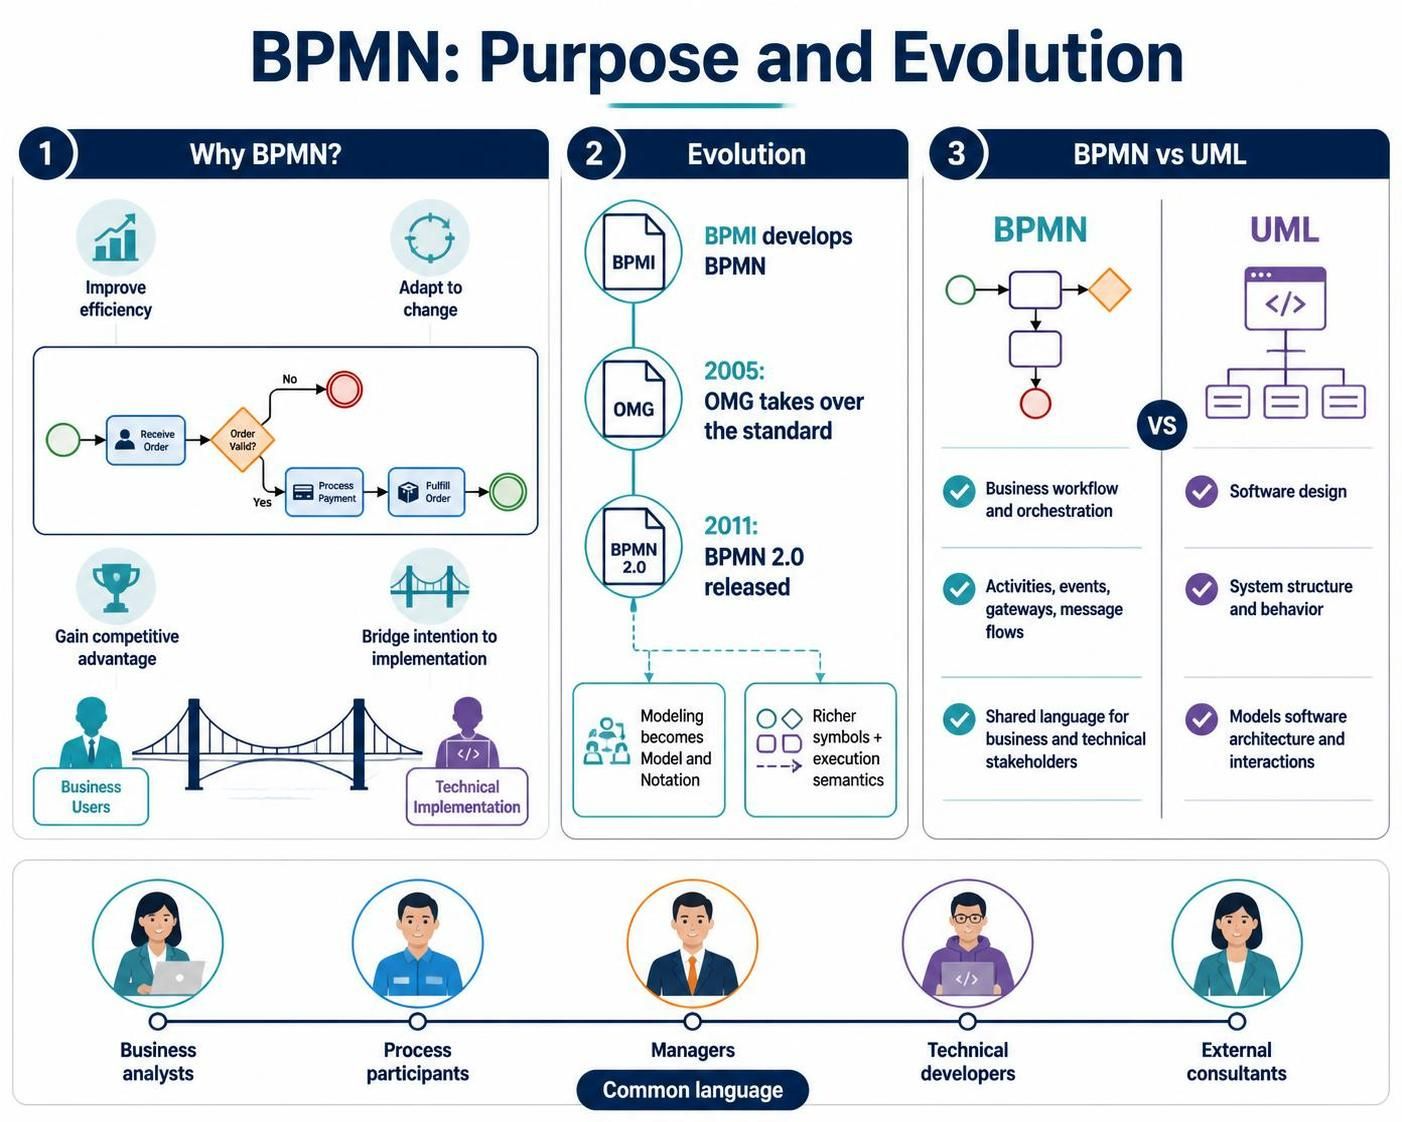
The primary purpose of BPMN is to model processes to improve efficiency, account for new circumstances, or gain a competitive advantage. Originally developed by the Business Process Management Initiative (BPMI), the standard was taken over by the Object Management Group (OMG) in 2005. In 2011, OMG released BPMN 2.0, updating the name from “Modeling” to “Model and Notation” and introducing a richer set of symbols and execution semantics.
BPMN differs from Unified Modeling Language (UML), which is primarily used for software design. While UML focuses on system structure and behavior, BPMN focuses on business workflow and orchestration. Ideally, BPMN bridges the gap between process intention and implementation by providing a common language for all stakeholders: business analysts, process participants, managers, technical developers, and external consultants.
Core Elements of BPMN 2.0
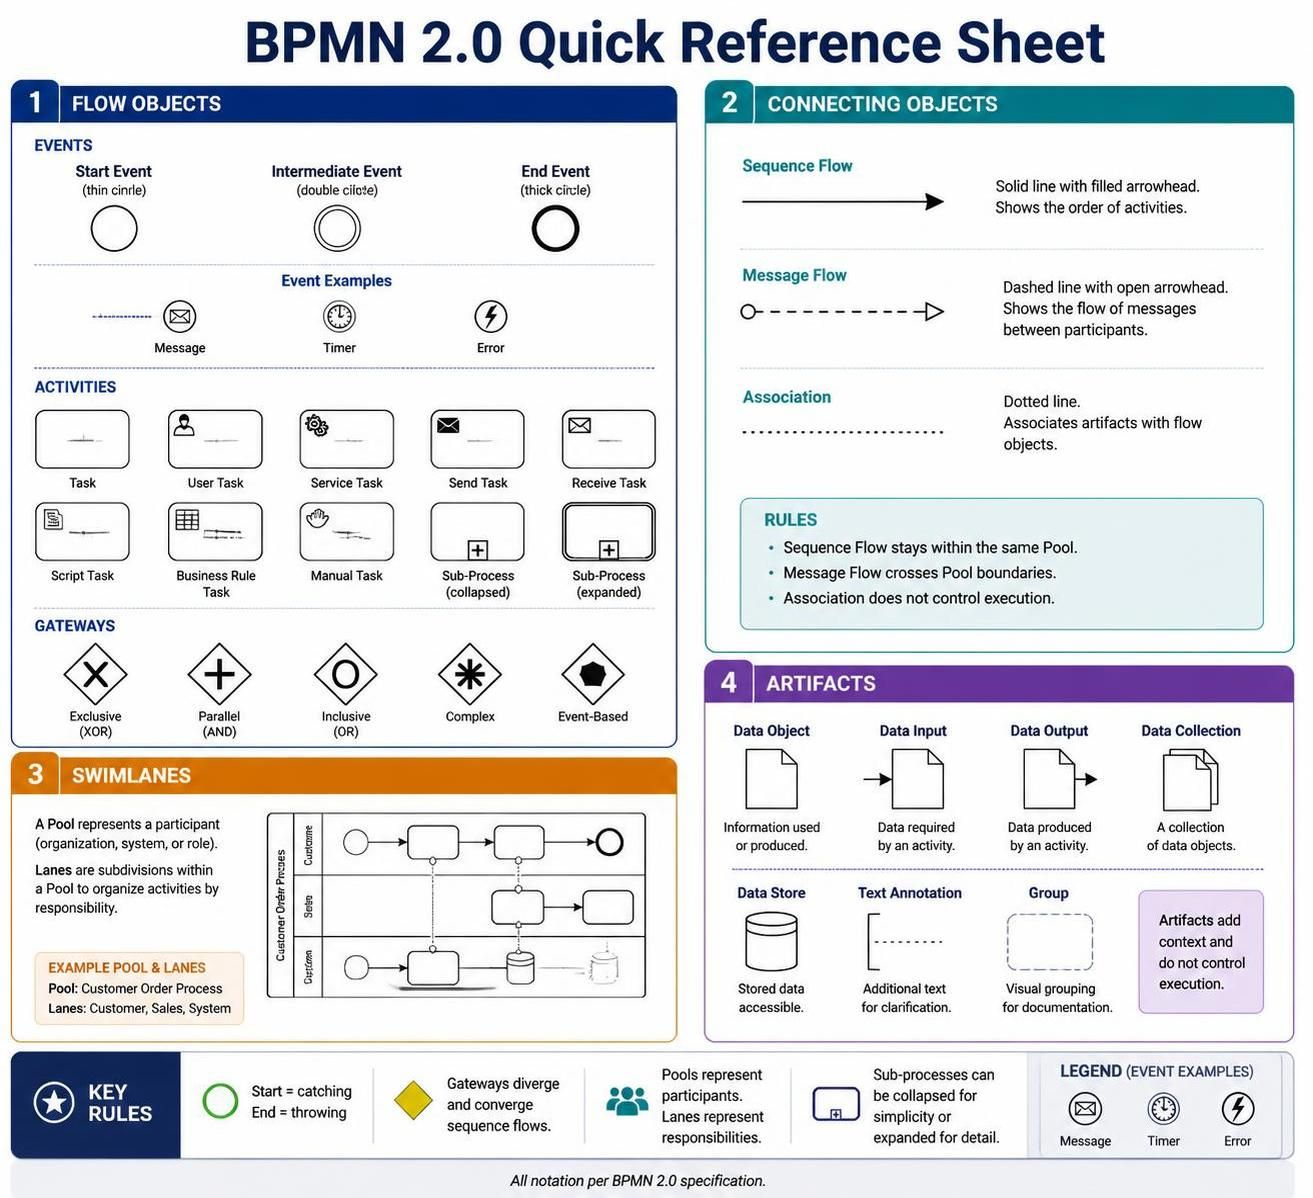
BPMN diagrams are constructed using four basic categories of elements:
-
Flow Objects: Events, Activities, Gateways.
-
Connecting Objects: Sequence Flow, Message Flow, Association.
-
Swimlanes: Pools and Lanes.
-
Artifacts: Data Objects, Groups, Annotations.
1. Flow Objects
Flow objects are the main descriptive elements within a BPMN diagram.
Events
Events represent something that happens during the course of a process. They are depicted as circles and are classified as either Catching (reacting to a trigger) or Throwing (triggering an outcome).
-
Start Events: Every process must begin with a start event. These are always catching events (e.g., receiving an email, a timer triggering, or a message arriving). They are represented by a single thin circle. Icons inside the circle define the trigger type (e.g., an envelope for a message start).
-
Intermediate Events: These occur between the start and end events. They are represented by a double-lined circle. They can be catching (waiting for a signal) or throwing (sending a signal/message mid-process).
-
End Events: These mark the conclusion of a process path. They are always throwing events because there is no subsequent process to catch the outcome. They are represented by a thick black-bordered circle. Common end events include terminating the process or sending a final notification.
Common Event Types: Message, Timer, Error, Compensation, Signal, Cancel, Escalation, and Link.
Activities
Activities represent work performed within a process. They are depicted as rectangles with rounded corners.
-
Task: The most granular level of work. A task cannot be broken down further within the current diagram.
-
Normal Task: A simple action (e.g., “Write Report”).
-
User Task: Performed by a human actor with the assistance of a software application.
-
Service Task: An automated task performed by a system or web service.
-
Send/Receive Task: Specifically denotes sending or waiting for a message from another participant.
-
Script Task: Executed by a process engine using a script (e.g., JavaScript, Python).
-
Business Rule Task: Invokes a business rule engine to evaluate conditions.
-
Manual Task: Performed without any system support (e.g., loading a truck).
-
-
Sub-Process: A compound activity containing other flow objects. Sub-processes can be Collapsed (hidden for simplicity) or Expanded (showing internal details).
-
Loop Sub-Process: Repeats sequentially.
-
Multi-Instance Sub-Process: Runs multiple instances in parallel or sequentially.
-
Ad Hoc Sub-Process: Contains tasks that can be performed in any order or skipped, based on runtime decisions.
-
Transaction: A specialized sub-process representing a set of activities that must all succeed together. If one fails, the entire transaction may be canceled or compensated. It is bordered by a double line.
-
Event Sub-Process: Triggered by an event within the scope of the parent process. It can be Interrupting (stops the main flow) or Non-Interrupting (runs in parallel without stopping the main flow).
-
-
Call Activity: References a global process defined elsewhere. When reached, control is passed to that global process.
Gateways
Gateways control the divergence and convergence of sequence flows. They are depicted as diamonds.
-
Exclusive Gateway (XOR): Only one path can be taken based on a condition.
-
Parallel Gateway (AND): Splits the flow into multiple concurrent paths or joins multiple concurrent paths. All paths must complete before proceeding.
-
Inclusive Gateway (OR): One or more paths can be taken based on conditions.
-
Complex Gateway: Handles complex synchronization or branching logic not covered by other gateways.
-
Event-Based Gateway: Triggers paths based on incoming events rather than data conditions.
2. Connecting Objects
Connecting objects link flow objects to show the order and relationships.
-
Sequence Flow: A solid line with a solid arrowhead. It shows the order in which activities are performed. It cannot cross pool boundaries.
-
Message Flow: A dashed line with a circle at the start and an arrowhead at the end. It represents communication between two separate participants (Pools). It connects objects across pool boundaries but never connects two objects within the same pool.
-
Association: A dotted line. It links artifacts (like data or text) to flow objects. It does not affect the flow order.
3. Swimlanes
Swimlanes organize activities by responsibility.
-
Pool: Represents a major participant in the process, such as a different organization, department, or system. Pools define the boundaries of interaction.
-
Lane: Sub-divisions within a Pool. Lanes represent specific roles, individuals, or systems within that participant’s organization. They help clarify who is accountable for each task.
4. Artifacts
Artifacts provide additional information about the process but do not affect the flow execution.
-
Data Objects: Represent data required for, produced by, or stored during the process.
-
Data Input: Data required to start a task.
-
Data Output: Data generated by a task.
-
Data Collection: Indicates multiple instances of data (e.g., multiple survey responses).
-
Data Store: Persistent storage (e.g., a database or file system).
-
-
Annotations: Text notes used to provide additional context or explanation for readers.
-
Groups: Visual containers used to logically group activities for readability. Unlike sub-processes, groups do not have semantic meaning in execution; they are purely for organizational clarity.
BPMN Sub-Models and Scope
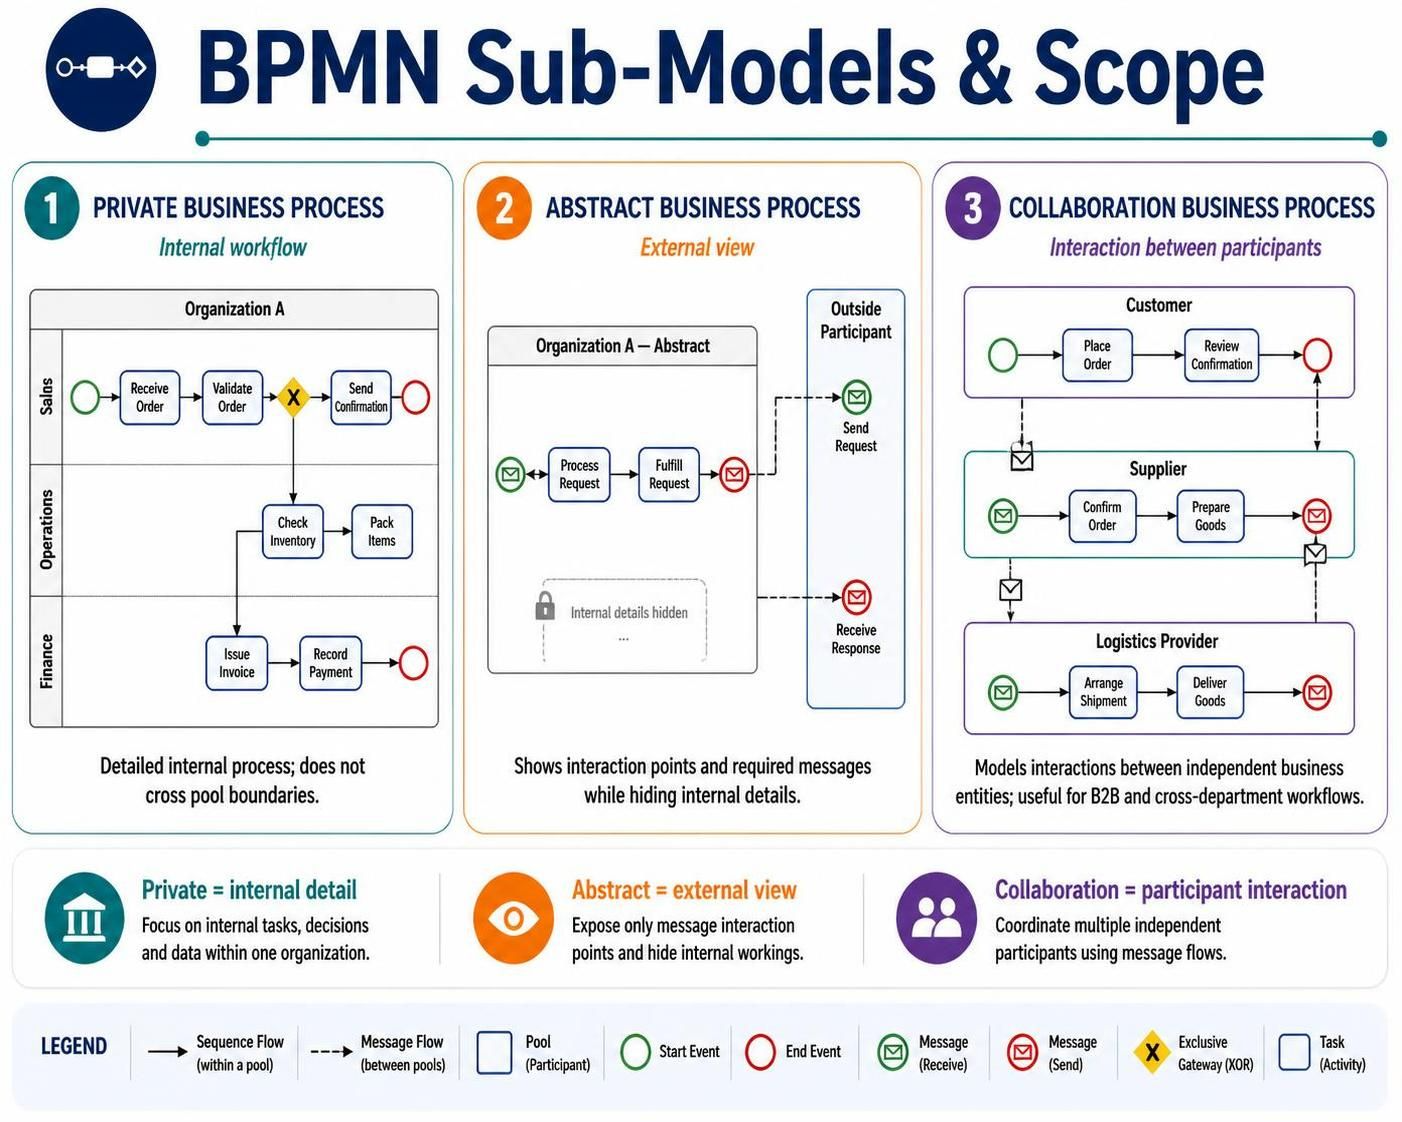
BPMN diagrams can be categorized based on their visibility and scope:
-
Private Business Processes: Internal to a specific organization. These do not cross pool boundaries and detail internal workflows.
-
Abstract Business Processes: Describe the interaction points between a private process and the outside world. They show the sequence of messages required to interact with the private process but hide internal details.
-
Collaboration Business Processes: Show interactions between two or more independent business entities (Pools). This is useful for mapping B2B processes or inter-departmental workflows.
Best Practices for Business Process Modeling
To create effective and readable BPMN diagrams, follow these guidelines:
-
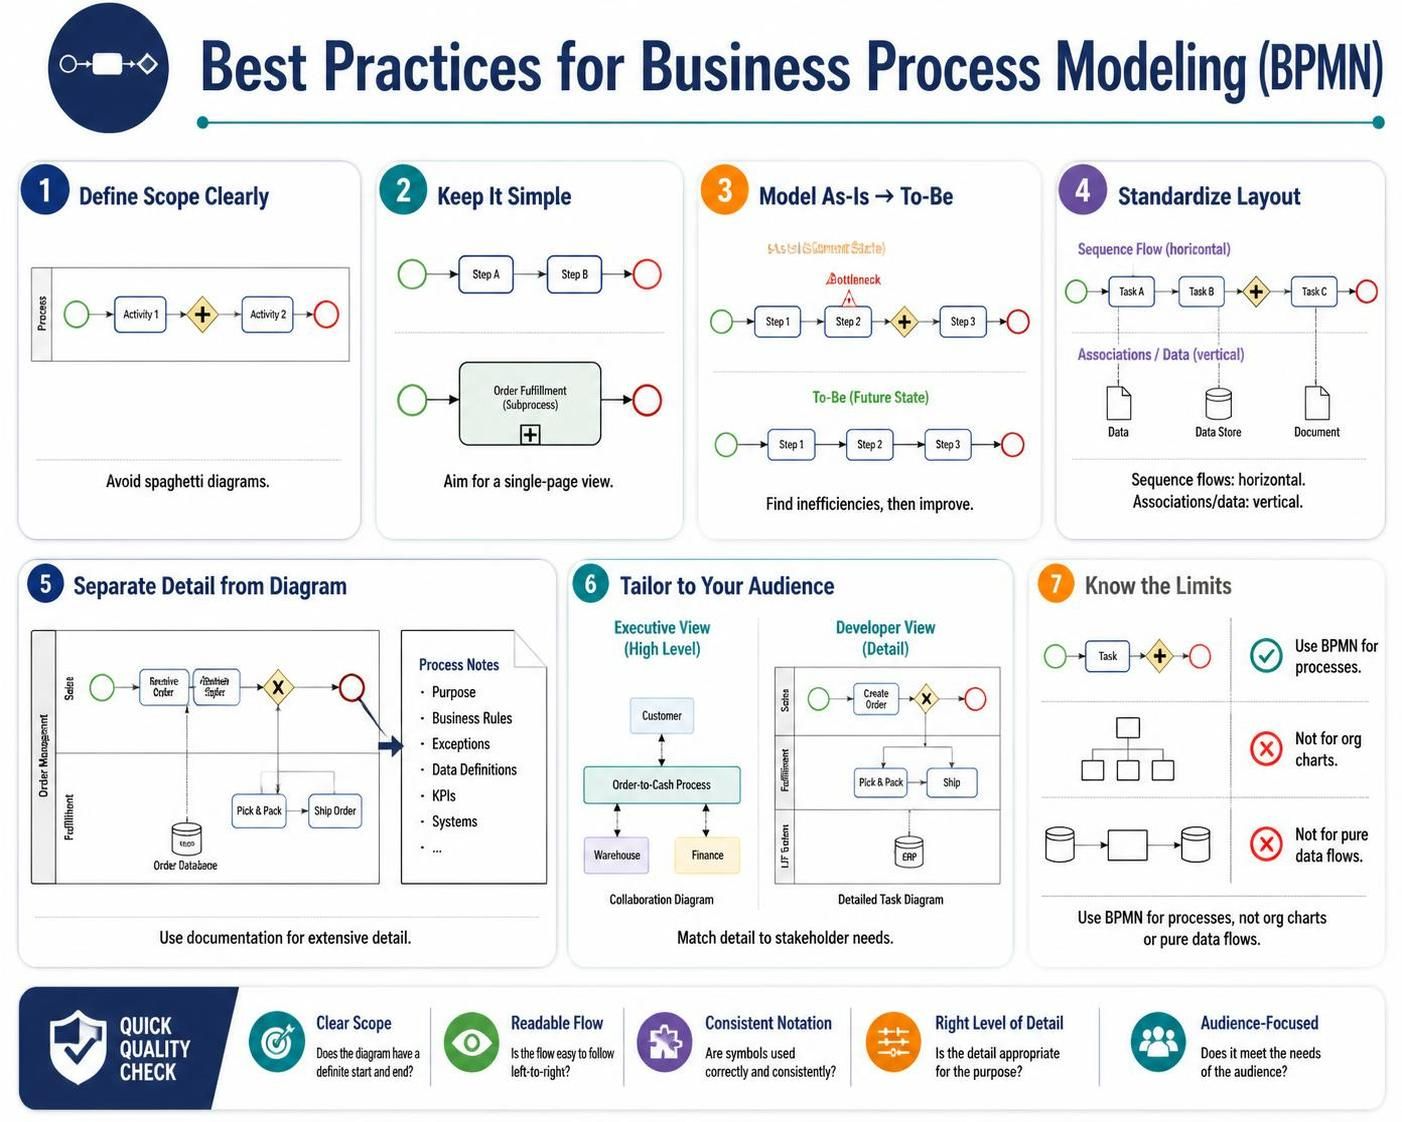
Define Scope Clearly: Every diagram should have a clear start and end. Avoid “spaghetti diagrams” that try to map everything at once.
-
Keep it Simple: Aim for diagrams that fit on a single page (even if large). Use collapsed sub-processes to hide complexity from high-level viewers.
-
Map Current vs. Future State: First, model the “As-Is” process to identify inefficiencies. Then, model the “To-Be” process to propose improvements.
-
Standardize Layout:
-
Lay out Sequence Flows horizontally (left to right).
-
Lay out Associations and Data Flows vertically.
-
-
Separate Detail from Diagram: Keep the diagram clean. Use separate documentation or annotations for extensive details rather than cluttering the visual flow.
-
Tailor to Audience: Create different versions of the diagram for different stakeholders. Executives may need high-level collaboration diagrams, while developers need detailed task-level specs.
-
Know the Limits: BPMN is not suitable for modeling organizational charts, functional breakdowns, or pure data flow models (use Data Flow Diagrams for that).
Benefits of Using BPMN
-
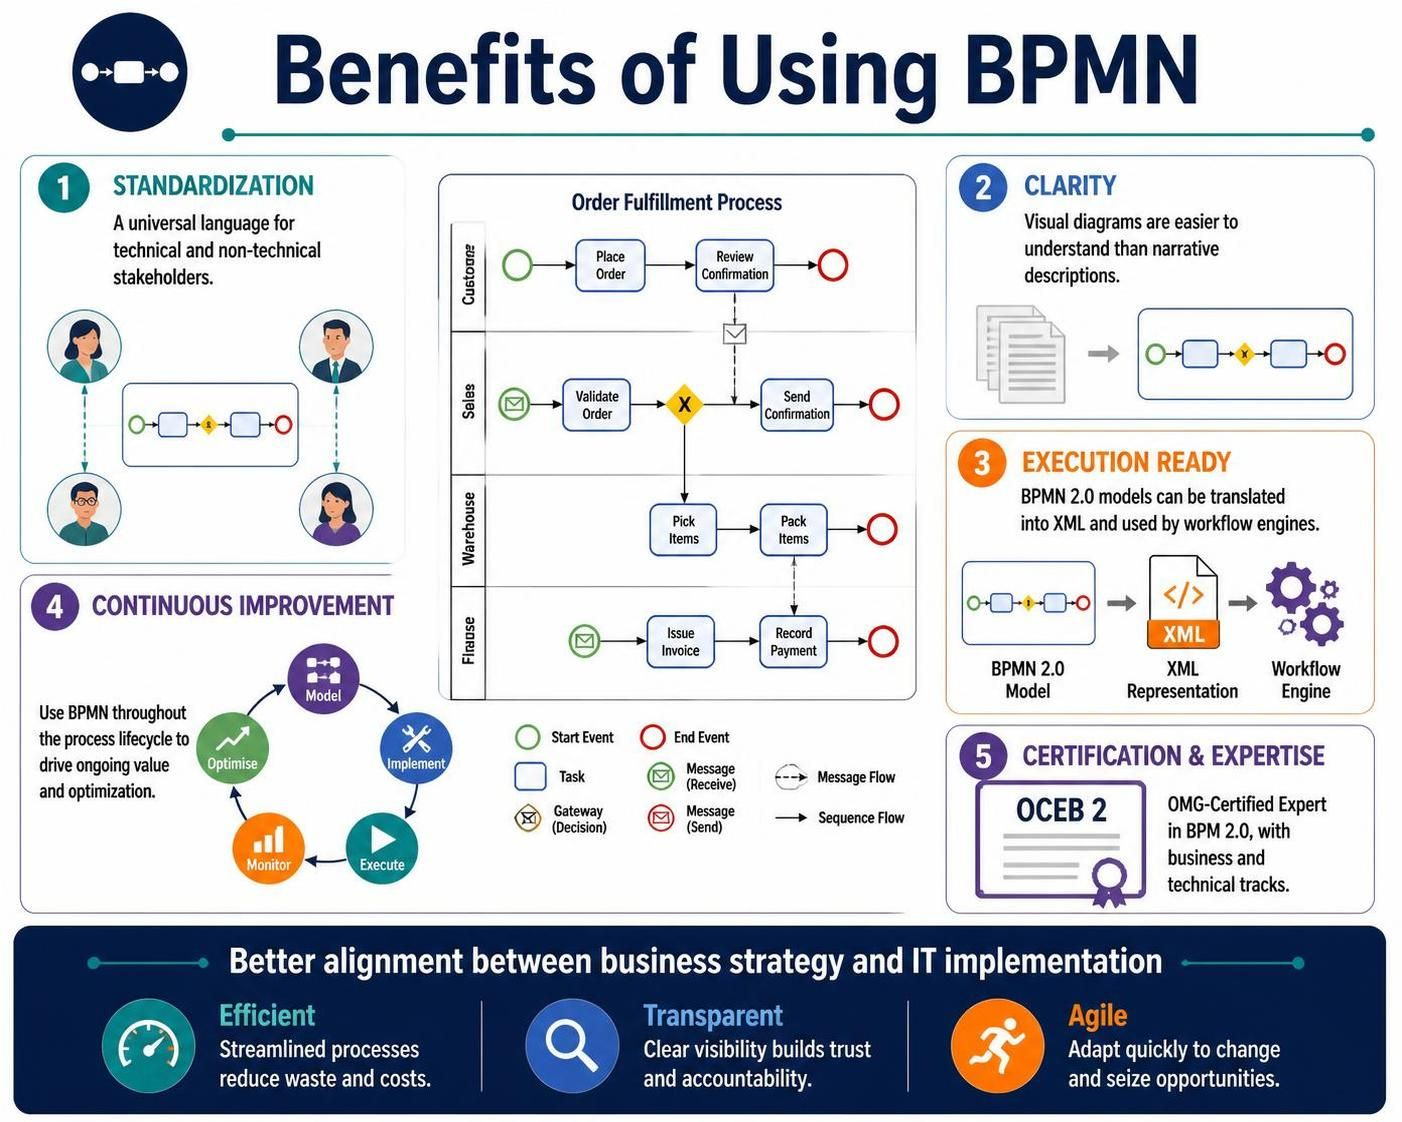
Standardization: Provides a universal language understood by both technical and non-technical stakeholders.
-
Clarity: Visual diagrams are often easier to understand than narrative text descriptions.
-
Execution Ready: BPMN 2.0 is executable. Diagrams can be translated into XML formats (such as BPEL – Business Process Execution Language) to drive workflow engines.
-
Continuous Improvement: Supports the BPM lifecycle: Model → Implement → Execute → Monitor → Optimize.
-
Certification and Expertise: The OMG offers the OCEB 2 (OMG-Certified Expert in BPM 2.0) certification, validating expertise in both business and technical tracks of BPMN.
By mastering BPMN, organizations can achieve better alignment between business strategy and IT implementation, leading to more efficient, transparent, and agile processes.
Tooling Spotlight: Visual Paradigm BPMN & AI-Assisted Features
While BPMN is a standard notation independent of any specific software, the choice of tooling significantly impacts the efficiency, accuracy, and scalability of process modeling. Visual Paradigm is a comprehensive enterprise-grade platform that supports BPMN 2.0, offering robust features for both manual diagramming and AI-assisted automation.
How Visual Paradigm Enhances BPMN Modeling
1. AI-Powered Process Generation
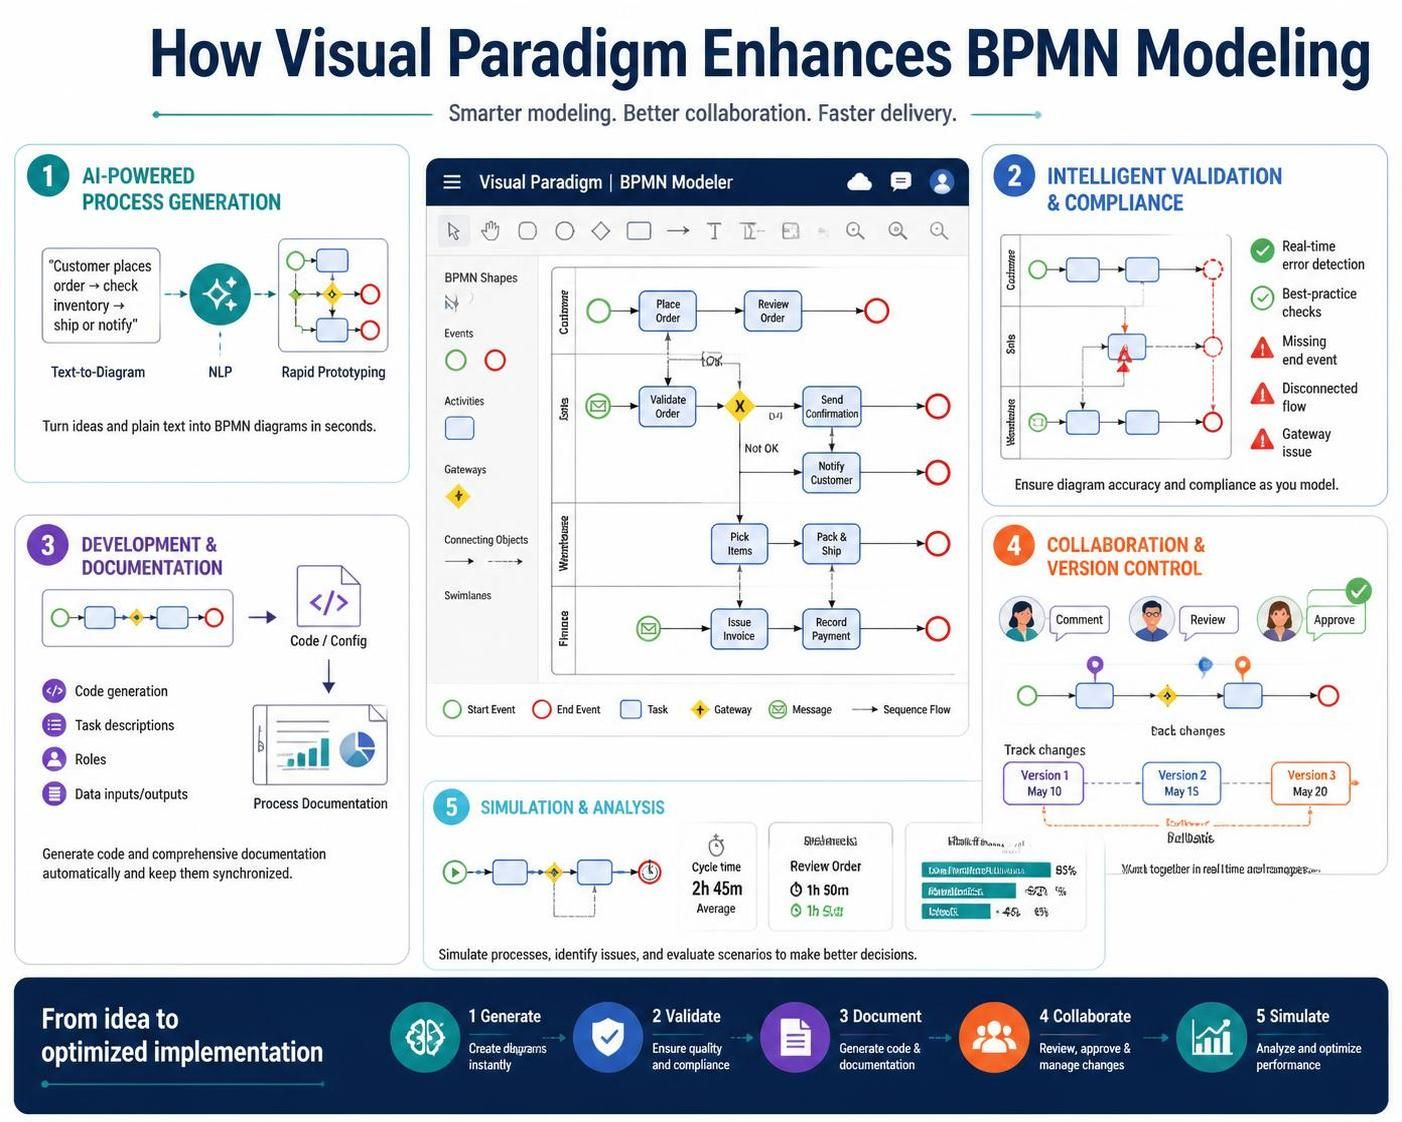
Visual Paradigm integrates Artificial Intelligence to accelerate the initial drafting of processes. Instead of starting from a blank canvas, users can leverage natural language processing (NLP) to generate diagrams.
-
Text-to-Diagram: Users can input a textual description of a business process (e.g., “When a customer places an order, check inventory. If available, ship item; if not, notify customer.”). The AI engine interprets this text and automatically generates a corresponding BPMN diagram with appropriate tasks, gateways, and flows.
-
Rapid Prototyping: This feature allows business analysts to quickly visualize ideas during brainstorming sessions, reducing the time spent on manual shape placement and connection.
2. Intelligent Validation and Compliance
One of the challenges in BPMN is ensuring syntactical correctness according to the strict BPMN 2.0 specification. Visual Paradigm provides real-time validation:
-
Error Detection: The tool automatically flags common modeling errors, such as missing end events, disconnected flows, or incorrect use of gateways.
-
Best Practice Checks: It can suggest improvements based on industry best practices, ensuring that diagrams are not only valid but also readable and standardized.
3. Seamless Integration with Development and Documentation
Visual Paradigm bridges the gap between business modeling and technical implementation:
-
Code Generation: For technical teams, BPMN diagrams can be used to generate skeleton code or configuration files for workflow engines, reducing manual coding efforts.
-
Documentation Automation: The platform can automatically generate comprehensive process documentation from the diagrams, including descriptions of each task, role responsibilities, and data inputs/outputs. This ensures that documentation stays synchronized with the visual model.
4. Collaboration and Version Control
Enterprise processes often involve multiple stakeholders. Visual Paradigm supports:
-
Team Collaboration: Multiple users can work on the same project, with features for commenting, reviewing, and approving diagrams.
-
Version History: Track changes over time, allowing teams to revert to previous versions if needed and understand the evolution of a process.
5. Simulation and Analysis
Beyond static modeling, Visual Paradigm offers simulation capabilities:
-
Process Simulation: Users can simulate process execution to identify bottlenecks, calculate cycle times, and analyze resource utilization. This helps in optimizing processes before they are implemented in the real world.
-
What-If Analysis: Test different scenarios (e.g., “What if we add another approver?”) to see the impact on process efficiency.
Summary of Benefits
| Feature | Benefit |
|---|---|
| AI Text-to-Diagram | Reduces initial modeling time; converts informal requirements into structured visuals instantly. |
| Real-Time Validation | Ensures BPMN 2.0 compliance; prevents logical errors before implementation. |
| Auto-Documentation | Keeps process documentation up-to-date without manual effort. |
| Simulation | Identifies bottlenecks and inefficiencies proactively. |
| Integration | Bridges the gap between business analysts and developers through code generation and standard exports. |
By leveraging tools like Visual Paradigm with AI assistance, organizations can move beyond simple diagramming to intelligent process management, ensuring that BPMN models are accurate, actionable, and aligned with business goals.