


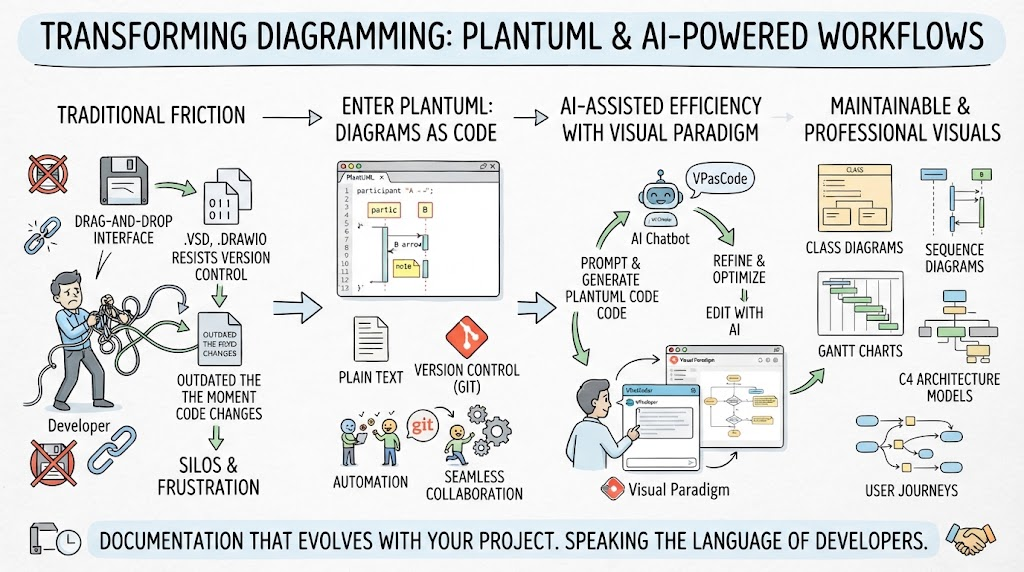
Why PlantUML for Diagram as Code? What Are the Benefits?
PlantUML is an open-source tool that allows you to create UML diagrams from plain text descriptions. Here are the key benefits:
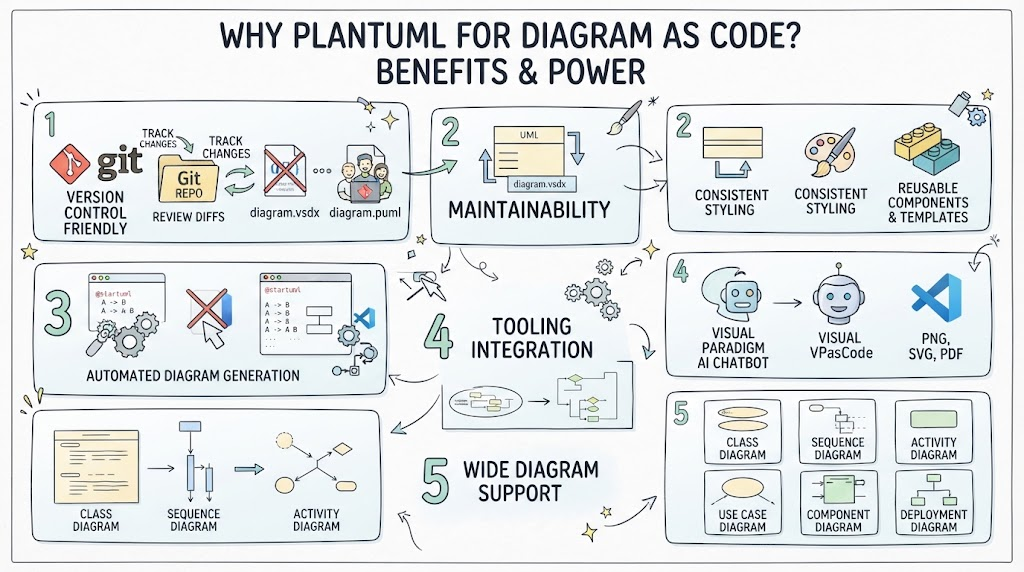
1. Version Control Friendly
-
Text-based diagrams can be stored in Git repositories
-
Easy to track changes, review diffs, and collaborate
-
No binary files that are hard to merge
2. Maintainability
-
Easy to update and modify diagrams
-
Consistent styling across all diagrams
-
Reusable components and templates
3. Developer-Centric
-
Write diagrams in code (no drag-and-drop)
-
Integrates with IDEs and documentation tools
-
Automated diagram generation from code
4. Tooling Integration
-
Works with Visual Paradigm AI Chatbot for intelligent diagram suggestions
-
VPasCode provides enhanced editing experience
-
Supports multiple output formats (PNG, SVG, PDF)
5. Wide Diagram Support
-
Class diagrams, sequence diagrams, activity diagrams
-
Use case diagrams, component diagrams, deployment diagrams
-
And many more specialized diagram types
Tooling: Visual Paradigm AI Chatbot + VPasCode
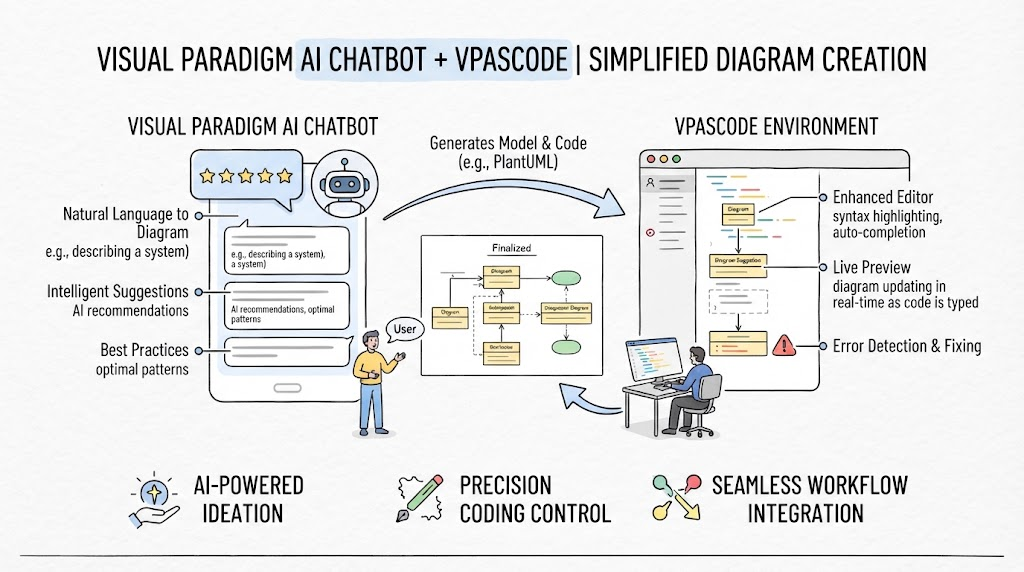
Visual Paradigm AI Chatbot
-
Intelligent Suggestions: Get AI-powered recommendations for diagram structures
-
Natural Language to Diagram: Describe your system in plain English, get PlantUML code
-
Best Practices: Learn optimal diagram patterns and conventions
VPasCode
-
Enhanced Editor: Syntax highlighting, auto-completion, error detection
-
Live Preview: See your diagram update in real-time as you type
-
Integration: Seamlessly works with Visual Paradigm’s full suite of modeling tools
PlantUML Diagram Examples
1. Class Diagram
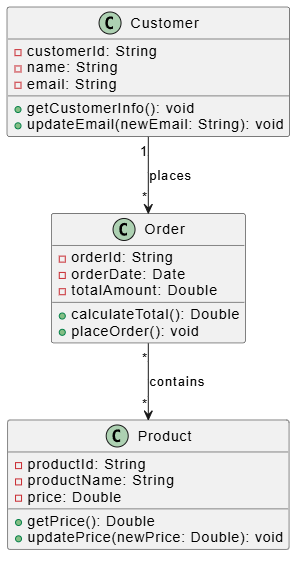
@startuml
class Customer {
    -customerId: String
    -name: String
    -email: String
    +getCustomerInfo(): void
    +updateEmail(newEmail: String): void
}

class Order {
    -orderId: String
    -orderDate: Date
    -totalAmount: Double
    +calculateTotal(): Double
    +placeOrder(): void
}

class Product {
    -productId: String
    -productName: String
    -price: Double
    +getPrice(): Double
    +updatePrice(newPrice: Double): void
}

Customer "1" --> "*" Order : places
Order "*" --> "*" Product : contains
@enduml
2. Sequence Diagram
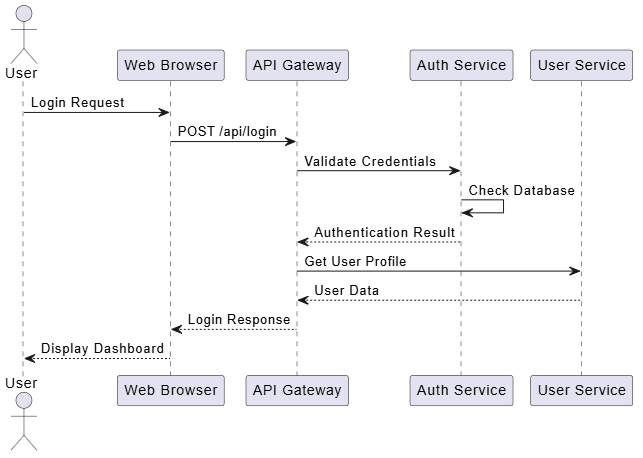
@startuml
actor User
participant "Web Browser" as Browser
participant "API Gateway" as Gateway
participant "Auth Service" as Auth
participant "User Service" as UserService

User -> Browser : Login Request
Browser -> Gateway : POST /api/login
Gateway -> Auth : Validate Credentials
Auth -> Auth : Check Database
Auth --> Gateway : Authentication Result
Gateway -> UserService : Get User Profile
UserService --> Gateway : User Data
Gateway --> Browser : Login Response
Browser --> User : Display Dashboard
@enduml
3. Activity Diagram
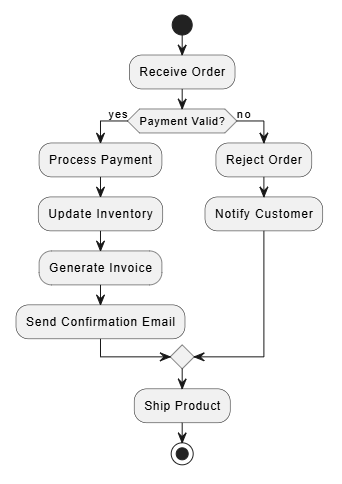
@startuml
start
:Receive Order;
if (Payment Valid?) then (yes)
  :Process Payment;
  :Update Inventory;
  :Generate Invoice;
  :Send Confirmation Email;
else (no)
  :Reject Order;
  :Notify Customer;
endif
:Ship Product;
stop
@enduml
4. Use Case Diagram
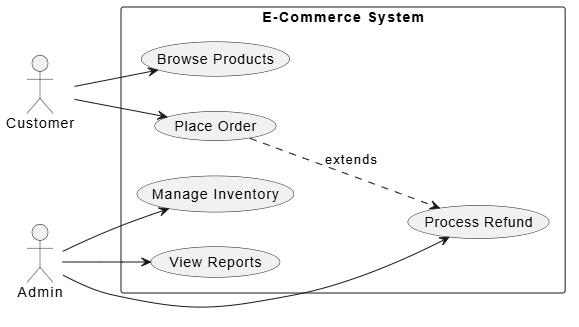
@startuml
left to right direction
actor "Customer" as Customer
actor "Admin" as Admin

rectangle "E-Commerce System" {
  usecase "Browse Products" as UC1
  usecase "Place Order" as UC2
  usecase "Manage Inventory" as UC3
  usecase "View Reports" as UC4
  usecase "Process Refund" as UC5
}

Customer --> UC1
Customer --> UC2
Admin --> UC3
Admin --> UC4
Admin --> UC5
UC2 ..> UC5 : extends
@enduml
5. Component Diagram
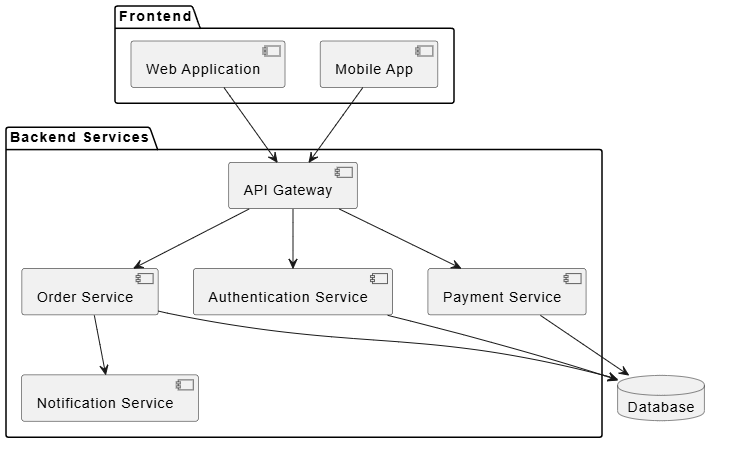
@startuml
package "Frontend" {
  [Web Application] as WebApp
  [Mobile App] as MobileApp
}

package "Backend Services" {
  [API Gateway] as Gateway
  [Authentication Service] as AuthService
  [Order Service] as OrderService
  [Payment Service] as PaymentService
  [Notification Service] as NotificationService
}

database "Database" as DB

WebApp --> Gateway
MobileApp --> Gateway
Gateway --> AuthService
Gateway --> OrderService
Gateway --> PaymentService
OrderService --> NotificationService
AuthService --> DB
OrderService --> DB
PaymentService --> DB
@enduml
6. Deployment Diagram
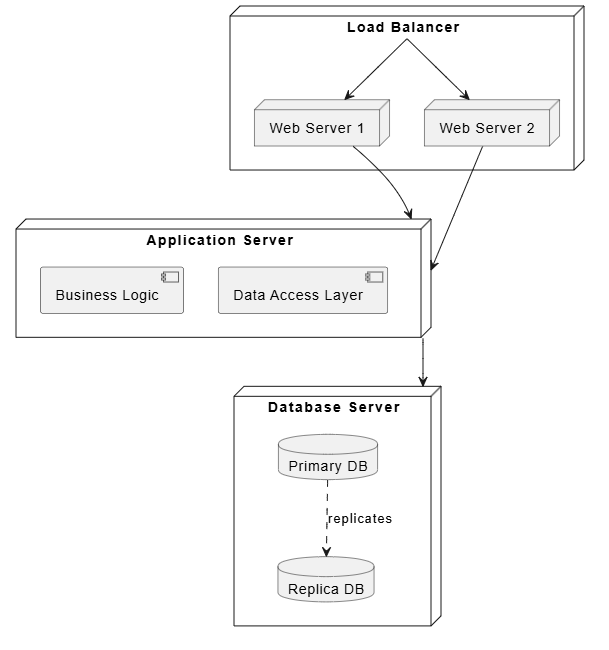
@startuml
node "Load Balancer" as LB {
  node "Web Server 1" as WS1
  node "Web Server 2" as WS2
}

node "Application Server" as AppServer {
  component "Business Logic" as BL
  component "Data Access Layer" as DAL
}

node "Database Server" as DBServer {
  database "Primary DB" as PrimaryDB
  database "Replica DB" as ReplicaDB
}

LB --> WS1
LB --> WS2
WS1 --> AppServer
WS2 --> AppServer
AppServer --> DBServer
PrimaryDB ..> ReplicaDB : replicates
@enduml
7. State Diagram
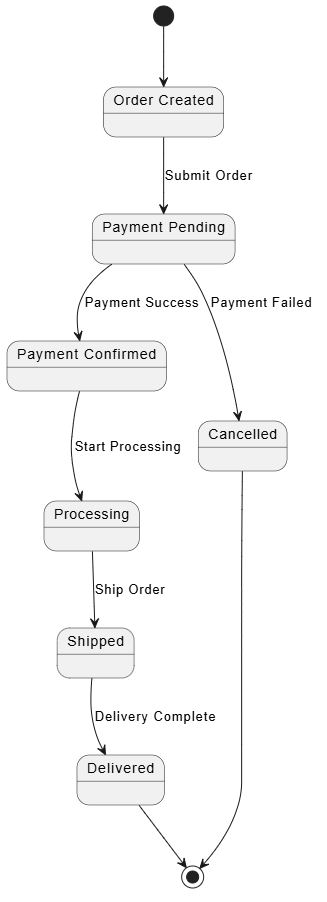
@startuml
state "Order Created" as Created
state "Payment Pending" as PaymentPending
state "Payment Confirmed" as PaymentConfirmed
state "Processing" as Processing
state "Shipped" as Shipped
state "Delivered" as Delivered
state "Cancelled" as Cancelled

[*] --> Created
Created --> PaymentPending : Submit Order
PaymentPending --> PaymentConfirmed : Payment Success
PaymentPending --> Cancelled : Payment Failed
PaymentConfirmed --> Processing : Start Processing
Processing --> Shipped : Ship Order
Shipped --> Delivered : Delivery Complete
Cancelled --> [*]
Delivered --> [*]
@enduml
8. Object Diagram
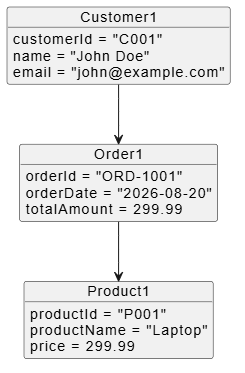
@startuml
object Customer1 {
  customerId = "C001"
  name = "John Doe"
  email = "[email protected]"
}

object Order1 {
  orderId = "ORD-1001"
  orderDate = "2026-08-20"
  totalAmount = 299.99
}

object Product1 {
  productId = "P001"
  productName = "Laptop"
  price = 299.99
}

Customer1 --> Order1
Order1 --> Product1
@enduml
9. Timing Diagram
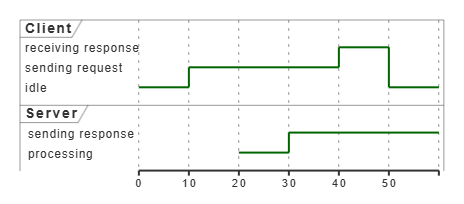
@startuml
robust "Client" as Client
robust "Server" as Server

@0
Client is idle
@10
Client is "sending request"
@20
Server is processing
@30
Server is "sending response"
@40
Client is "receiving response"
@50
Client is idle
@enduml
10. Mind Map
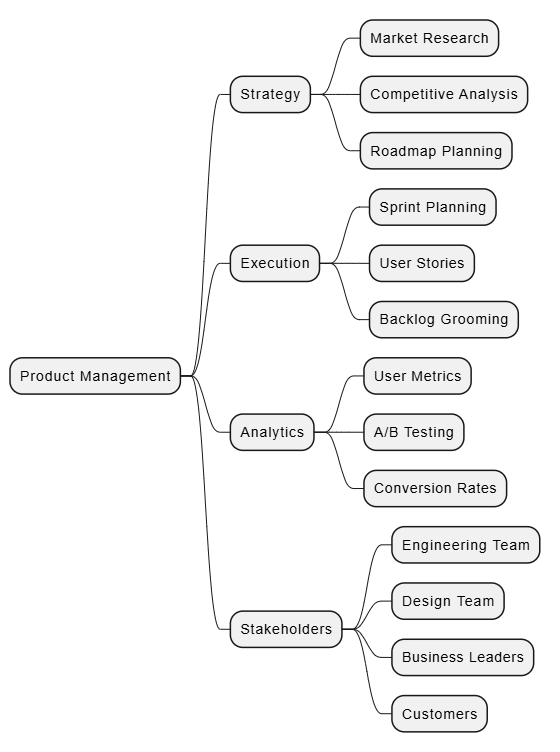
@startmindmap
* Product Management
** Strategy
*** Market Research
*** Competitive Analysis
*** Roadmap Planning
** Execution
*** Sprint Planning
*** User Stories
*** Backlog Grooming
** Analytics
*** User Metrics
*** A/B Testing
*** Conversion Rates
** Stakeholders
*** Engineering Team
*** Design Team
*** Business Leaders
*** Customers
@endmindmap
11. Wireframe (Salt)
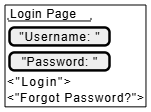
@startsalt
{+
  {"Login Page"
    ["Username: "]
    ["Password: "]
    <"Login">
    <"Forgot Password?">
  }
}
@endsalt
12. Network Diagram
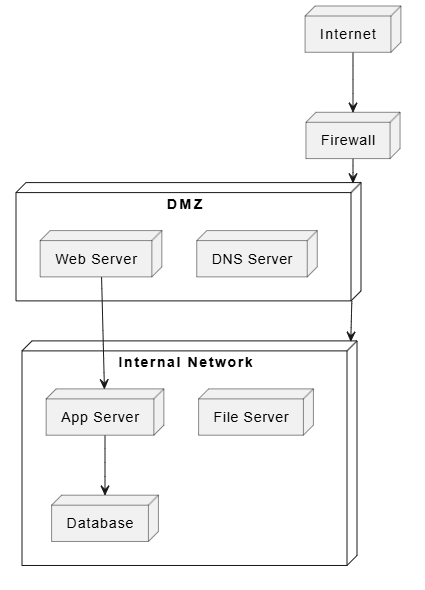
@startuml
node "Internet" as Internet
node "Firewall" as FW
node "DMZ" as DMZ {
  node "Web Server" as WS
  node "DNS Server" as DNS
}
node "Internal Network" as Internal {
  node "App Server" as AppSrv
  node "Database" as DB
  node "File Server" as FileSrv
}

Internet --> FW
FW --> DMZ
DMZ --> Internal
WS --> AppSrv
AppSrv --> DB
@enduml
13. Gantt Chart
@startgantt
title Project Timeline

projectstarts 2026-09-01

-- Planning --
[Requirements Gathering] starts 2026-09-01 and lasts 10 days
[Design Phase] starts 2026-09-11 and lasts 14 days

-- Development --
[Backend Development] starts 2026-09-25 and lasts 20 days
[Frontend Development] starts 2026-09-25 and lasts 18 days

-- Testing --
[Unit Testing] starts 2026-10-15 and lasts 10 days
[Integration Testing] starts 2026-10-25 and lasts 7 days

-- Deployment --
[Production Deploy] starts 2026-11-01 and lasts 3 days
@endgantt
14. Entity Relationship Diagram
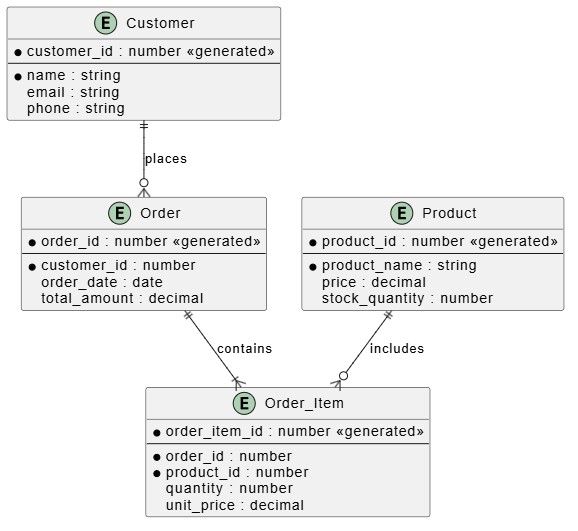
@startuml
entity "Customer" as Customer {
  * customer_id : number <<generated>>
  --
  * name : string
  email : string
  phone : string
}

entity "Order" as Order {
  * order_id : number <<generated>>
  --
  * customer_id : number
  order_date : date
  total_amount : decimal
}

entity "Product" as Product {
  * product_id : number <<generated>>
  --
  * product_name : string
  price : decimal
  stock_quantity : number
}

entity "Order_Item" as OrderItem {
  * order_item_id : number <<generated>>
  --
  * order_id : number
  * product_id : number
  quantity : number
  unit_price : decimal
}

Customer ||--o{ Order : places
Order ||--|{ OrderItem : contains
Product ||--o{ OrderItem : includes
@enduml
15. Architecture Diagram (C4 Model Style)
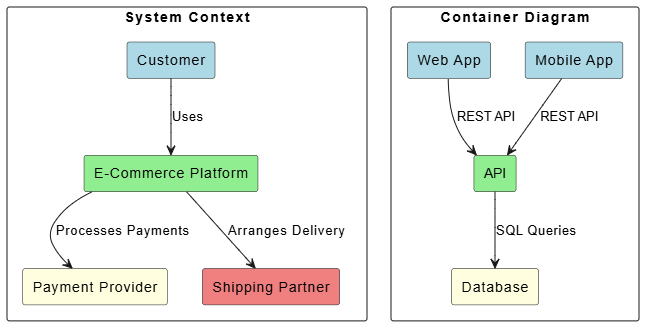
@startuml
skinparam backgroundColor white
skinparam rectangleBackgroundColor white

rectangle "System Context" {
  rectangle "Customer" as Customer #LightBlue
  rectangle "E-Commerce Platform" as Platform #LightGreen
  rectangle "Payment Provider" as Payment #LightYellow
  rectangle "Shipping Partner" as Shipping #LightCoral
}

Customer --> Platform : Uses
Platform --> Payment : Processes Payments
Platform --> Shipping : Arranges Delivery

rectangle "Container Diagram" {
  rectangle "Web App" as WebApp #LightBlue
  rectangle "Mobile App" as MobileApp #LightBlue
  rectangle "API" as API #LightGreen
  rectangle "Database" as DB #LightYellow
}

WebApp --> API : REST API
MobileApp --> API : REST API
API --> DB : SQL Queries
@enduml
Best Practices
1. Keep Diagrams Simple
-
Focus on one aspect per diagram
-
Avoid overcrowding with too many elements
2. Use Consistent Naming
-
Follow naming conventions throughout your diagrams
-
Use meaningful names for classes, actors, and components
3. Document Your Diagrams
-
Add titles and descriptions
-
Use notes for additional context
4. Modularize Complex Systems
-
Break down large systems into smaller, manageable diagrams
-
Use package grouping for organization
5. Leverage AI Tools
-
Use Visual Paradigm AI Chatbot for initial diagram structure
-
Refine and customize with VPasCode
6. Version Control
-
Commit PlantUML files to Git
-
Use meaningful commit messages describing diagram changes
Getting Started with Visual Paradigm + VPasCode
-
Install Visual Paradigm with VPasCode plugin
-
Create a new PlantUML file (.puml extension)
-
Start typing your diagram code
-
Use AI Chatbot for suggestions by describing your system
-
Preview in real-time as you edit
-
Export to your desired format (PNG, SVG, PDF)
Conclusion
PlantUML combined with Visual Paradigm AI Chatbot and VPasCode provides a powerful, developer-friendly approach to creating professional diagrams. The text-based nature ensures maintainability, version control compatibility, and easy collaboration, while the AI-powered tools accelerate diagram creation and ensure best practices.
Whether you’re documenting software architecture, planning projects, or communicating system designs, PlantUML offers a comprehensive solution that scales with your needs.
This post is also available in Deutsch, Español, فارسی, Français, English, Bahasa Indonesia, 日本語, Polski, Portuguese, Ру́сский, Việt Nam, 简体中文 and 繁體中文.