


Introduction
In the complex landscape of systems analysis, clear communication is paramount. A picture is often worth a thousand words, and nowhere is this truer than in system modeling. The Data Flow Diagram (DFD) remains one of the most effective traditional methods for visualizing information flows within a system. Whether manual, automated, or hybrid, a well-crafted DFD depicts system requirements graphically, showing how data enters, leaves, transforms, and persists
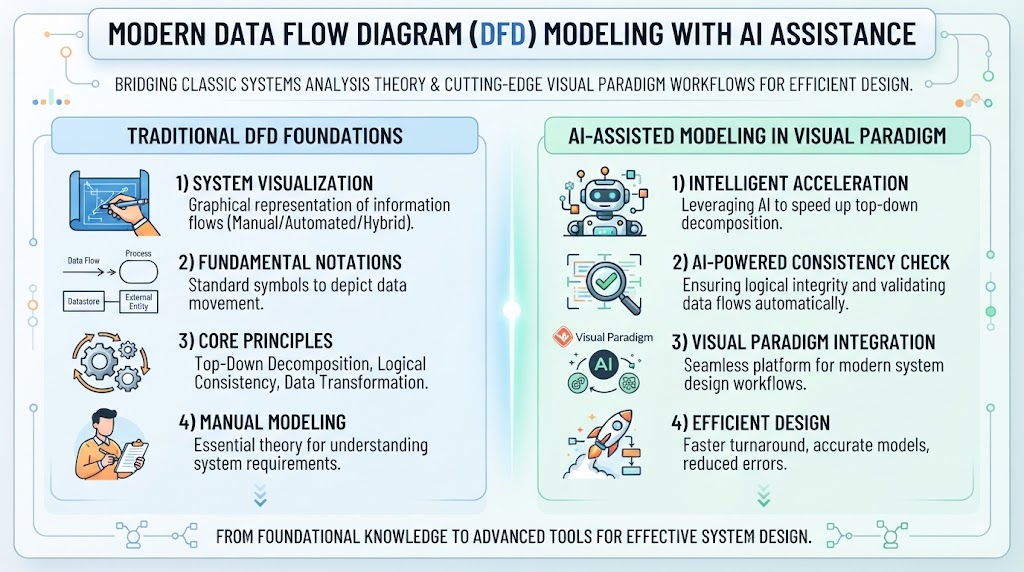
However, the methodology of creating DFDs has evolved. While understanding the fundamental notations and manual drawing techniques is essential for any analyst, modern workflows now leverage Artificial Intelligence to accelerate top-down decomposition and ensure logical consistency. This comprehensive guide bridges the gap between classic DFD theory and cutting-edge AI-assisted modeling using Visual Paradigm, providing you with both the foundational knowledge and the advanced tools necessary for effective system design.
Part 1: Understanding DFD Fundamentals
What is a Data Flow Diagram?
A Data Flow Diagram (DFD) is a graphical representation of the “flow” of data through an information system. Its primary purpose is to show the scope and boundaries of a system as a whole. It serves as a vital communication tool between systems analysts and stakeholders, acting as a starting point for system redesign or development.
DFDs are hierarchical. They typically begin with a Context Diagram (Level 0), which represents the entire system as a single process interacting with external entities. Analysts then drill down into Level 1, Level 2, and beyond, decomposing major functions into finer details. While progression to levels 3 or 4 is possible, anything beyond Level 3 is rare; the depth of decomposition should always be dictated by functional complexity.
Core DFD Notations
Before drawing, one must master the four standard symbols used in DFDs:
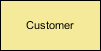
1. External Entity
Represents a human, system, or subsystem outside the boundary of the system being studied. It is the source or destination of data.
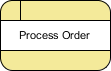
2. Process
A business activity or function where data manipulation and transformation occur. Processes can be decomposed into lower-level diagrams.
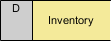
3. Data Store
Represents persistent data storage required or produced by processes (e.g., database tables, membership forms, files).
4. Data Flow
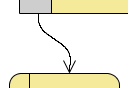
Represents the movement of information between entities, processes, and data stores. Direction is indicated by arrowheads.
Part 2: Traditional Manual DFD Creation
Understanding the manual workflow is crucial for validating AI-generated models and making precise adjustments. Below is a step-by-step guide to creating Context and Level 1 diagrams using Visual Paradigm.
How to Draw a Context-Level DFD
-
Select Diagram > New from the toolbar, choose Data Flow Diagram, and name it Context.
-
Drag a Process onto the canvas and name it System.

-
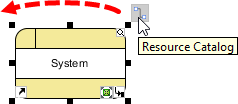
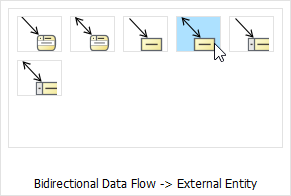
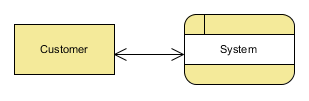
Hover over System, drag out the Resource Catalog button, and select Bidirectional Data Flow -> External Entity. Name it Customer.
-
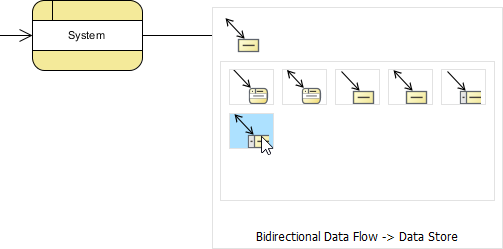
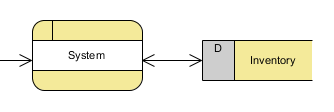
Use the Resource Catalog to create a Data Store connected to System with a bidirectional flow. Name it Inventory.
-
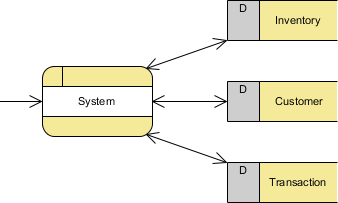
Add remaining data stores (Customer, Transaction) to complete the context view.
How to Draw a Level 1 DFD
-
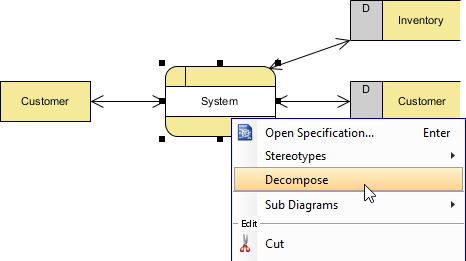
Right-click the System process in your Context diagram and select Decompose. Confirm adding connected entities/stores when prompted.
-
Rename the new diagram to Level 1 DFD.
-
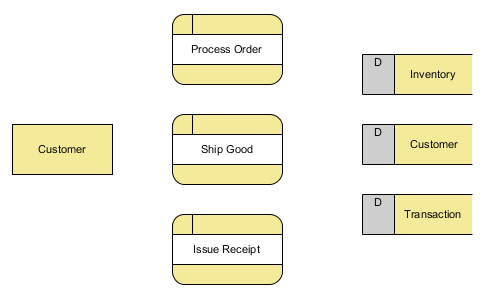
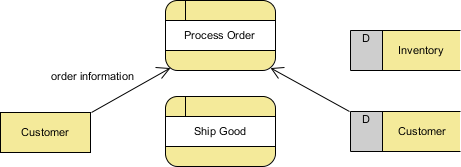
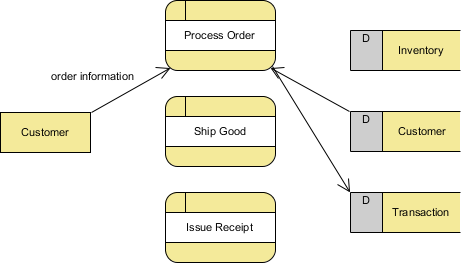
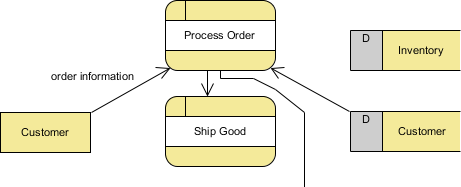
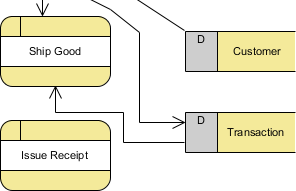
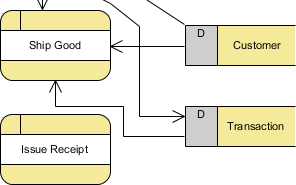
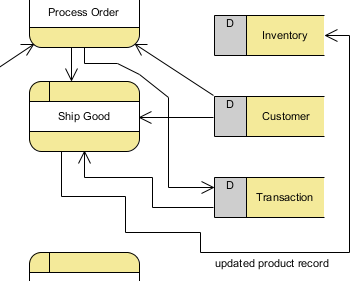
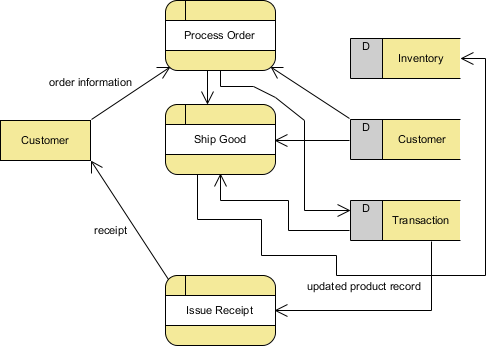
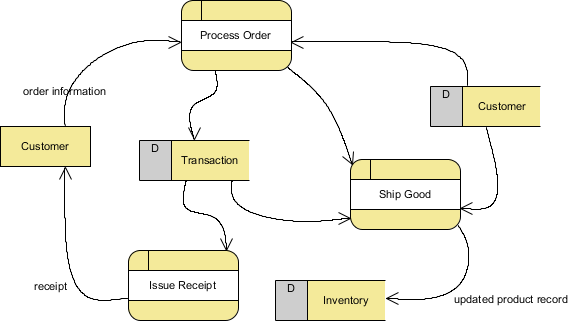
Create sub-processes (e.g., Process Order, Ship Good, Issue Receipt) in the center to elaborate on the original System process.
-
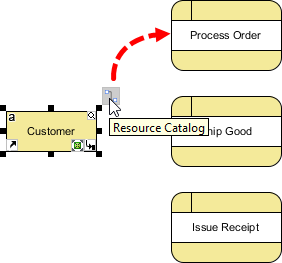
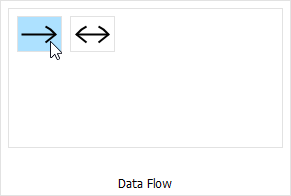
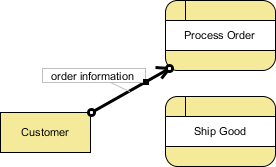
Connect elements using Data Flows. For example, connect Customer to Process Order labeled “order information.”
-
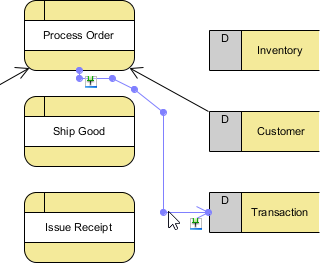
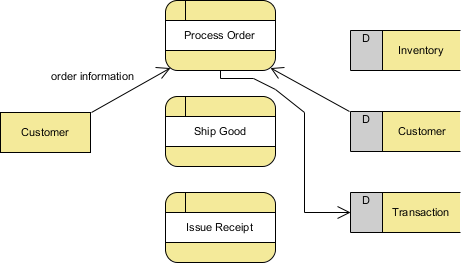
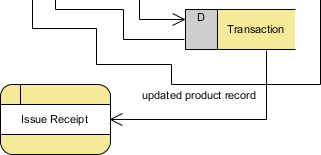
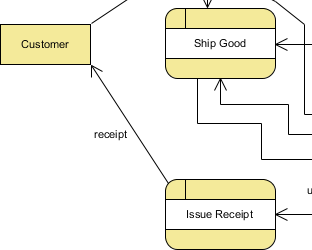
Continue wiring: Connect data stores to processes (e.g., Customer store to Process Order) and processes to each other (e.g., Process Order to Ship Good).
-
Finalize the Level 1 diagram layout.
Improving Readability
To prevent diagrams from looking rigid:
-
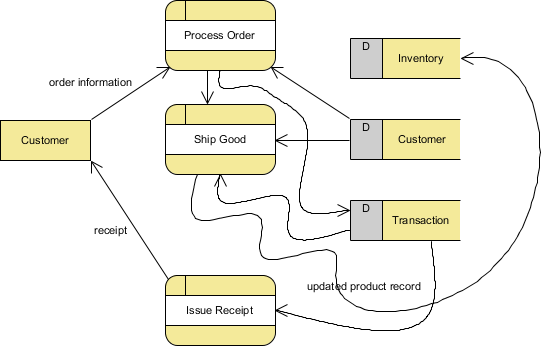
Right-click the diagram background, select Connectors > Curve.
-
Rearrange shapes to reduce clutter and improve visual flow.
Part 3: AI-Assisted Modeling Workflow
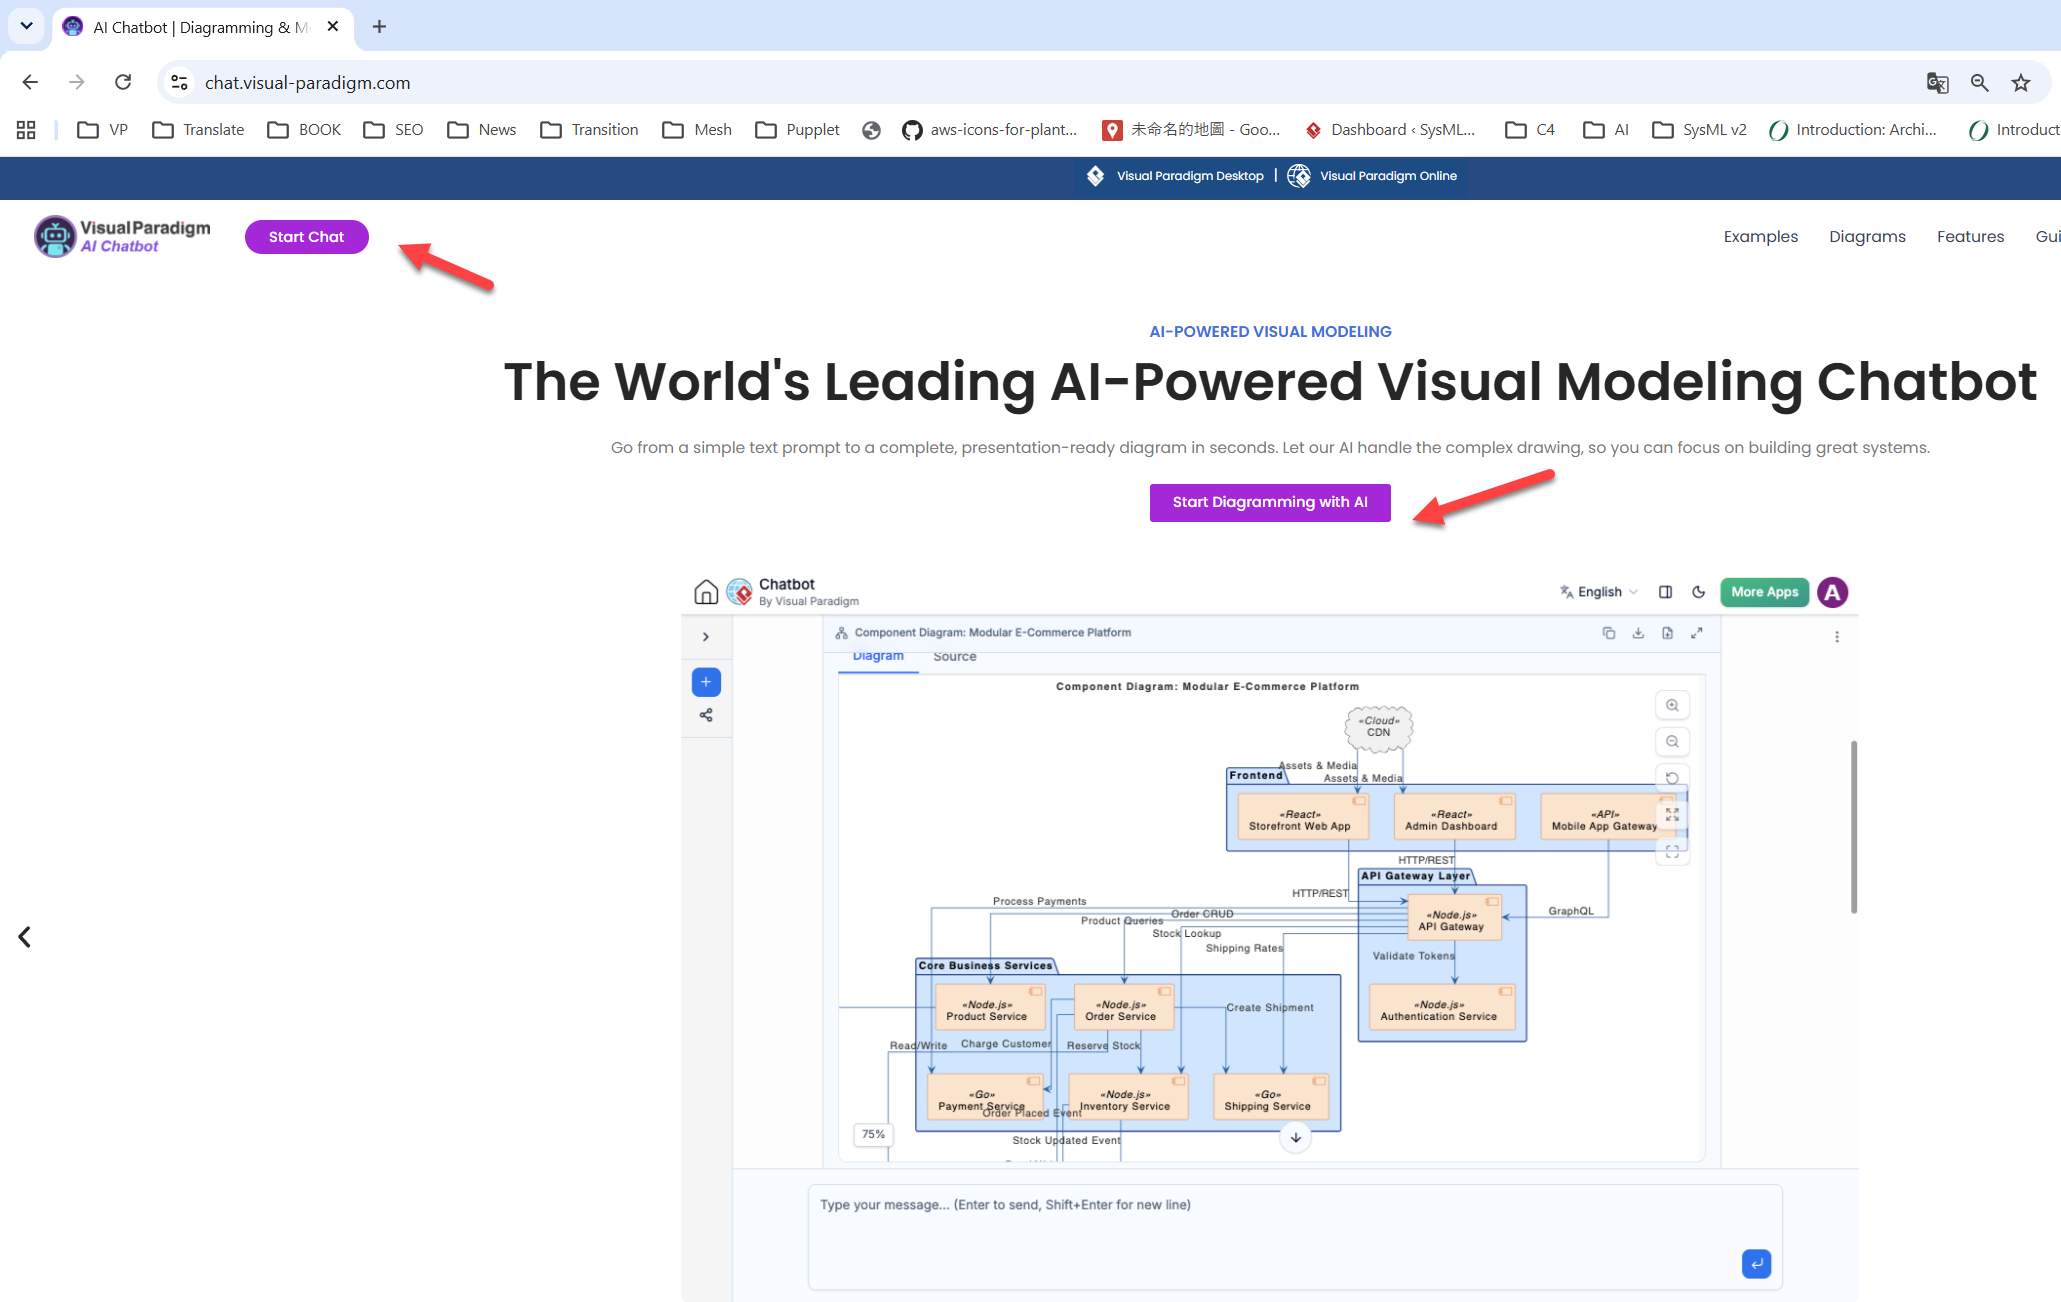
The Visual Paradigm AI Chatbot transforms DFD creation from a manual drawing task into a conversational design session. Using a “Diagram as Code” approach (Graphviz Dot), it allows for rapid generation, versioning, and intelligent decomposition.
Step 1: Initiating the AI Session
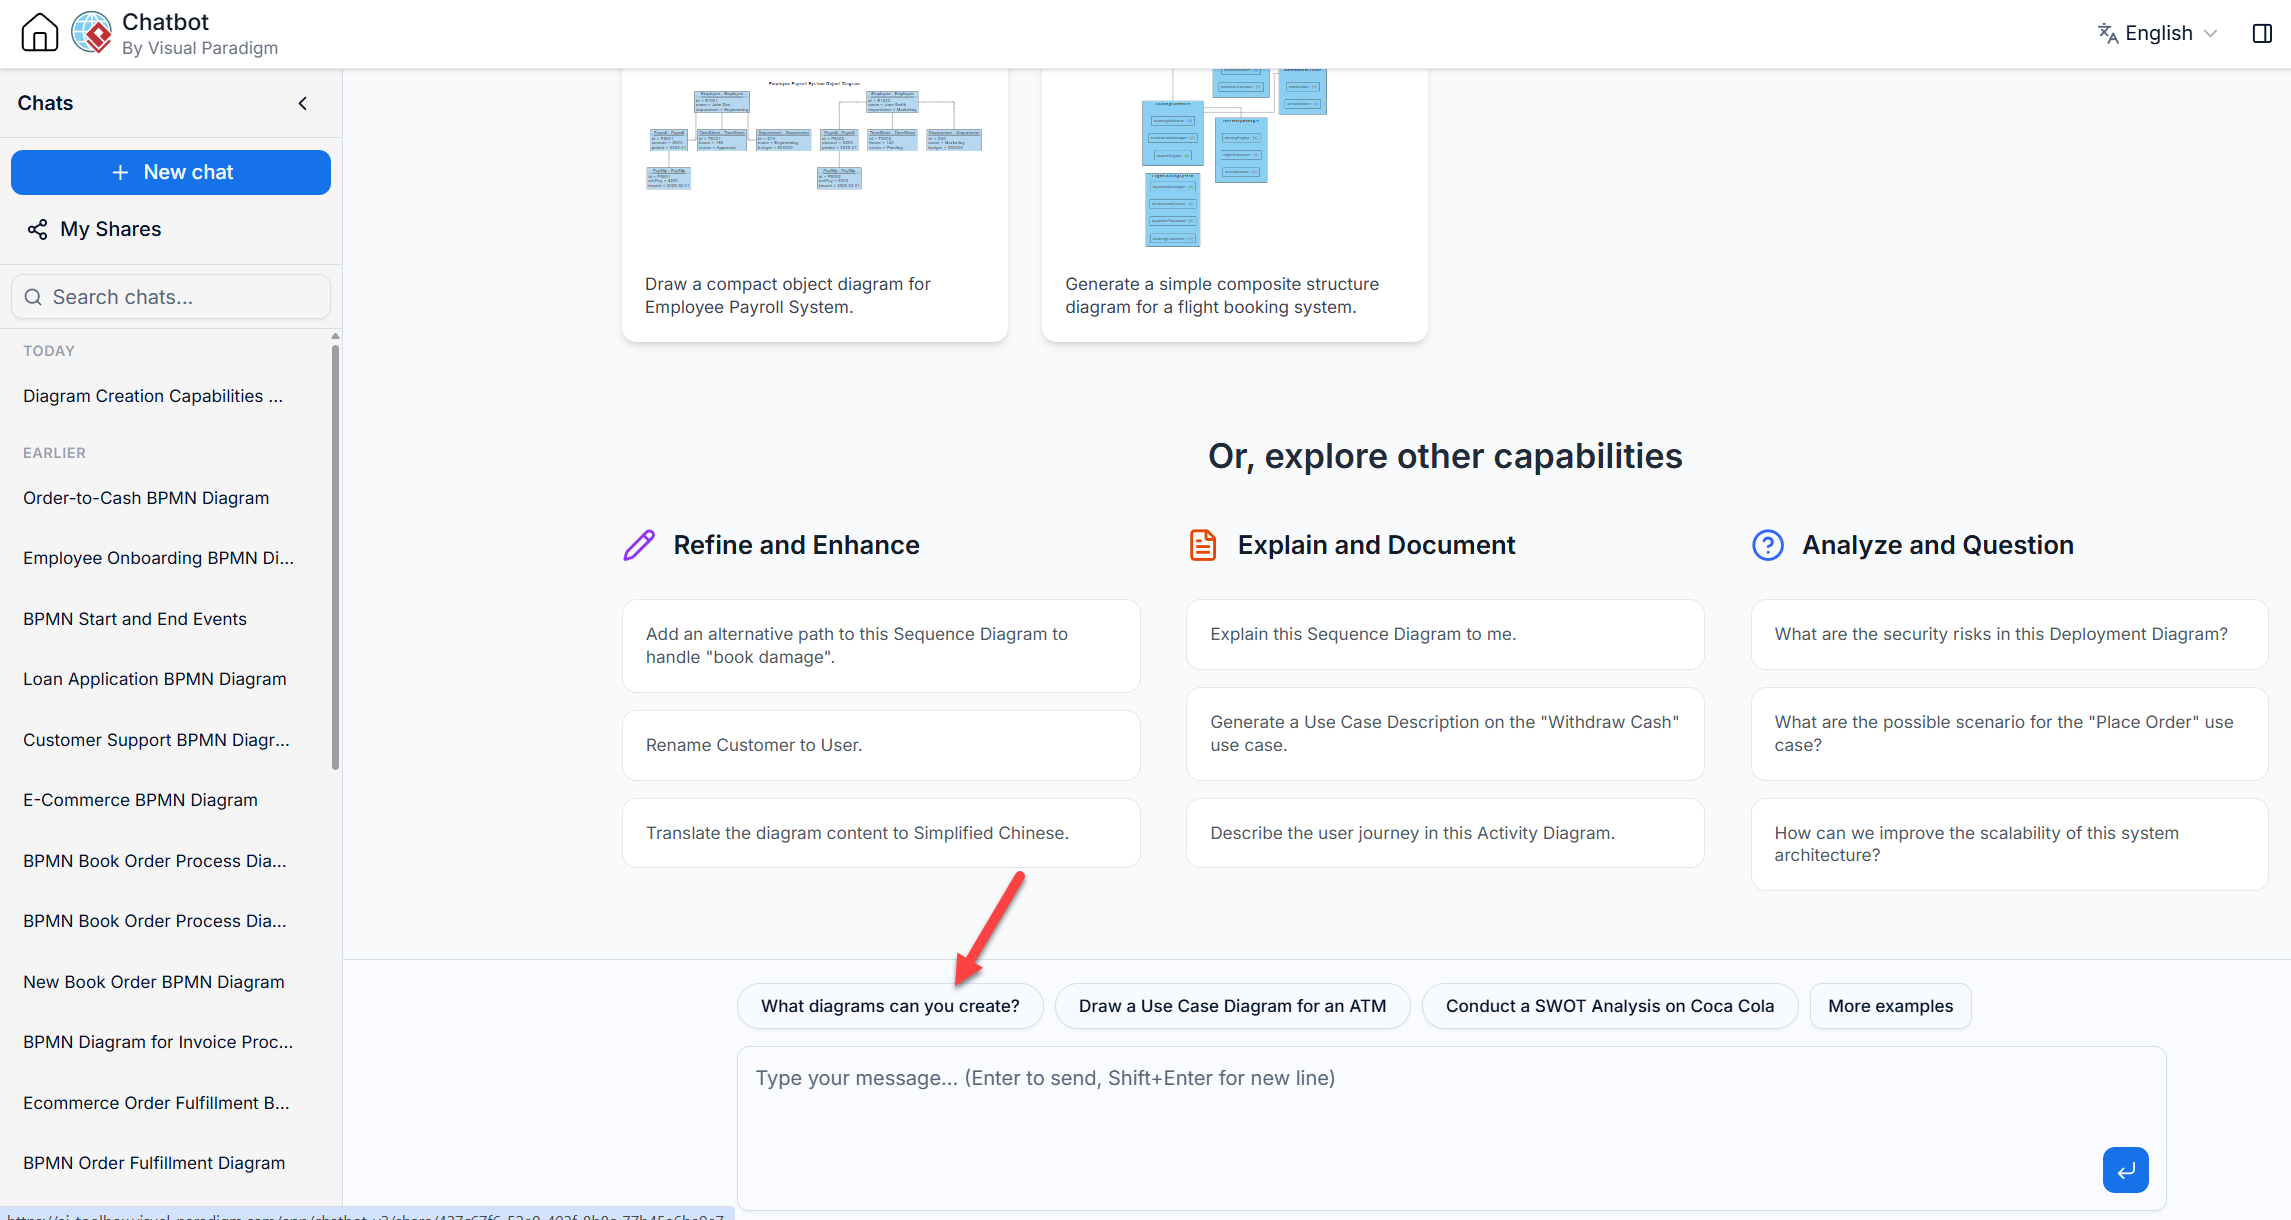
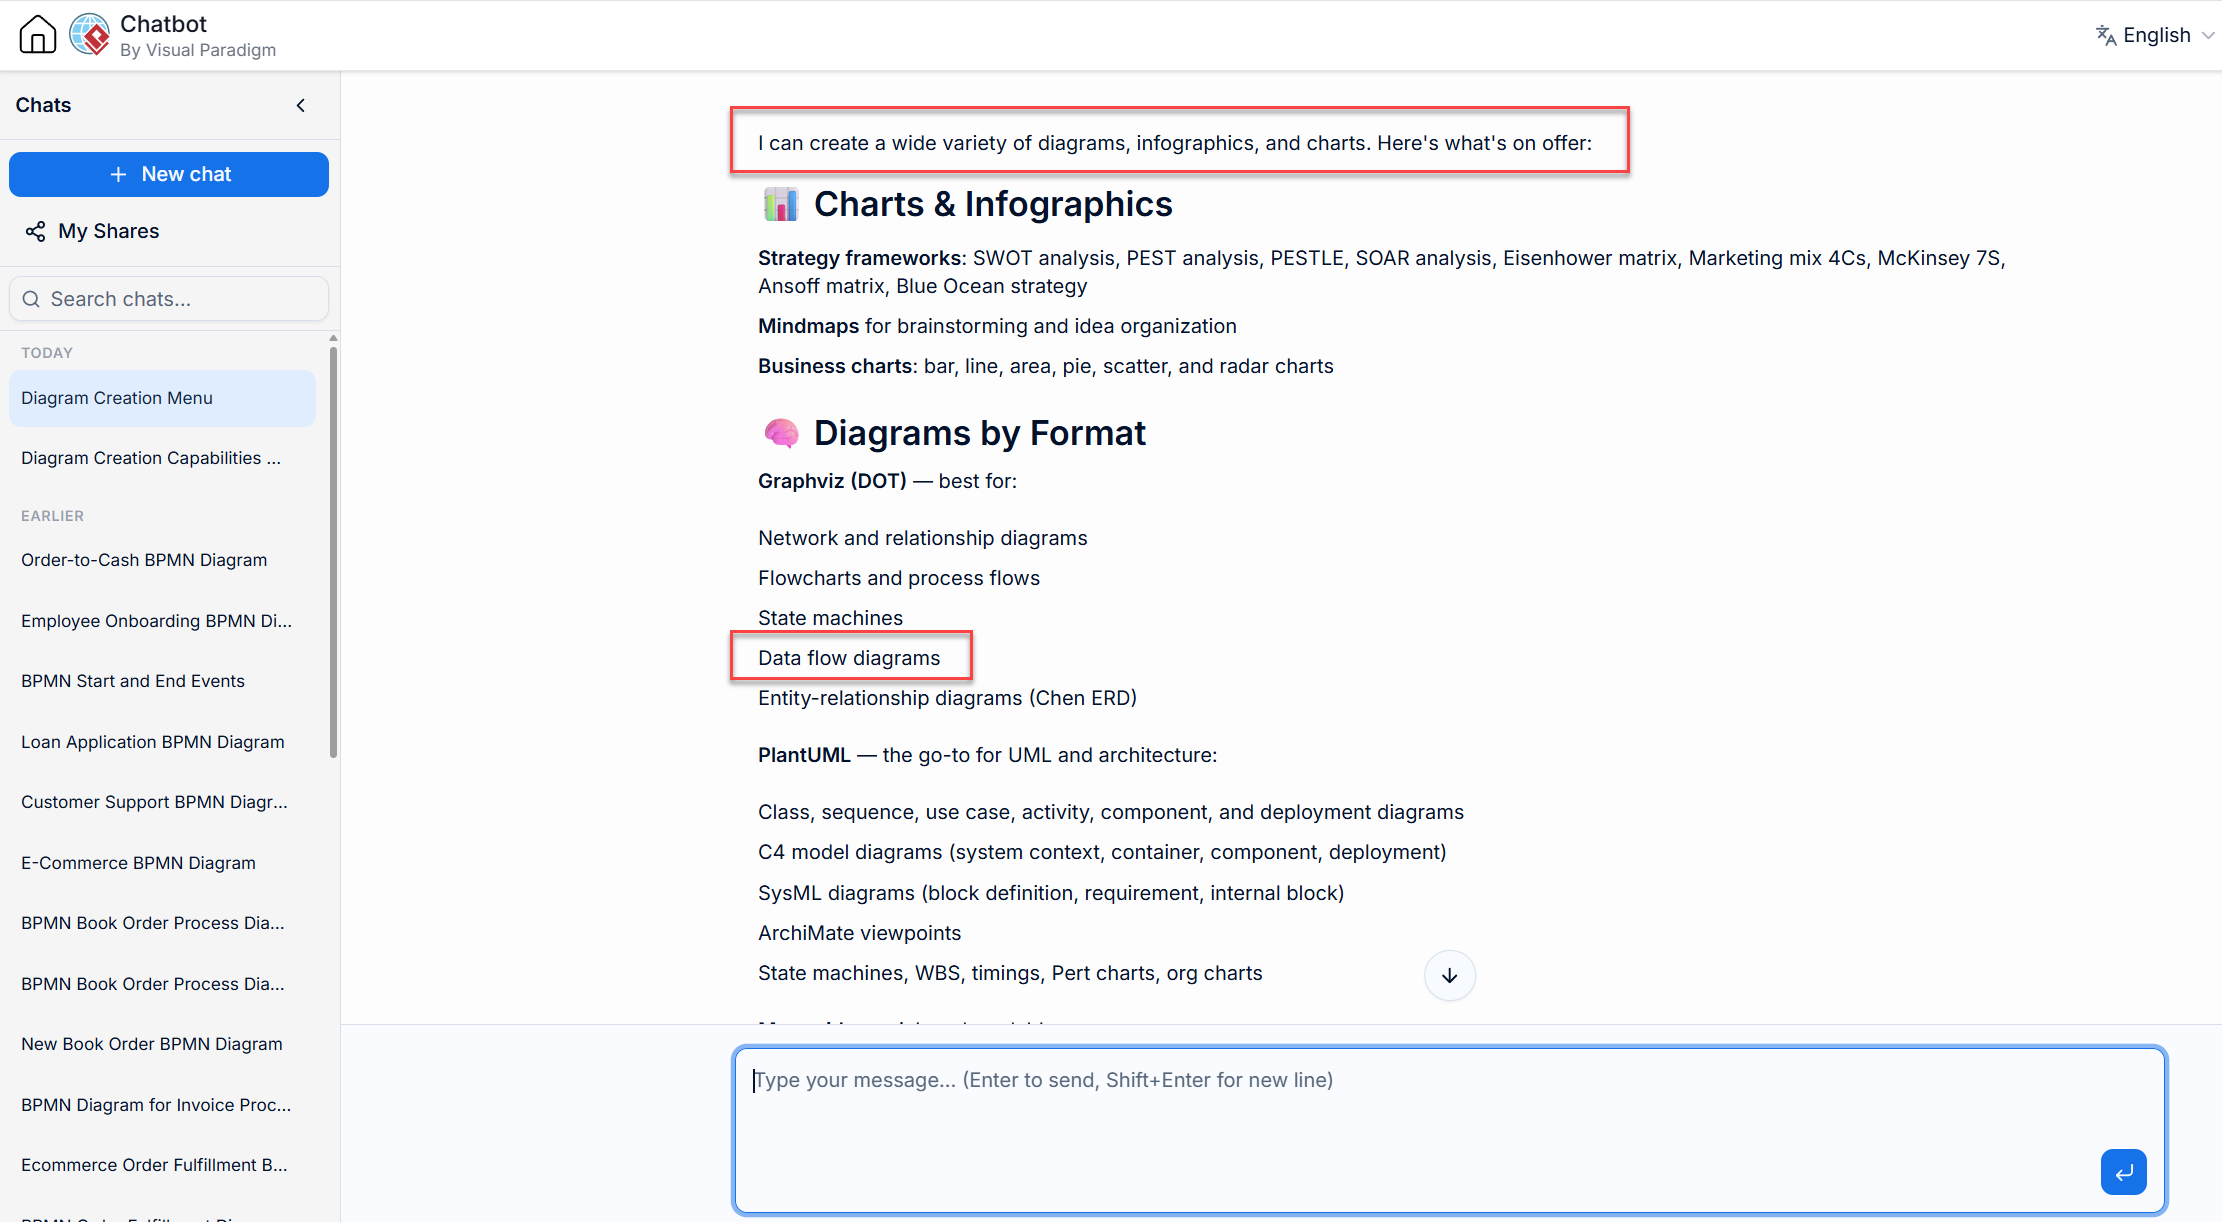
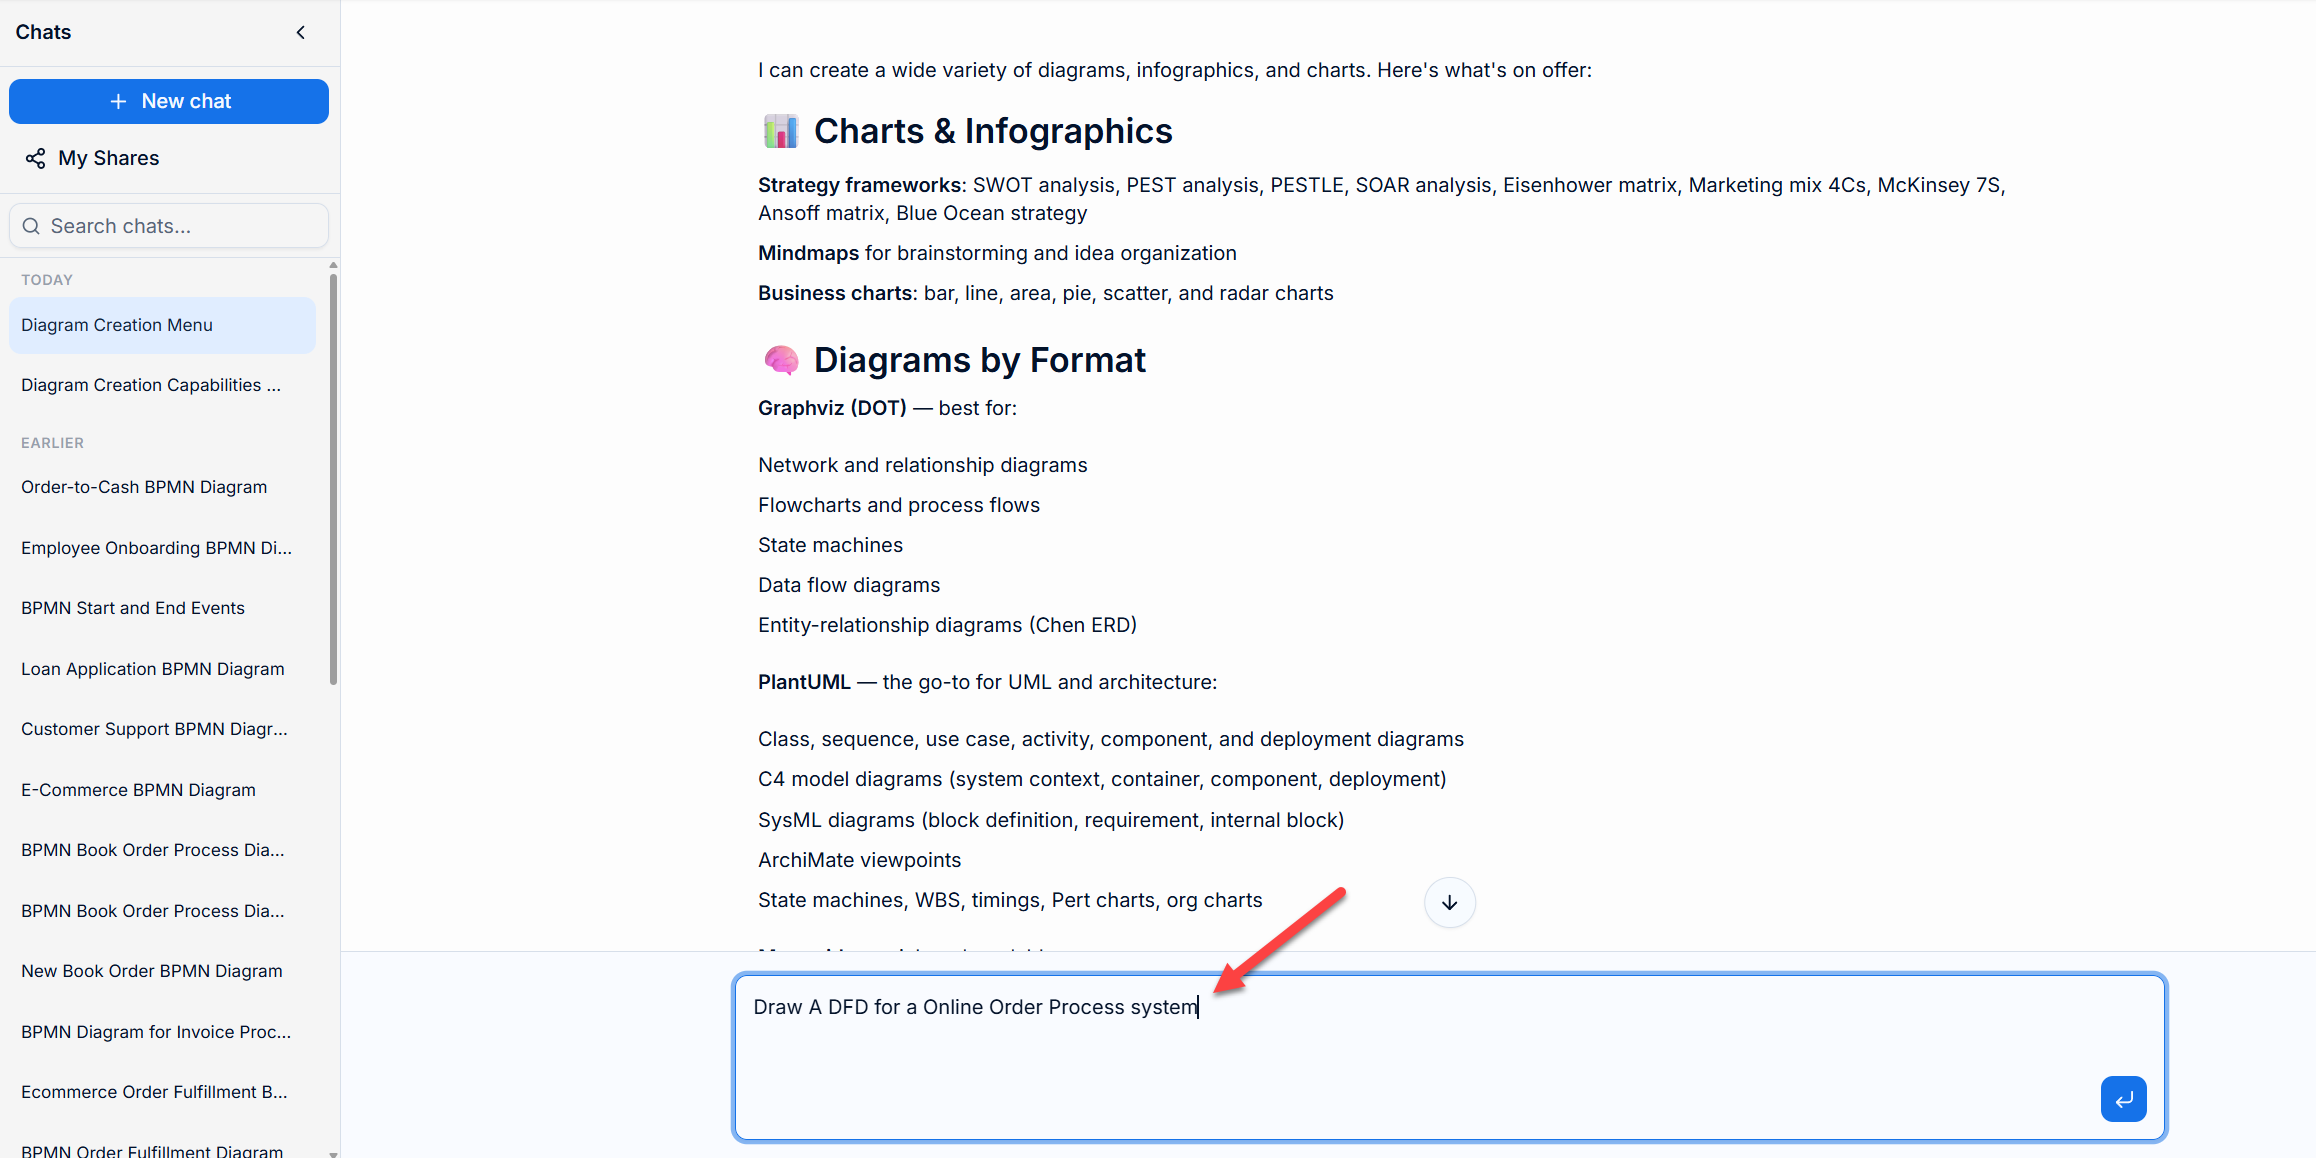
Access the VP AI Chatbot within your project. You can verify capabilities by asking, “What Diagram Can you Create?”
Step 2: Generating the Level 1 Foundation
Start with a broad prompt to establish boundaries and major processes.
Prompt: “Draw A DFD for a Online Order Process system”
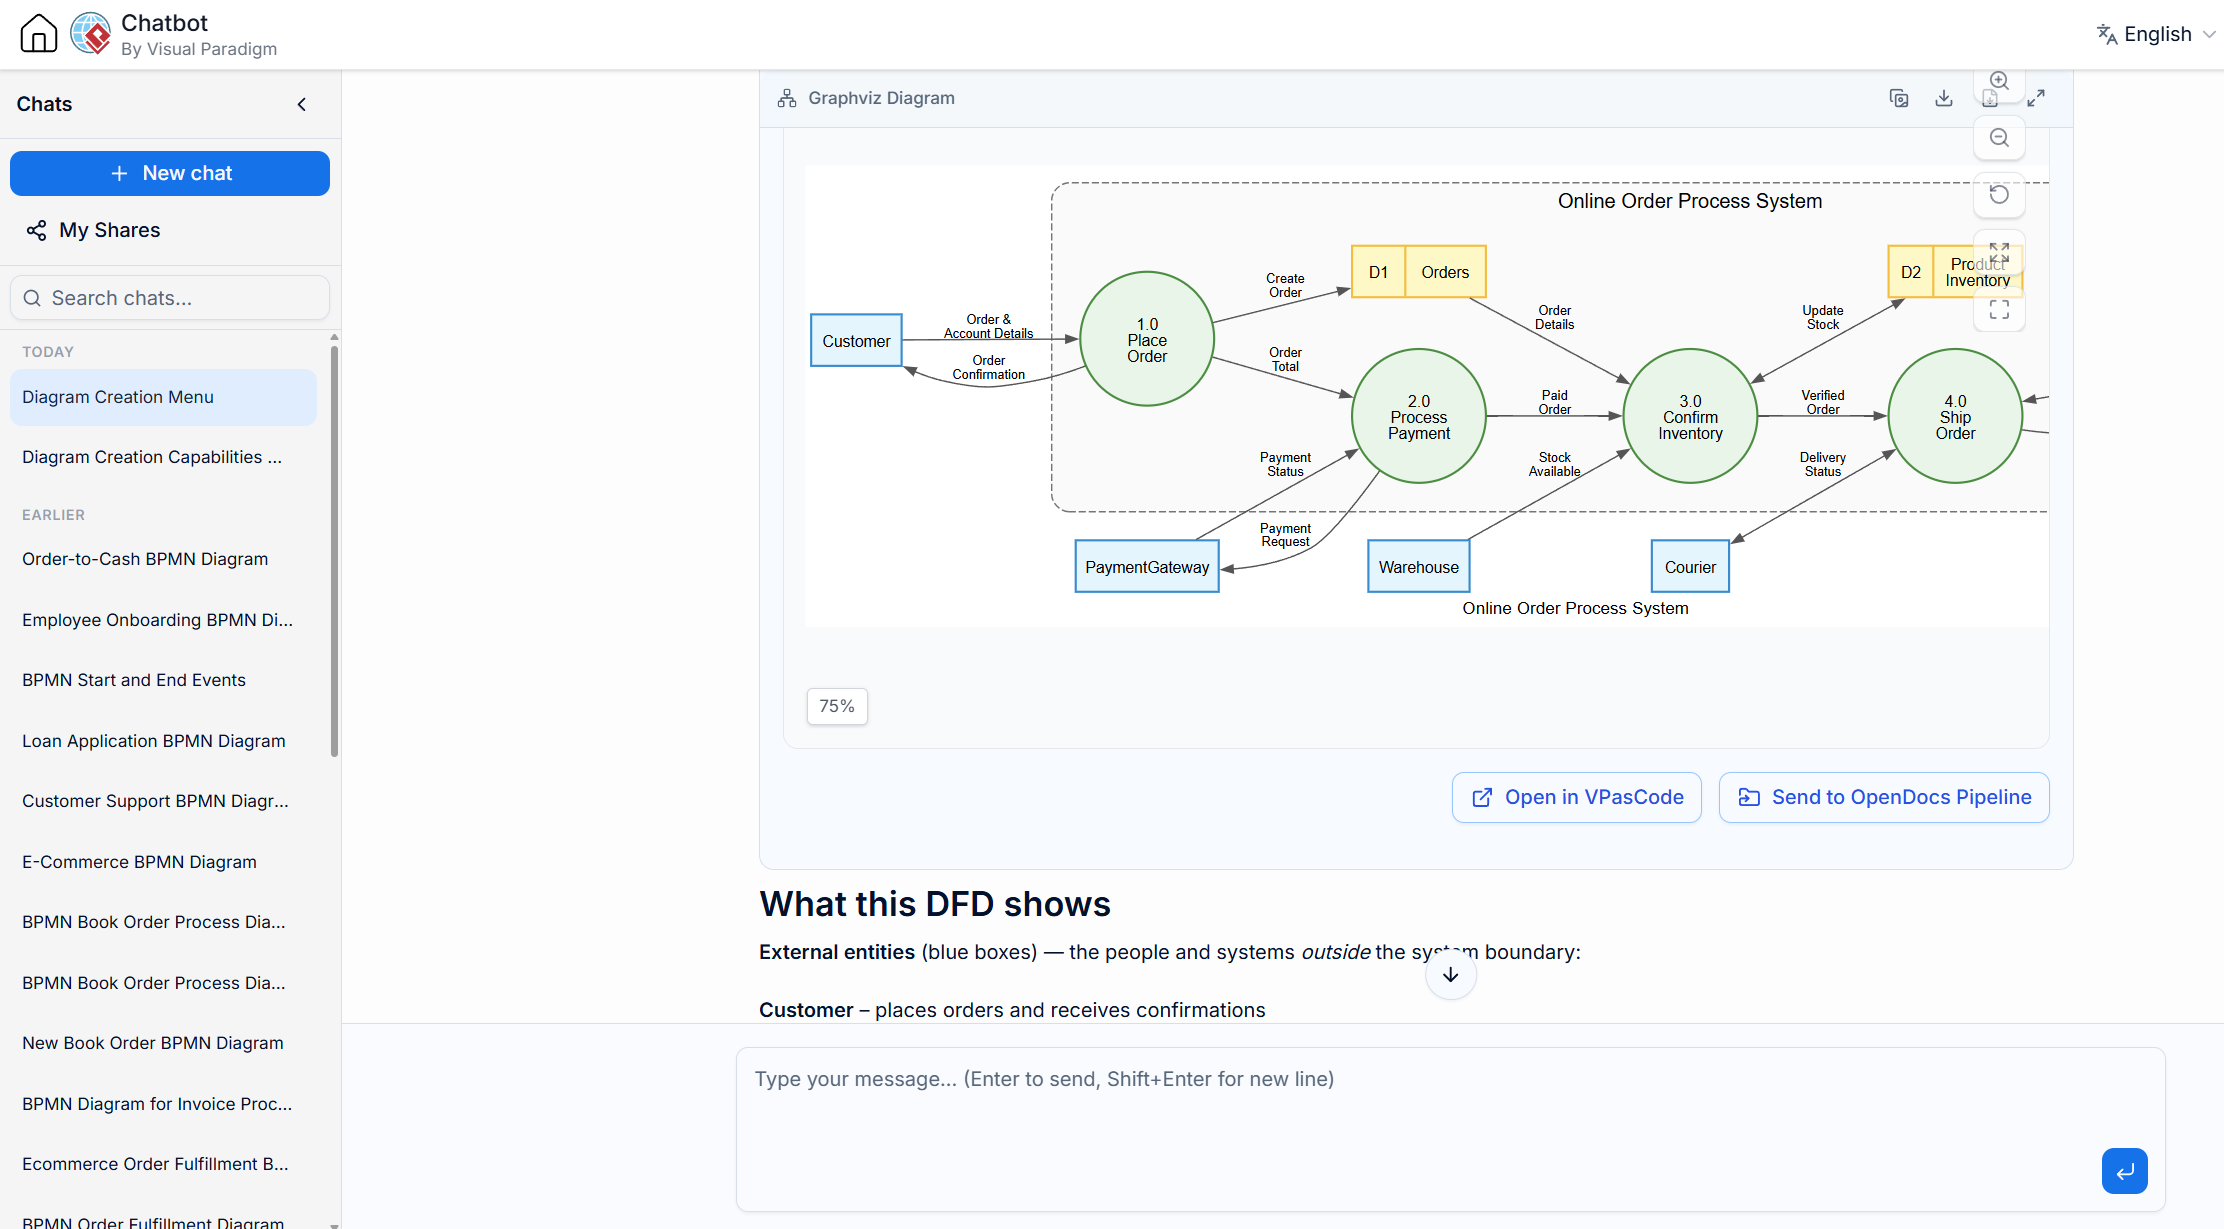
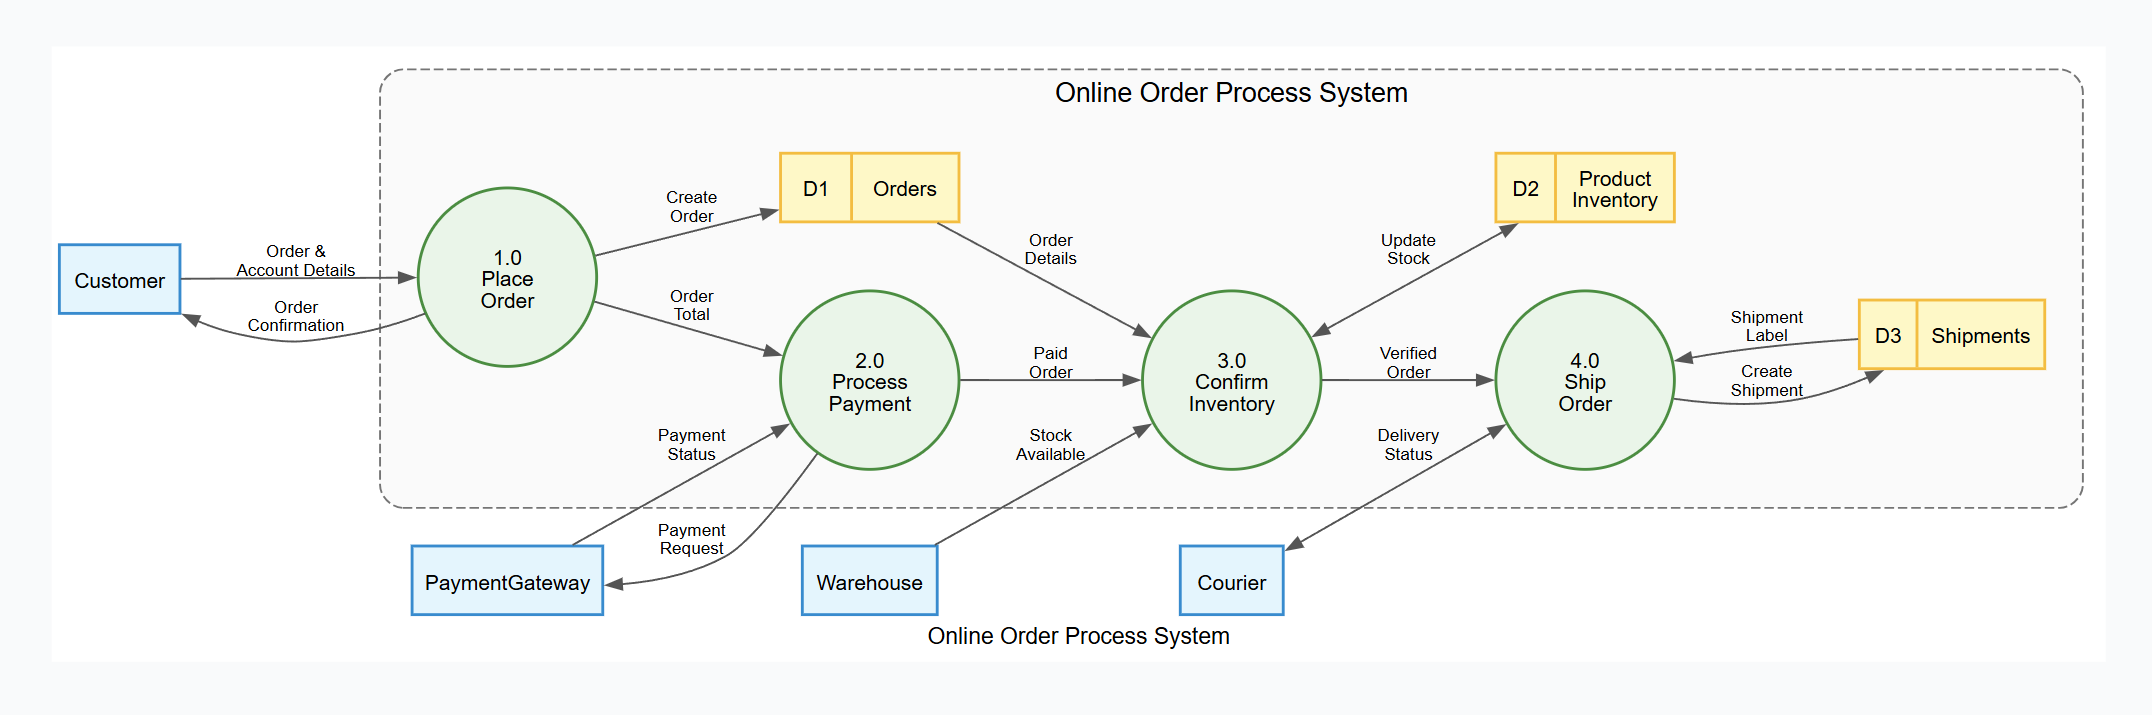
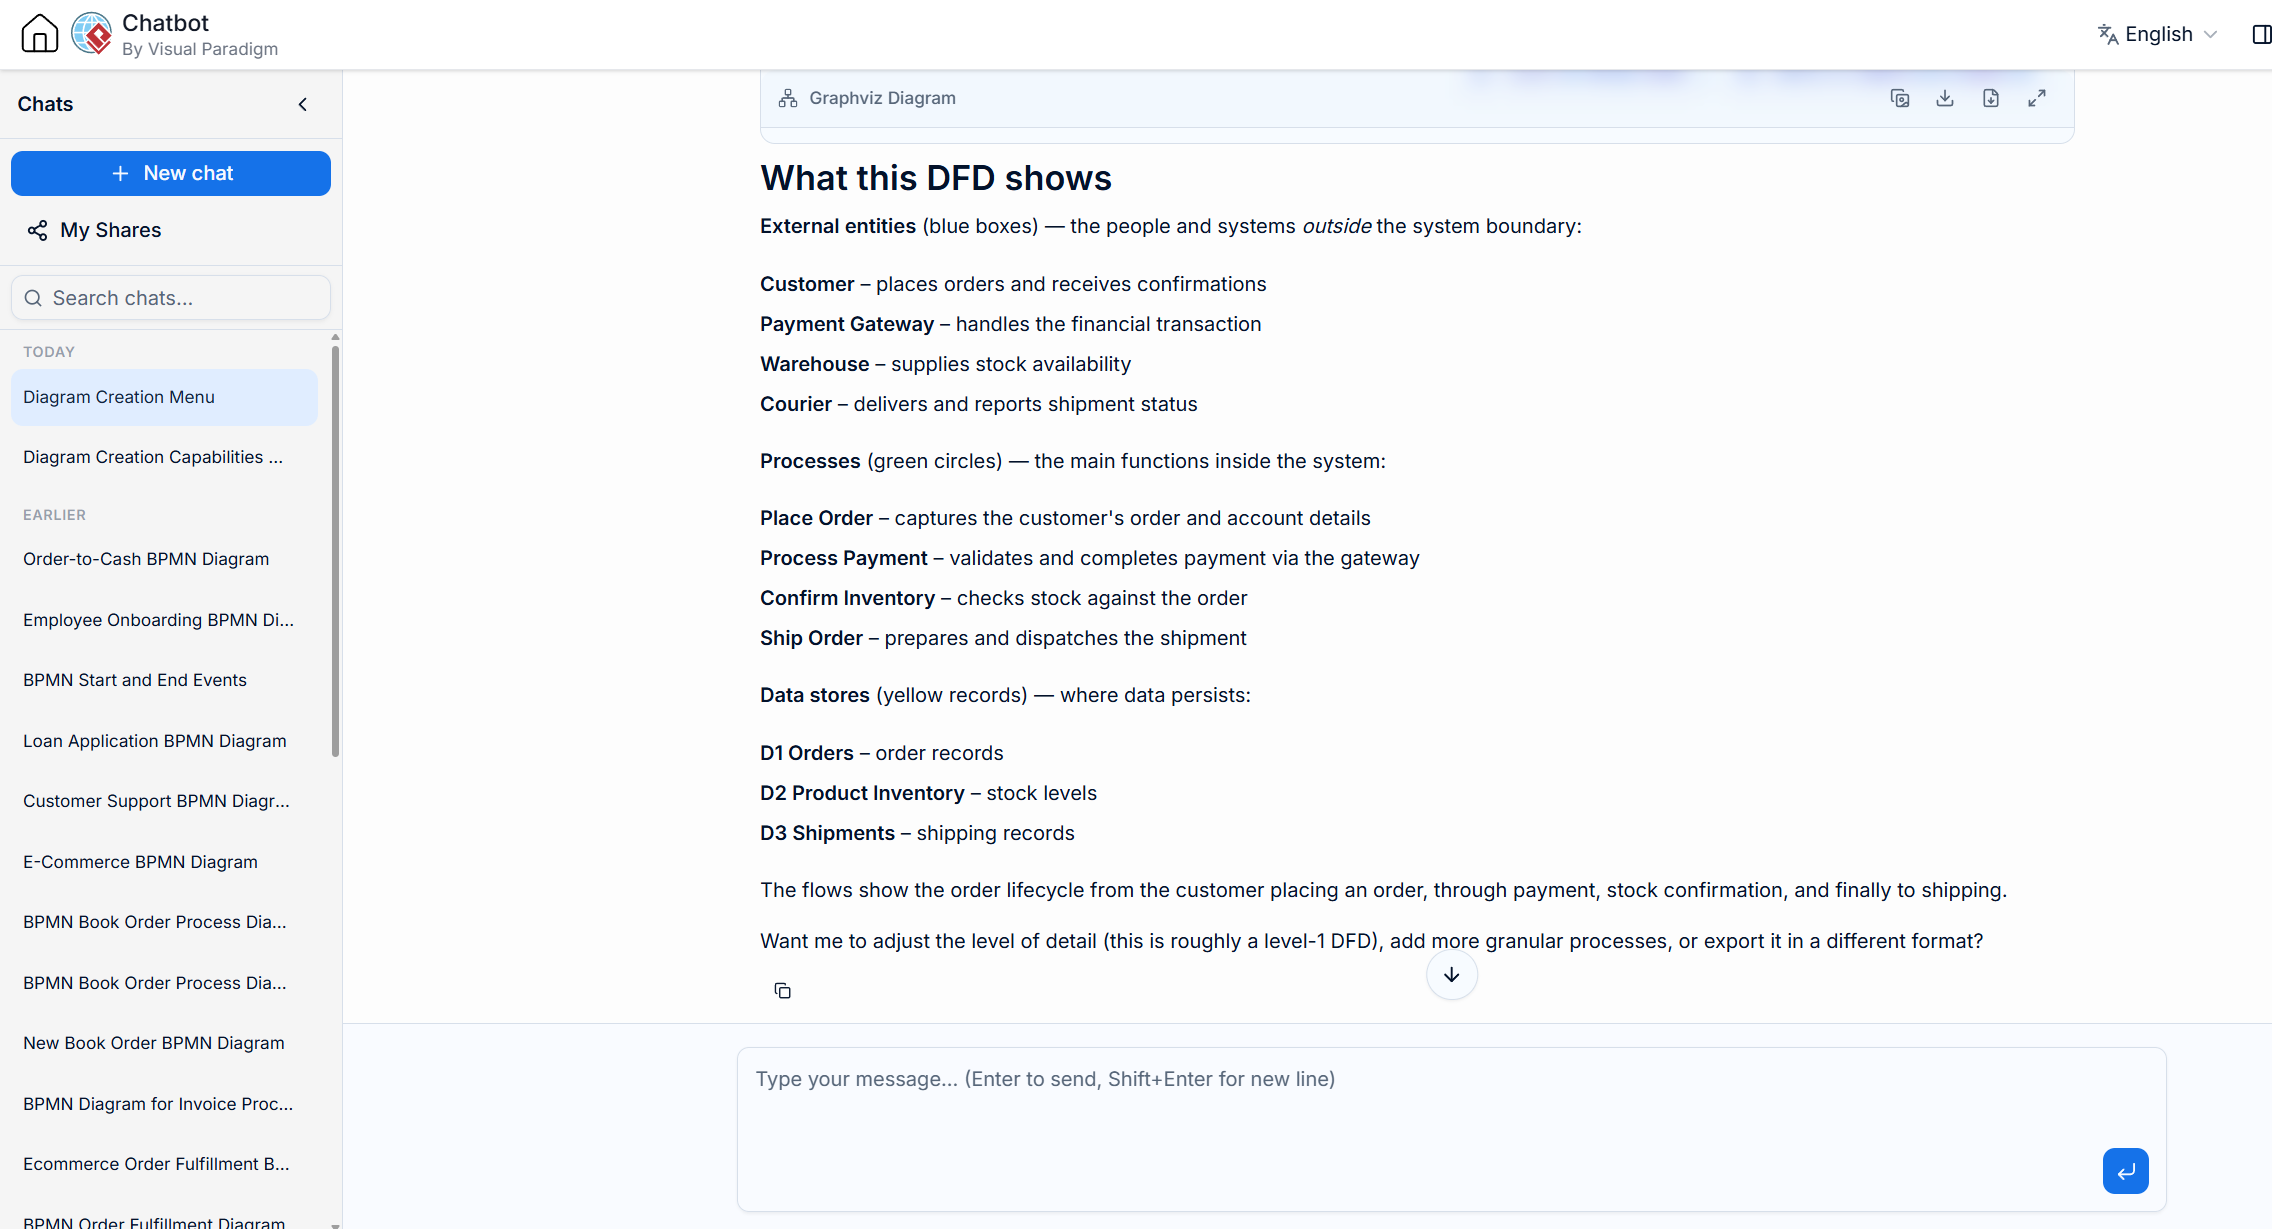
Under the Hood: The AI generates Graphviz Dot Code to render the diagram precisely.
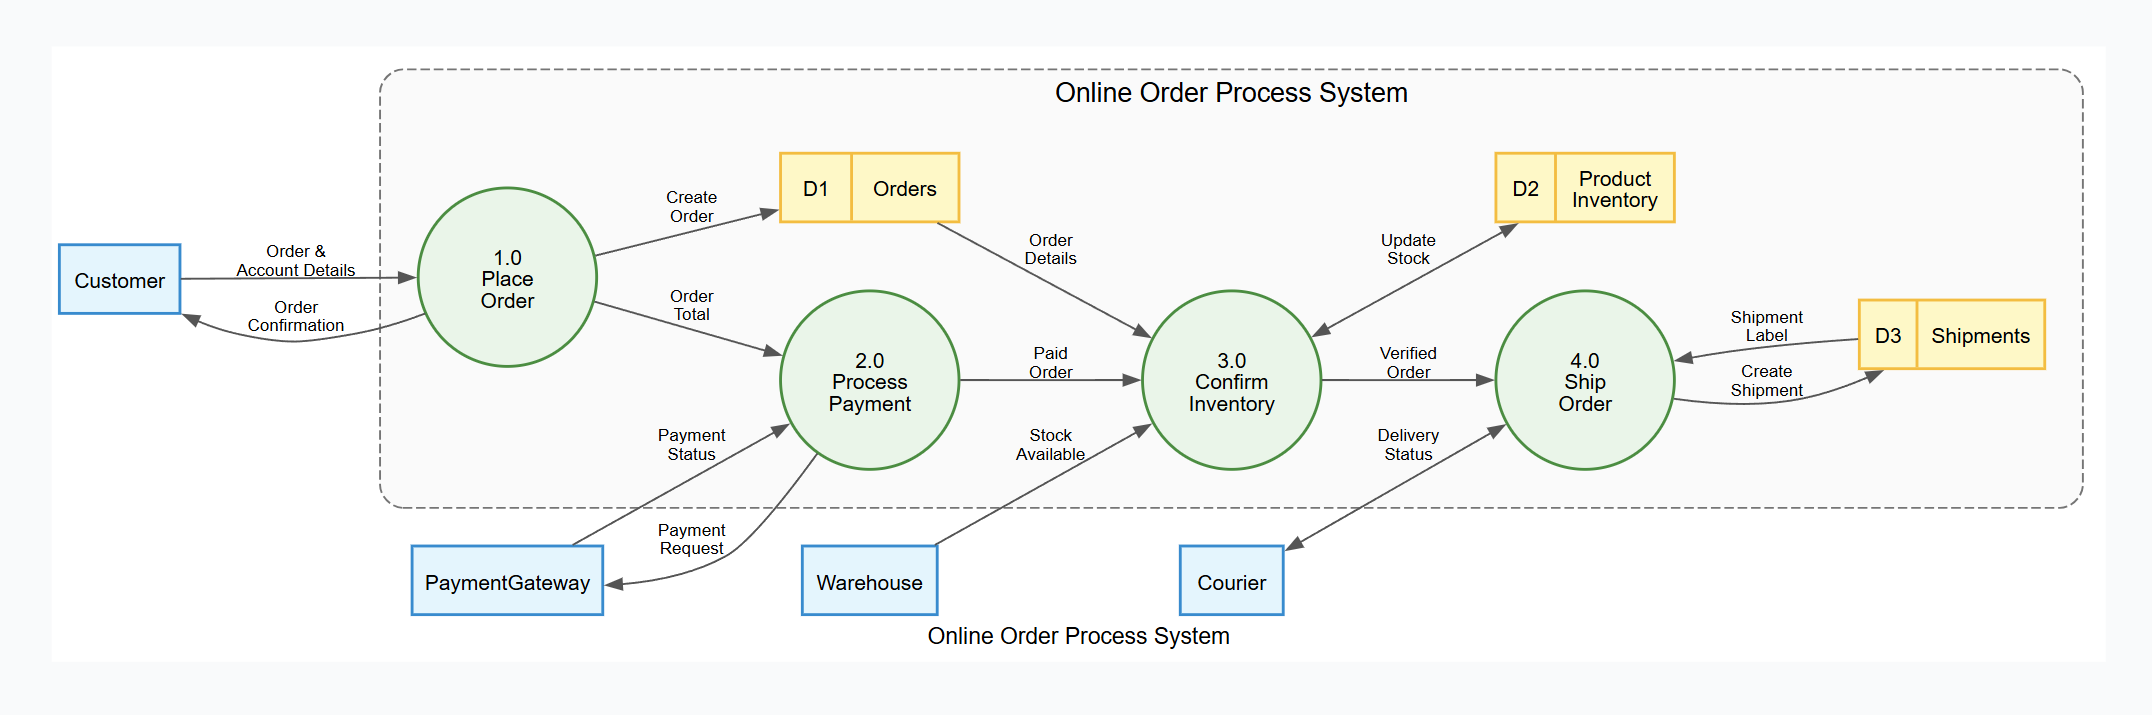
digraph DFD {
    // --- GRAPH STYLE & Diagram Title---
    graph [
        rankdir = LR
        splines = true
        overlap = false
        nodesep = 0.5
        ranksep = 0.8
        fontname = "Helvetica,Arial,sans-serif"
        fontsize = 12
        label = "Online Order Process System"
    ]

    // --- NODE STYLES ---
    node [
        fontname = "Helvetica,Arial,sans-serif"
        fontsize = 11
        penwidth = 1.5
    ]

    // External Entities
    node [shape = box, style = "filled", fillcolor = "#E1F5FE", color = "#0288D1"]
    Customer; PaymentGateway; Warehouse; Courier;

    // --- SYSTEM BOUNDARY CONTAINER ---
    subgraph cluster_SystemBoundary {
        label = "Online Order Process System";
        fontname = "Helvetica,Arial,sans-serif"
        fontsize = 14
        color = "#757575"
        style = "dashed,rounded"
        bgcolor = "#FAFAFA"
        margin = 20

        // Processes
        node [shape = circle, style = "filled", fillcolor = "#E8F5E9", color = "#388E3C", fixedsize = true, width = 1.3]
        P1 [label="1.0\nPlace\nOrder"];
        P2 [label="2.0\nProcess\nPayment"];
        P3 [label="3.0\nConfirm\nInventory"];
        P4 [label="4.0\nShip\nOrder"];

        // Data Stores
        node [shape = record, style = "filled", fillcolor = "#FFF9C4", color = "#FBC02D", fixedsize = false]
        OrderDS [label="{ <id> D1 | Orders }"];
        ProductDS [label="{ <id> D2 | Product\nInventory }"];
        ShippingDS [label="{ <id> D3 | Shipments }"];
    }

    // --- EDGE STYLES ---
    edge [
        fontname = "Helvetica,Arial,sans-serif"
        fontsize = 9
        color = "#555555"
        arrowsize = 0.8
    ]

    // --- DATA FLOWS ---
    Customer -> P1 [label="Order &\nAccount Details"];
    P1 -> Customer [label="Order\nConfirmation"];
    P2 -> PaymentGateway [label="Payment\nRequest"];
    PaymentGateway -> P2 [label="Payment\nStatus"];
    P1 -> P2 [label="Order\nTotal"];
    P2 -> P3 [label="Paid\nOrder"];
    P3 -> P4 [label="Verified\nOrder"];
    P1 -> OrderDS [label="Create\nOrder"];
    P3 -> ProductDS [label="Update\nStock", dir=both];
    P4 -> ShippingDS [label="Create\nShipment"];
    OrderDS -> P3 [label="Order\nDetails"];
    ShippingDS -> P4 [label="Shipment\nLabel"];
    Warehouse -> P3 [label="Stock\nAvailable"];
    Courier -> P4 [label="Delivery\nStatus", dir=both];
}
Step 3: Level 2 Decomposition via Conversation
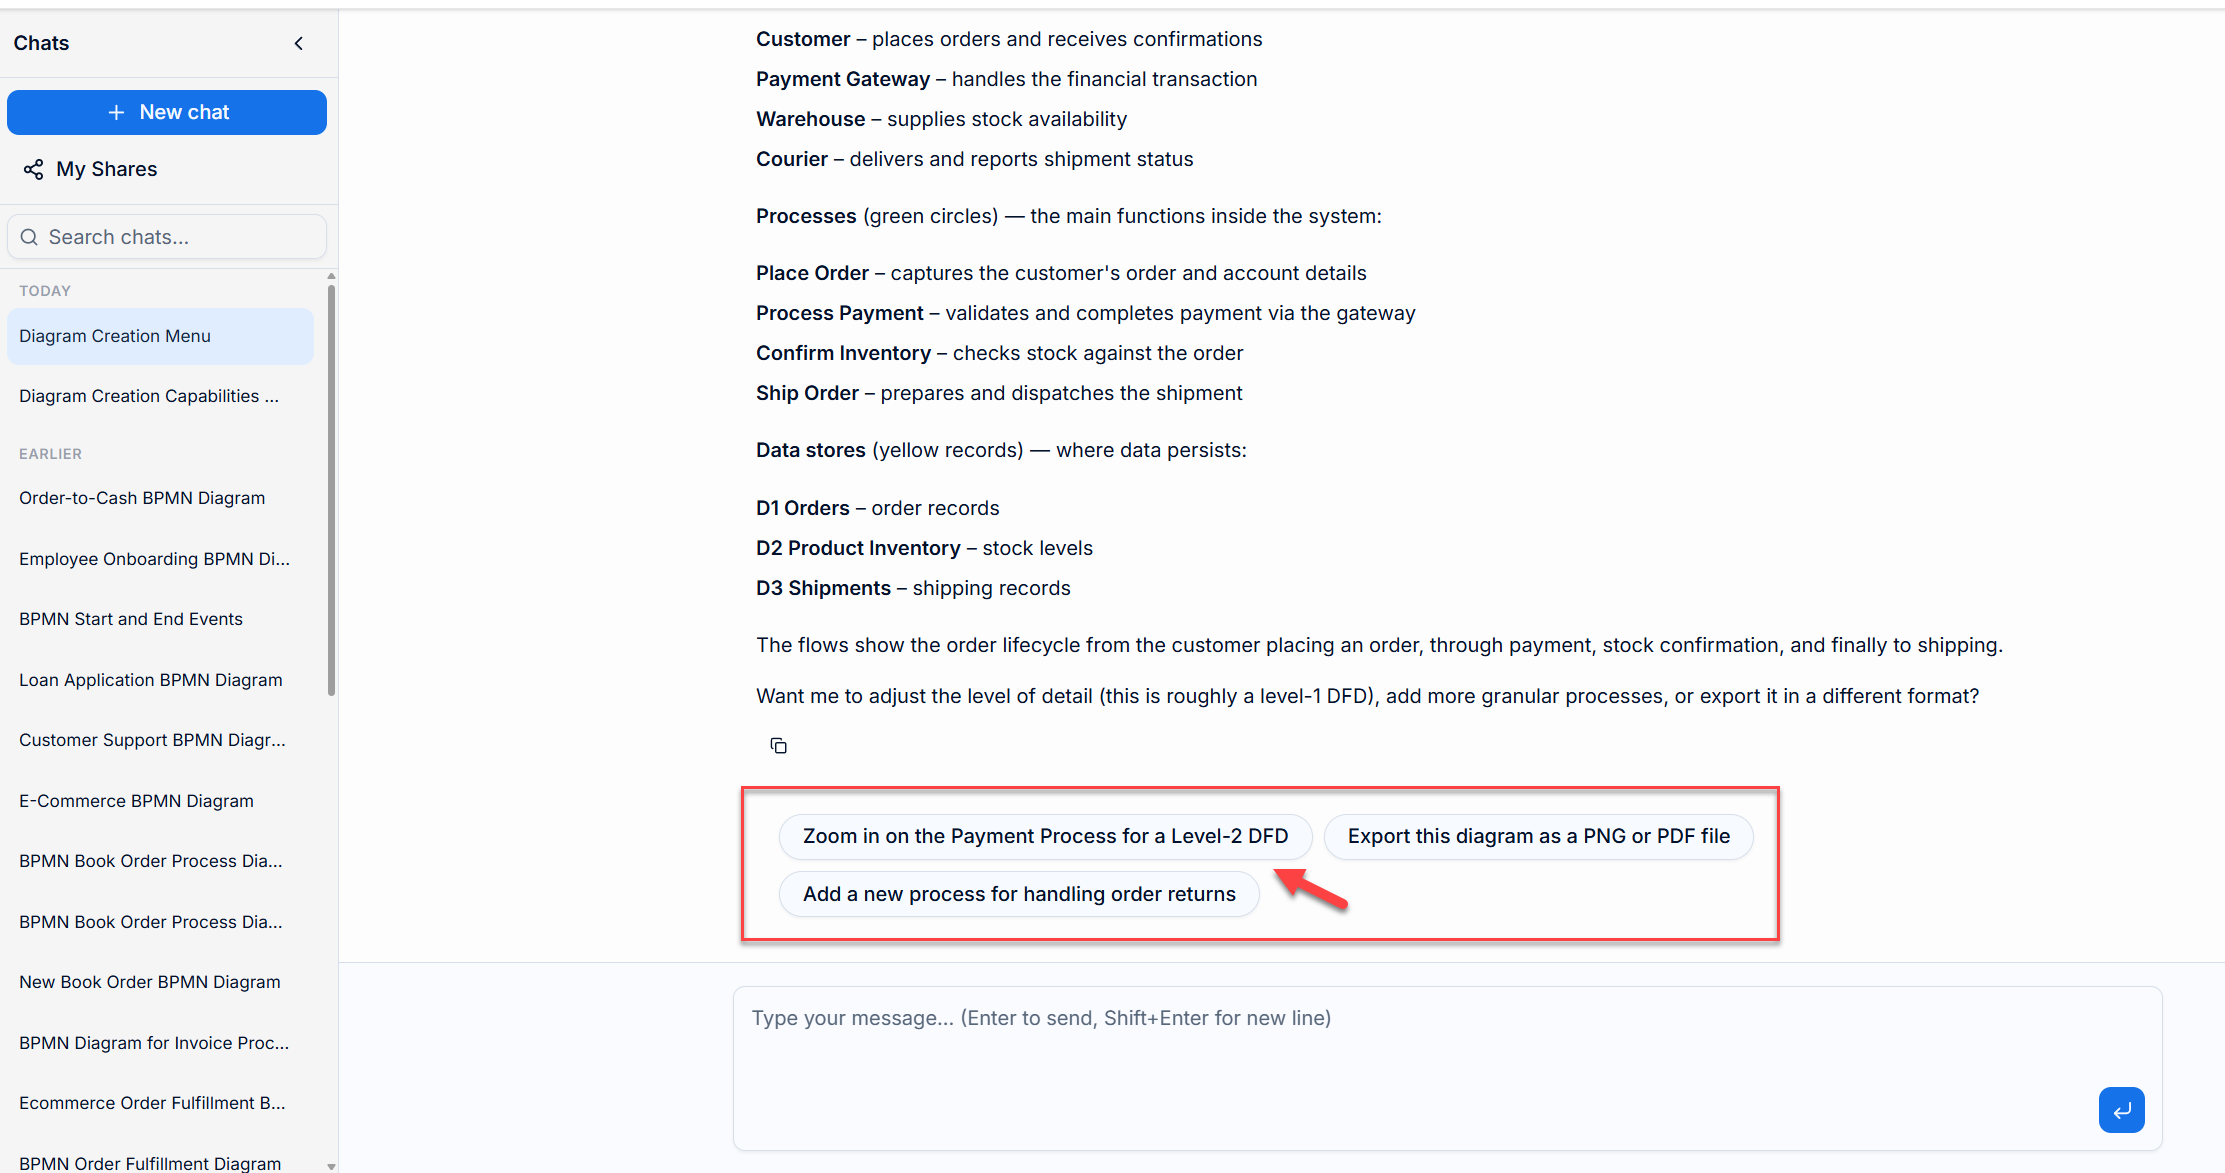
Instead of manually drawing sub-processes, ask the AI to “zoom in.” This maintains parent-child linkage automatically.
Action: Select suggestion “Zoom in on the Payment Process for a level 2 DFD”
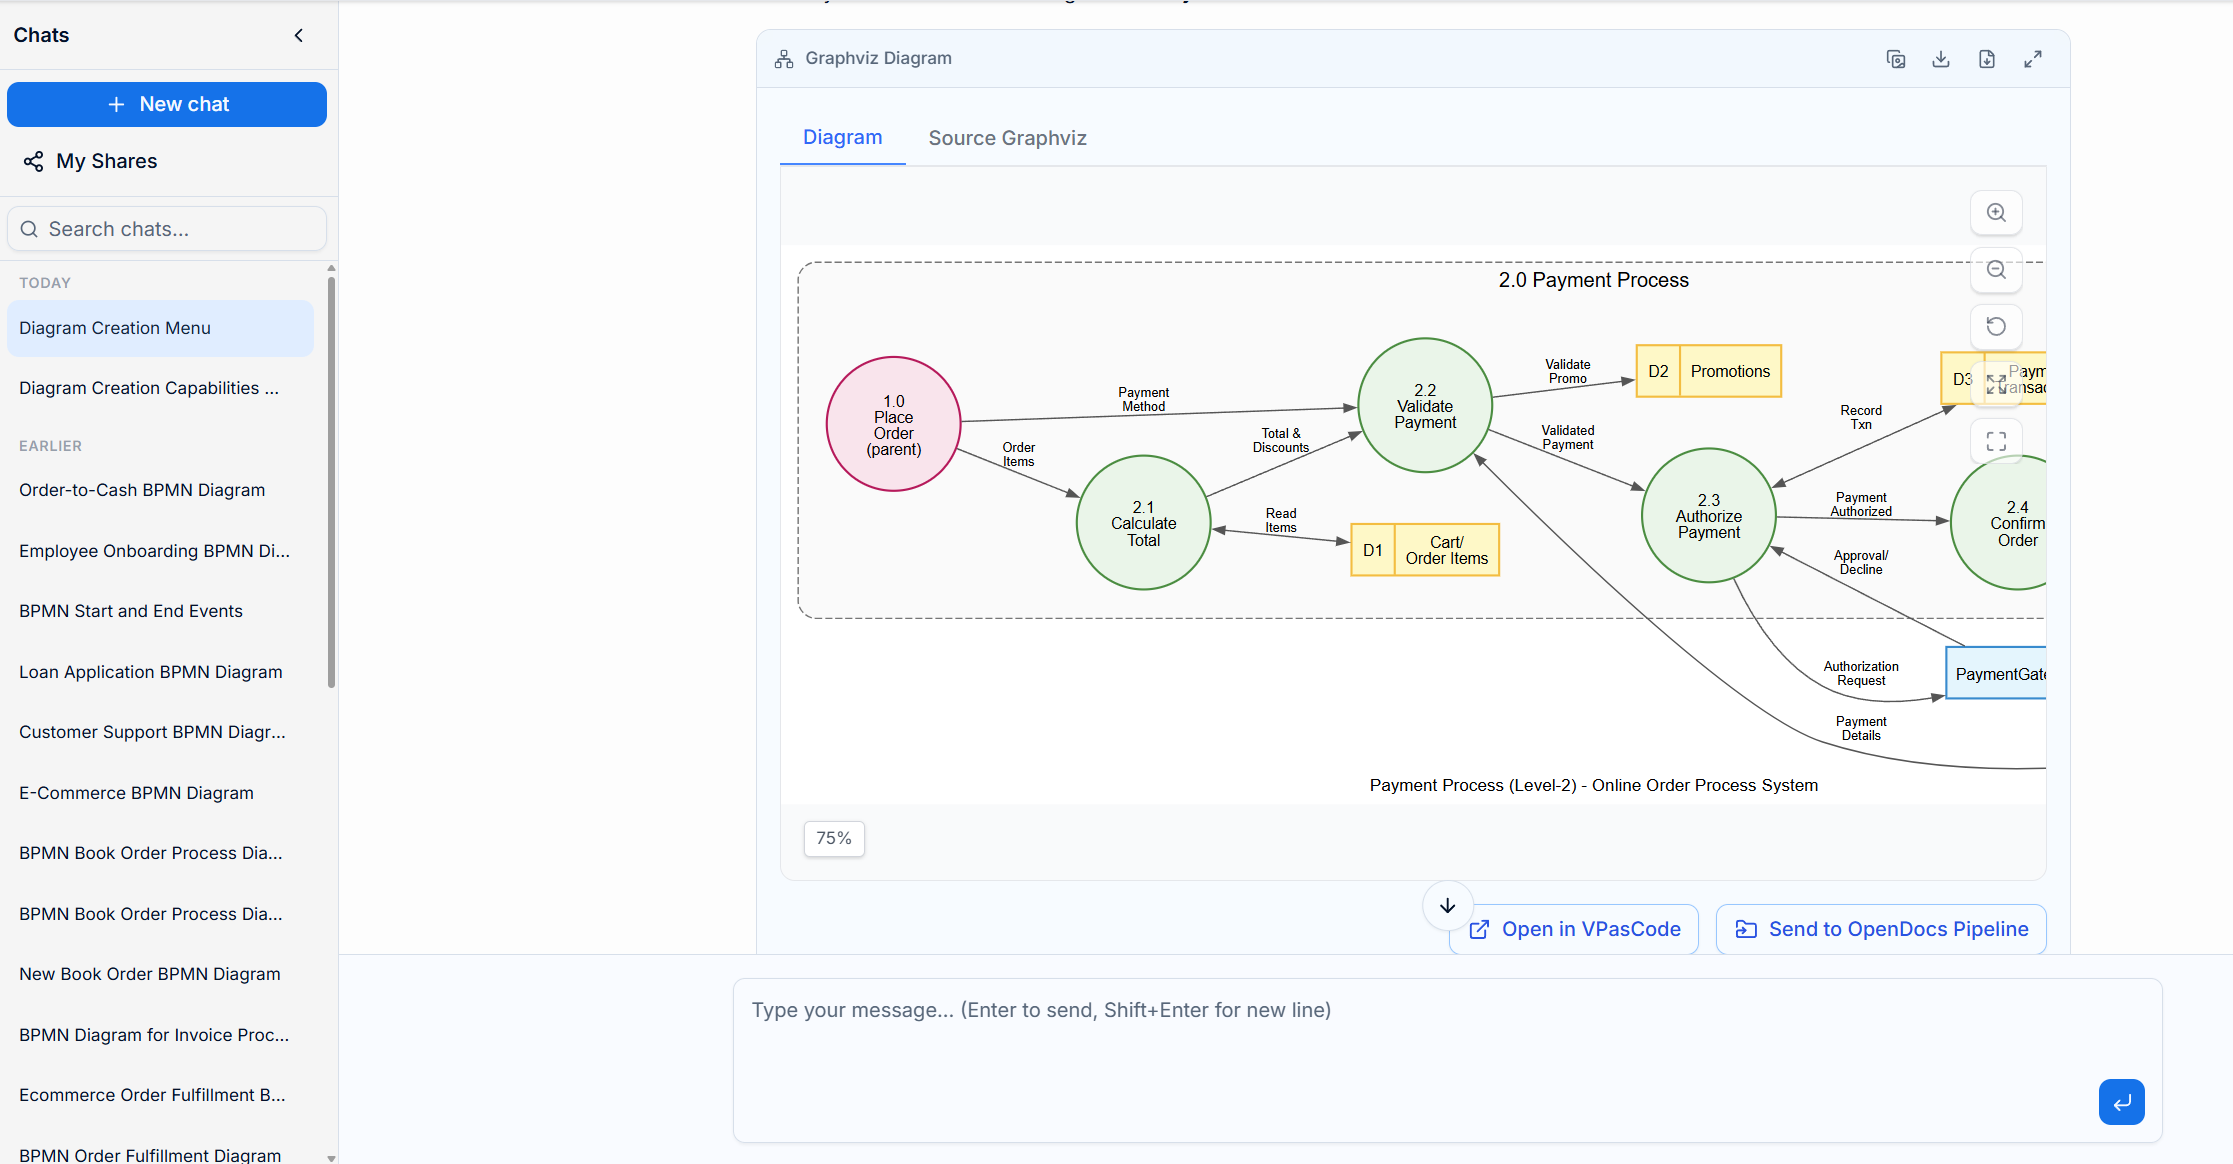
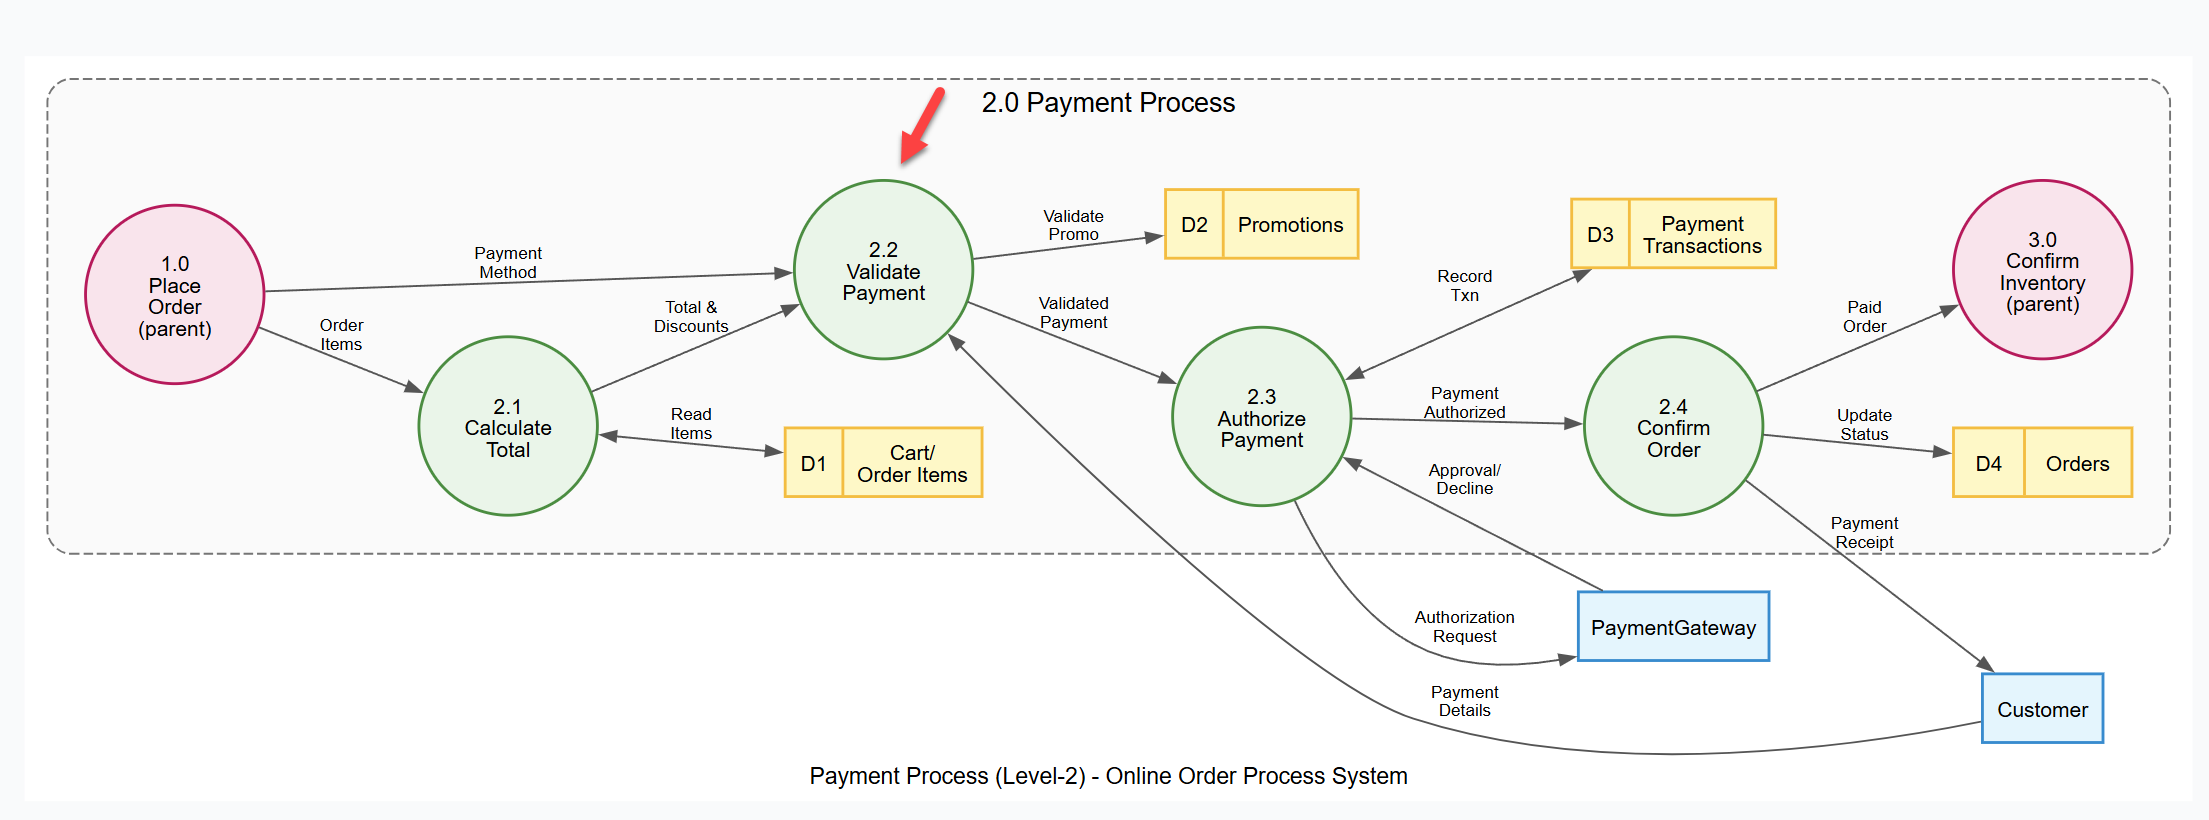
Key Observation: Parent processes appear in pink as boundary references, helping verify balancing at a glance.
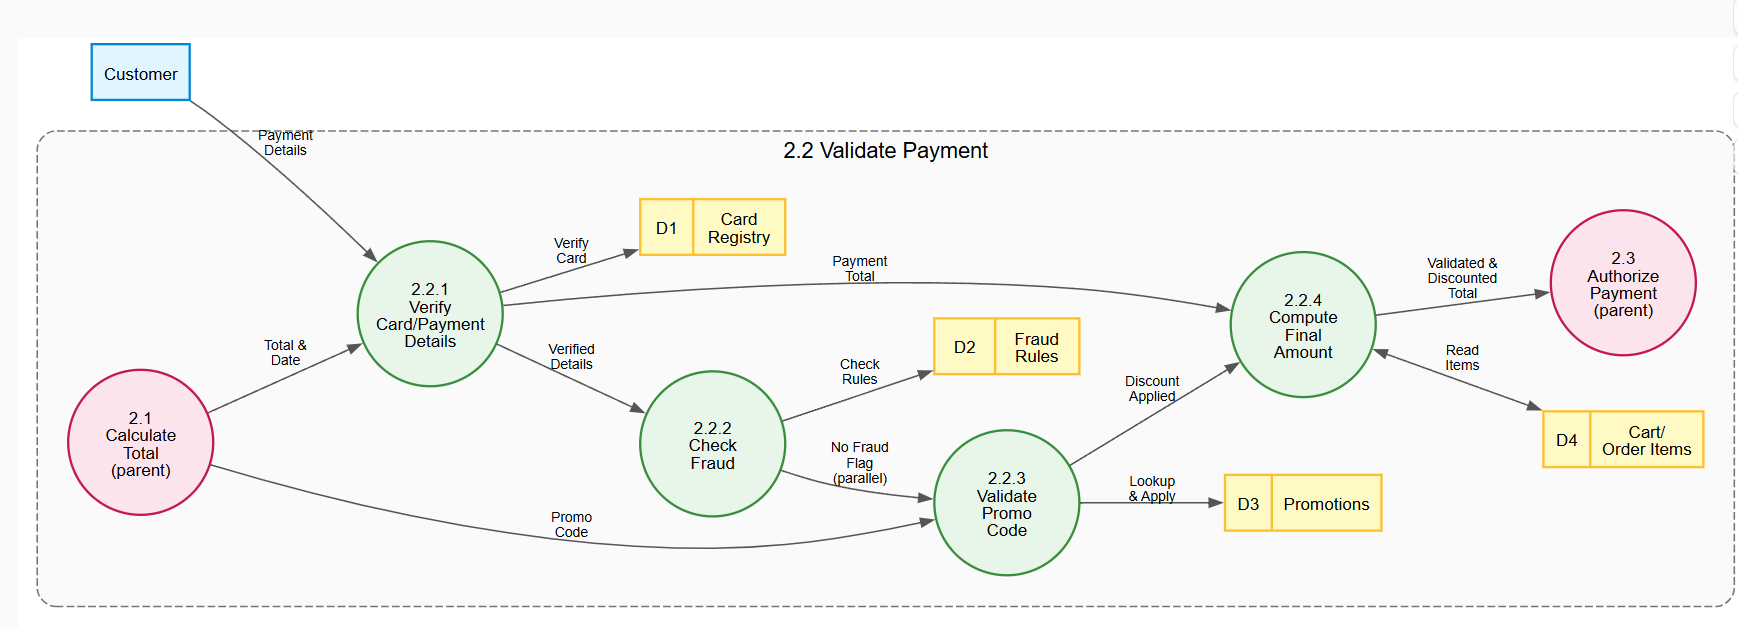
Step 4: Level 3 Deep Dive
For complex logic like payment validation, drill down further to atomic tasks.
Action: Select “Break down the validate Payment sub-process further”
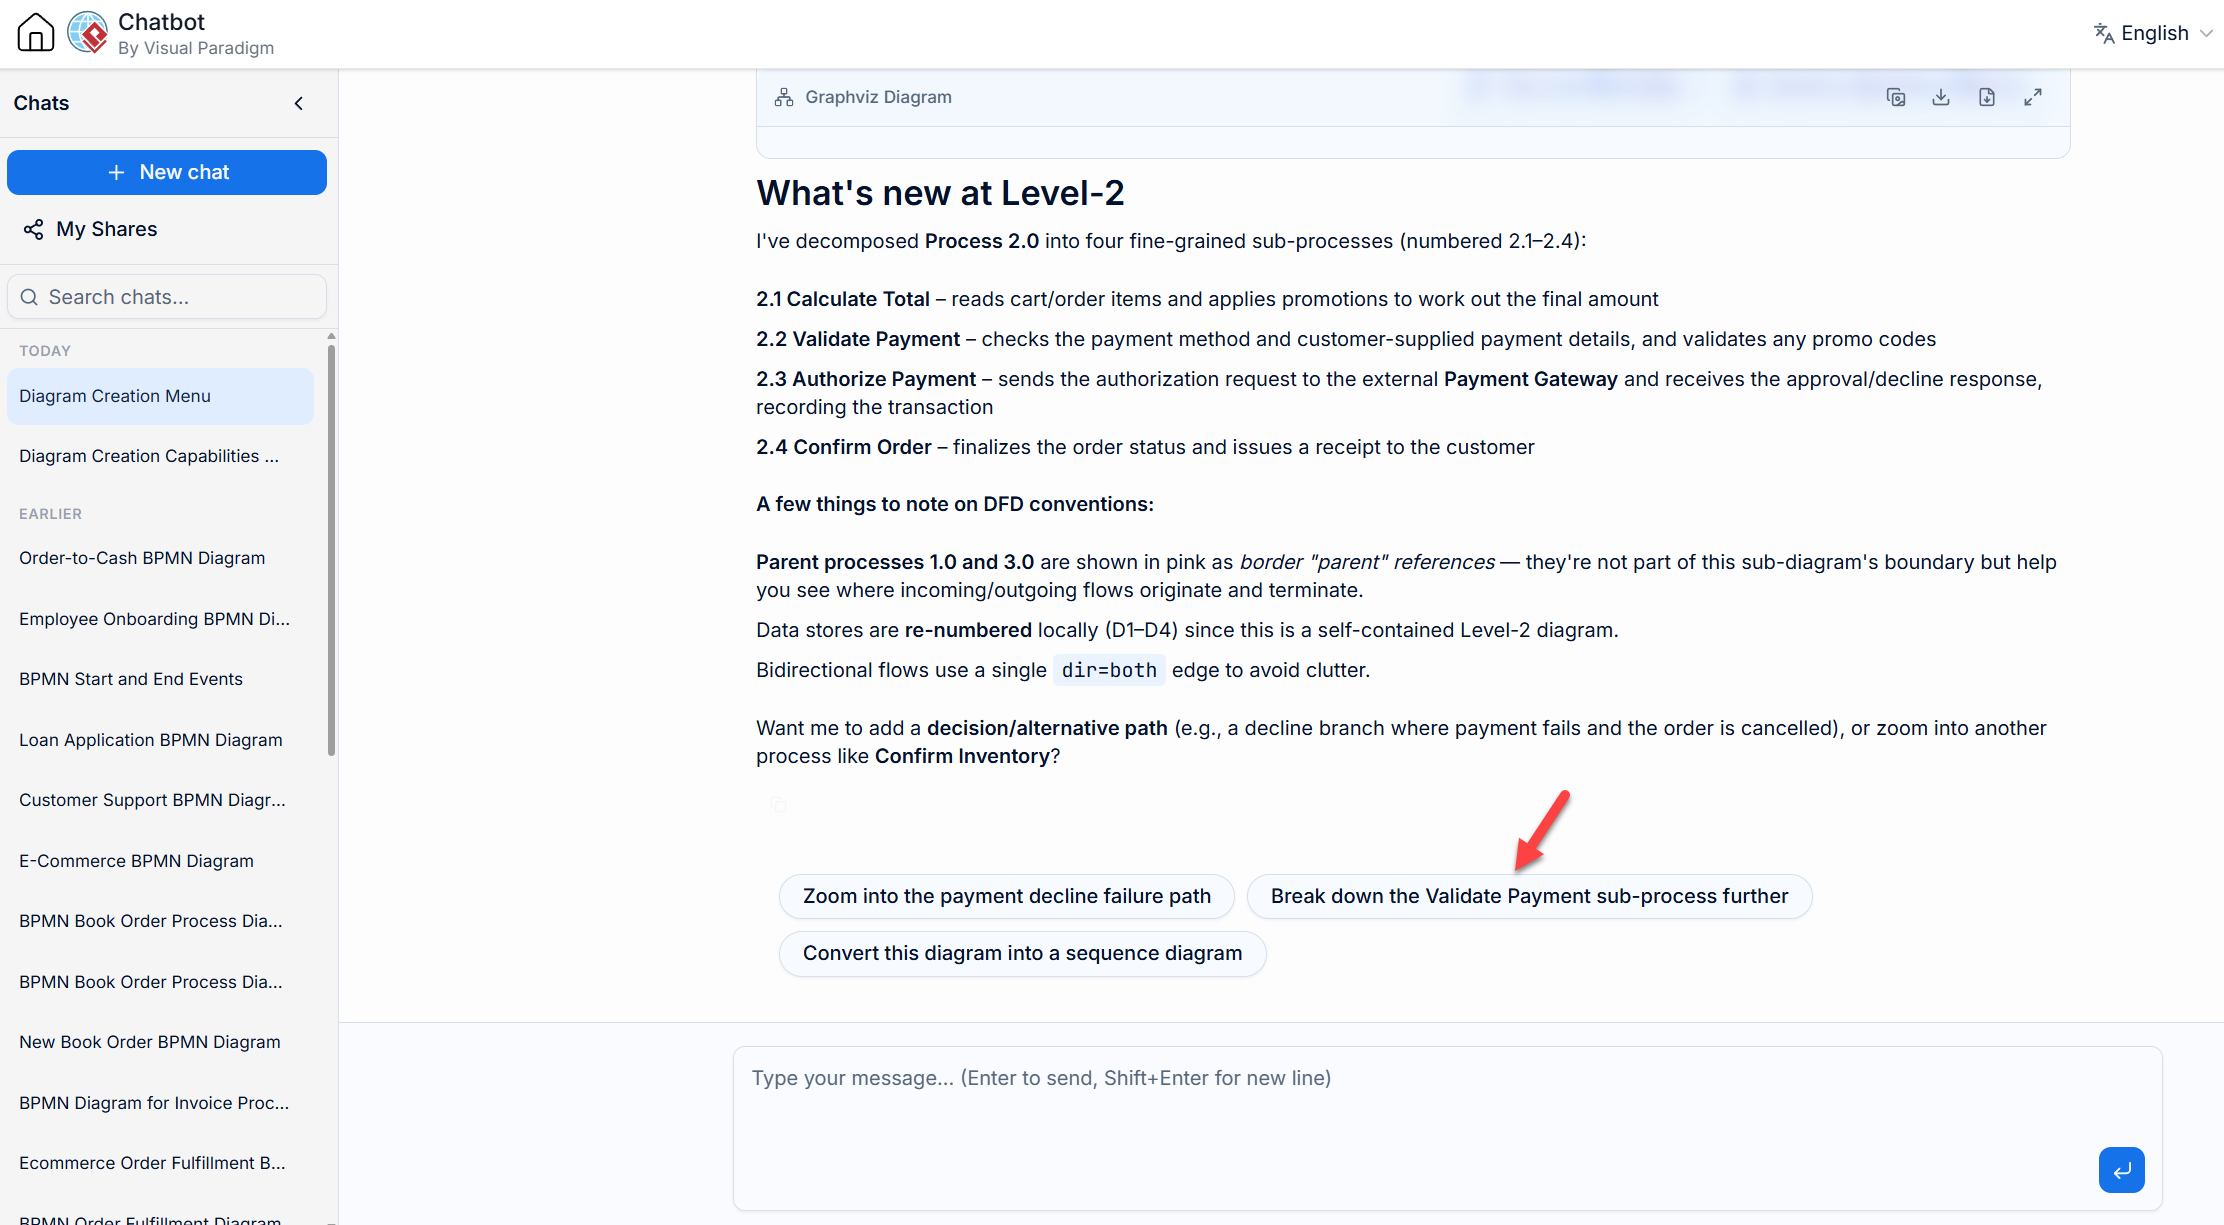
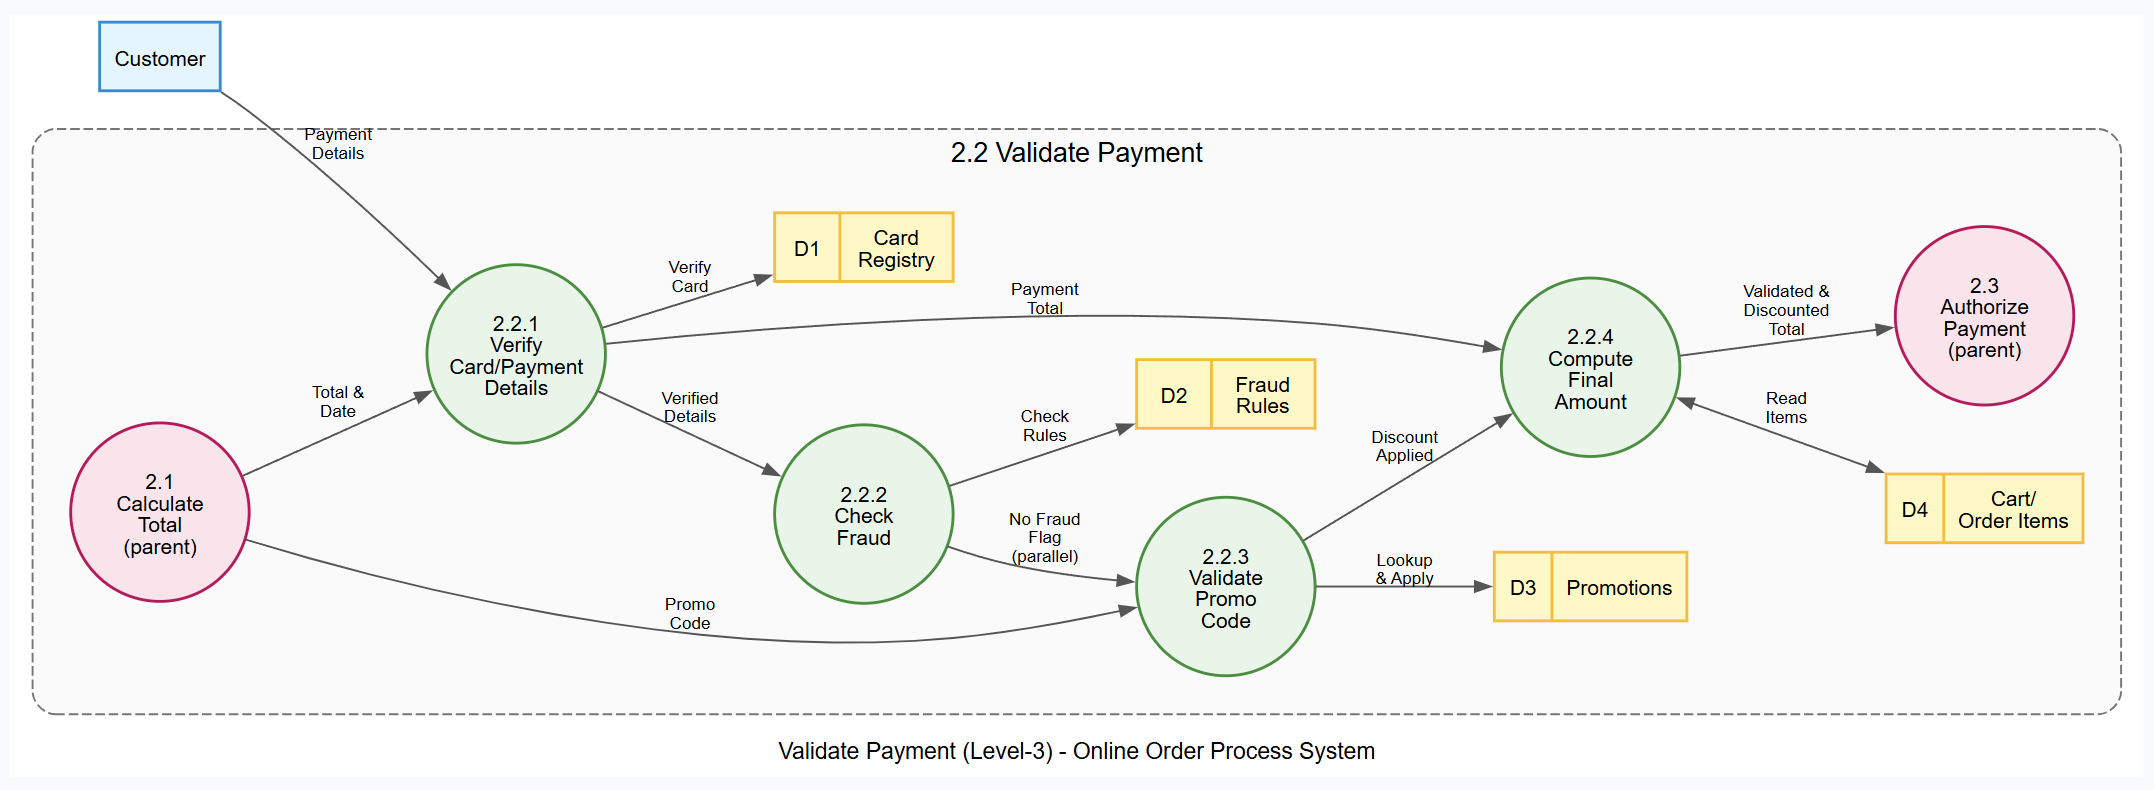
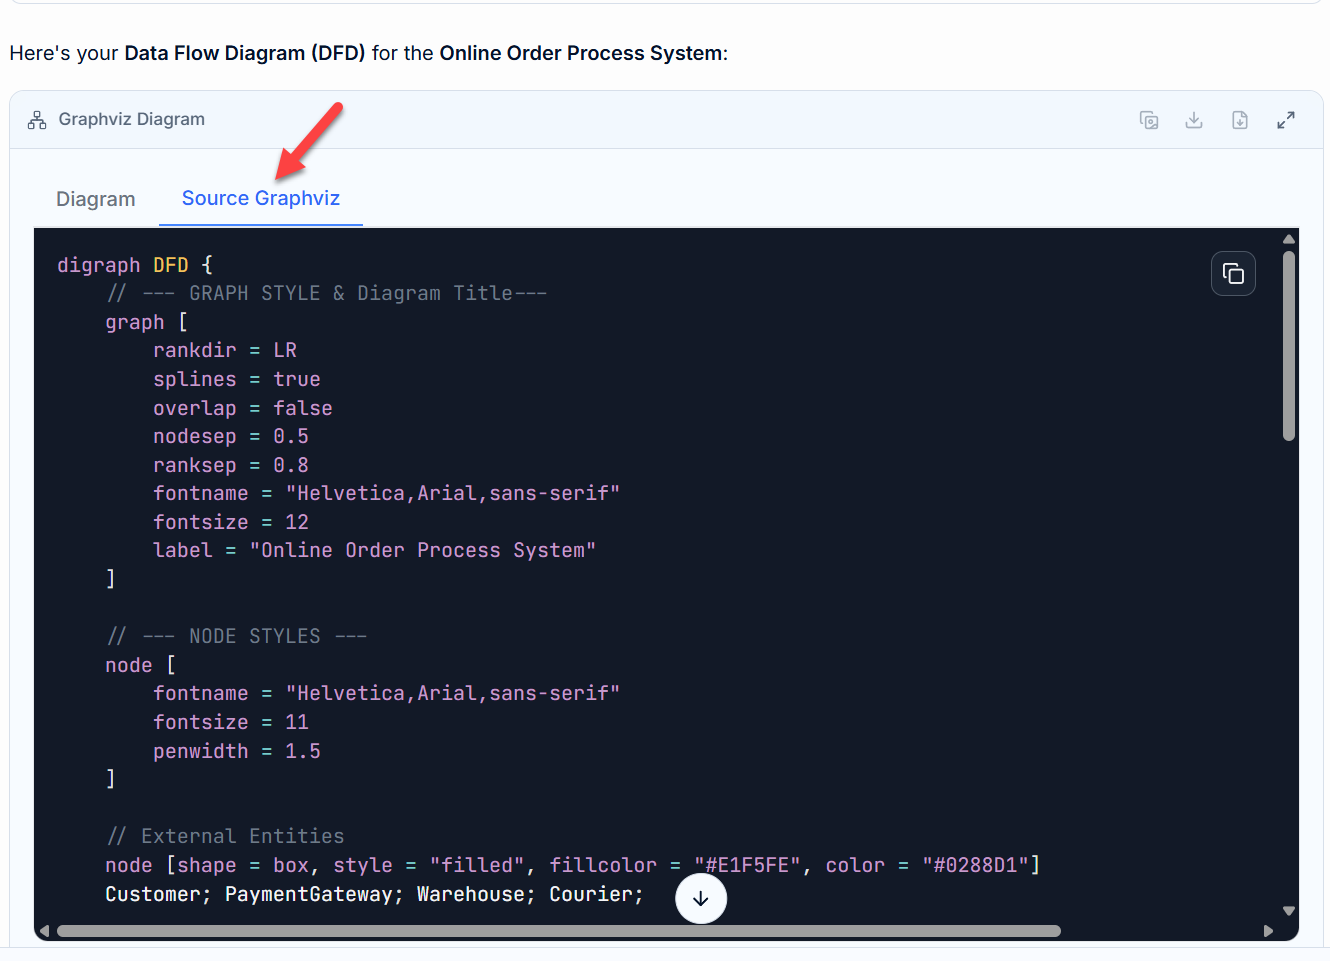
At Level 3, the AI identifies parallel opportunities and maintains hierarchical numbering (e.g., 2.2.1, 2.2.2).
Step 5: Leveraging Shared Sessions for Continuity
AI modeling is rarely linear. VP AI allows you to resume sessions or branch out without losing context.
Using shared sessions, you can jump to a different branch while retaining all previous definitions.
Prompt: “Zoom in on the Confirm Inventory Process for a level 2 DFD”
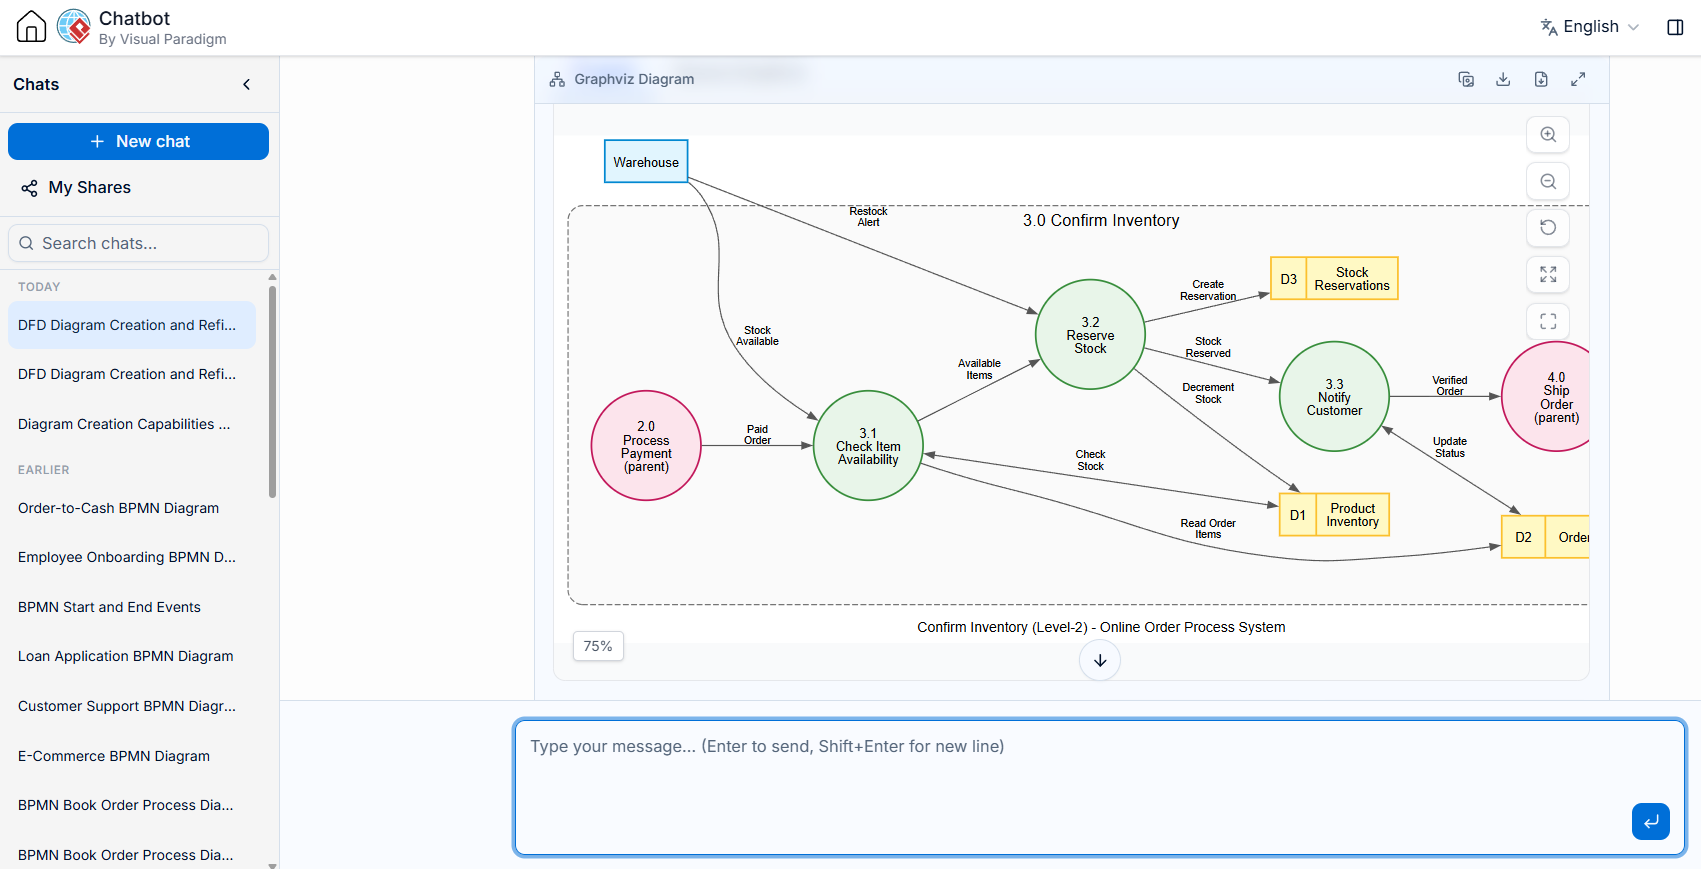
digraph DFD {
graph [
rankdir = LR
splines = true
overlap = false
nodesep = 0.5
ranksep = 0.8
fontname = "Helvetica,Arial,sans-serif"
fontsize = 12
label = "Confirm Inventory (Level-2) - Online Order Process System"
]
node [
fontname = "Helvetica,Arial,sans-serif"
fontsize = 11
penwidth = 1.5
]
node [shape = box, style = "filled", fillcolor = "#E1F5FE", color = "#0288D1"]
Warehouse;
subgraph cluster_SystemBoundary {
label = "3.0 Confirm Inventory";
fontname = "Helvetica,Arial,sans-serif"
fontsize = 14
color = "#757575"
style = "dashed,rounded"
bgcolor = "#FAFAFA"
margin = 20
node [shape = circle, style = "filled", fillcolor = "#E8F5E9", color = "#388E3C", fixedsize = true, width = 1.3]
P31 [label="3.1\nCheck Item\nAvailability"];
P32 [label="3.2\nReserve\nStock"];
P33 [label="3.3\nNotify\nCustomer"];
node [shape = record, style = "filled", fillcolor = "#FFF9C4", color = "#FBC02D", fixedsize = false]
ProductDS [label="{ <id> D1 | Product\nInventory }"];
OrderDS [label="{ <id> D2 | Orders }"];
ReservationDS [label="{ <id> D3 | Stock\nReservations }"];
node [shape = circle, style = "filled", fillcolor = "#FCE4EC", color = "#C2185B", fixedsize = true, width = 1.3]
P2 [label="2.0\nProcess\nPayment\n(parent)"];
P4 [label="4.0\nShip\nOrder\n(parent)"];
}
edge [
fontname = "Helvetica,Arial,sans-serif"
fontsize = 9
color = "#555555"
arrowsize = 0.8
]
P2 -> P31 [label="Paid\nOrder"];
P31 -> P32 [label="Available\nItems"];
P32 -> P33 [label="Stock\nReserved"];
P33 -> P4 [label="Verified\nOrder"];
P31 -> OrderDS [label="Read Order\nItems"];
P31 -> ProductDS [label="Check\nStock", dir=both];
P32 -> ProductDS [label="Decrement\nStock"];
P32 -> ReservationDS [label="Create\nReservation"];
P33 -> OrderDS [label="Update\nStatus", dir=both];
Warehouse -> P31 [label="Stock\nAvailable"];
Warehouse -> P32 [label="Restock\nAlert"];
}
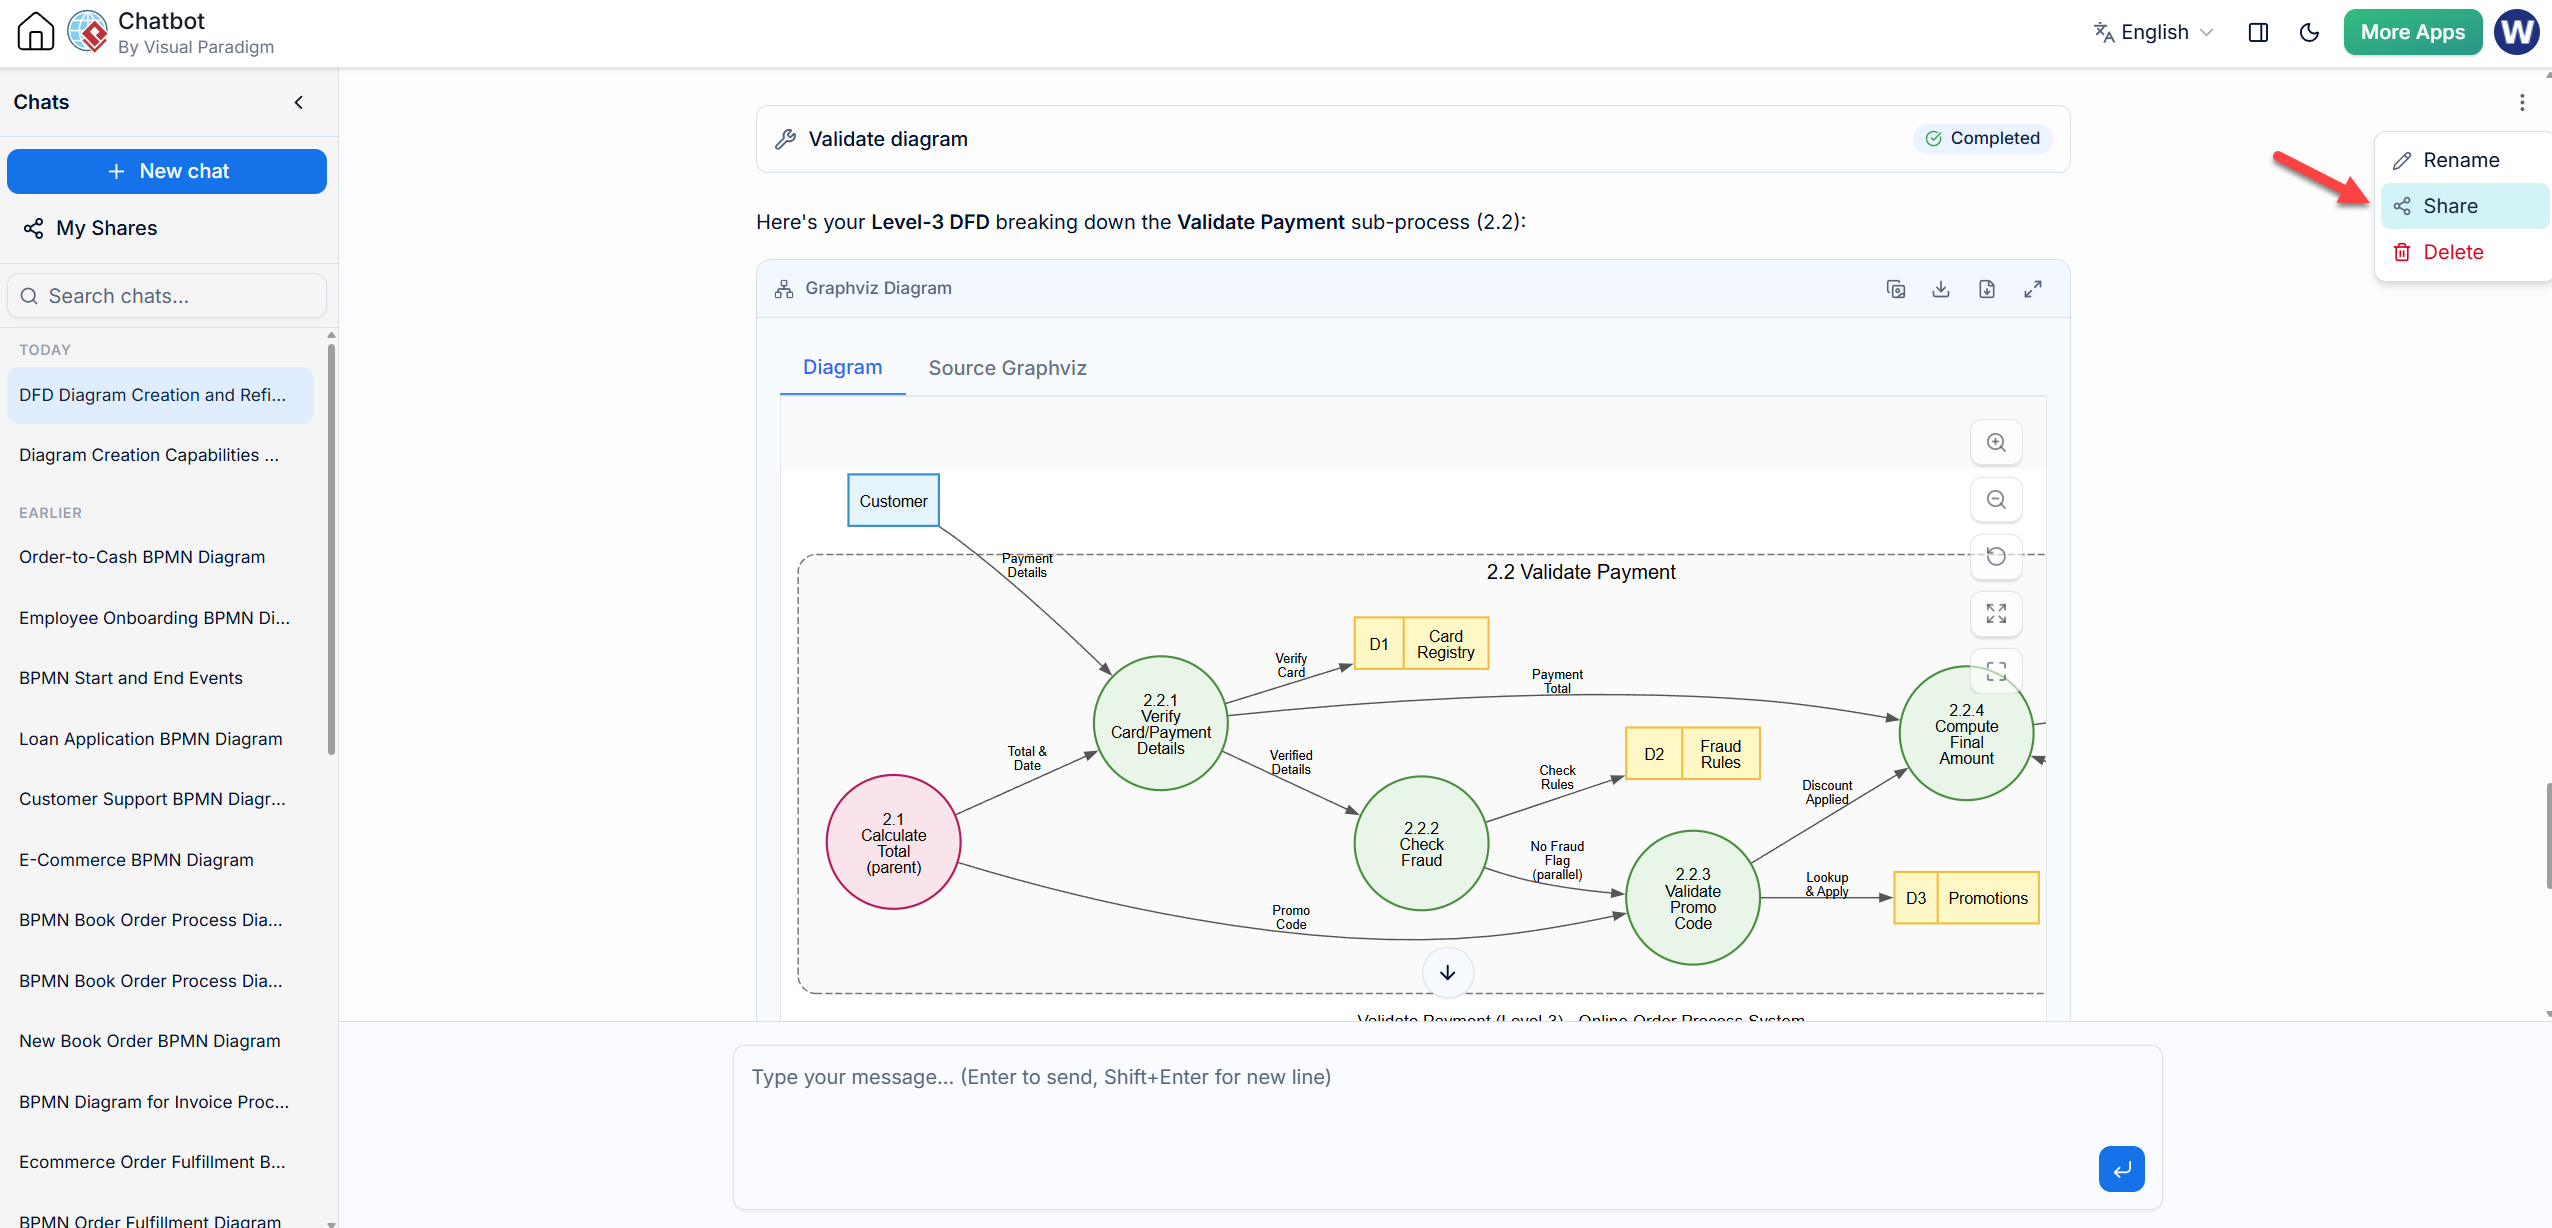
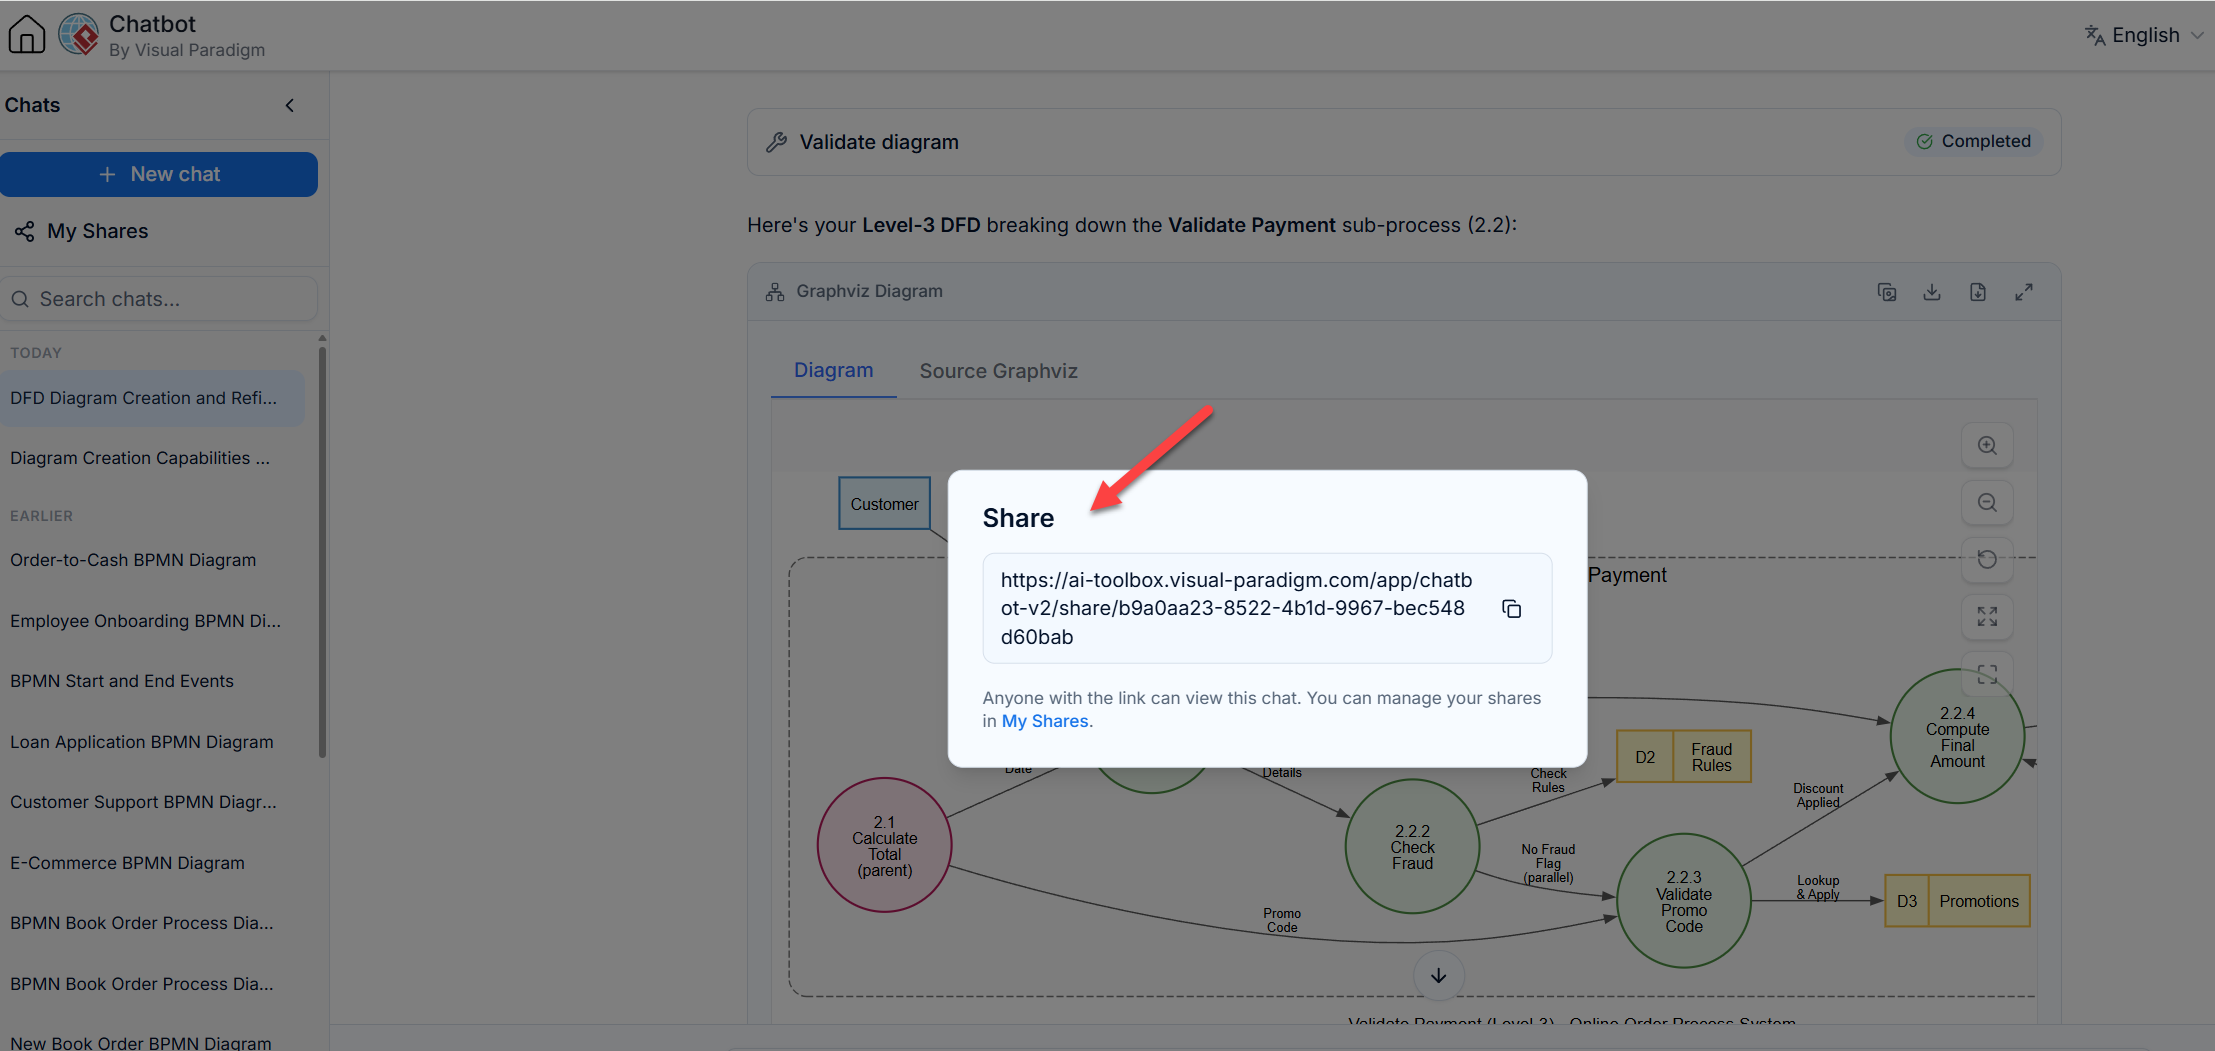
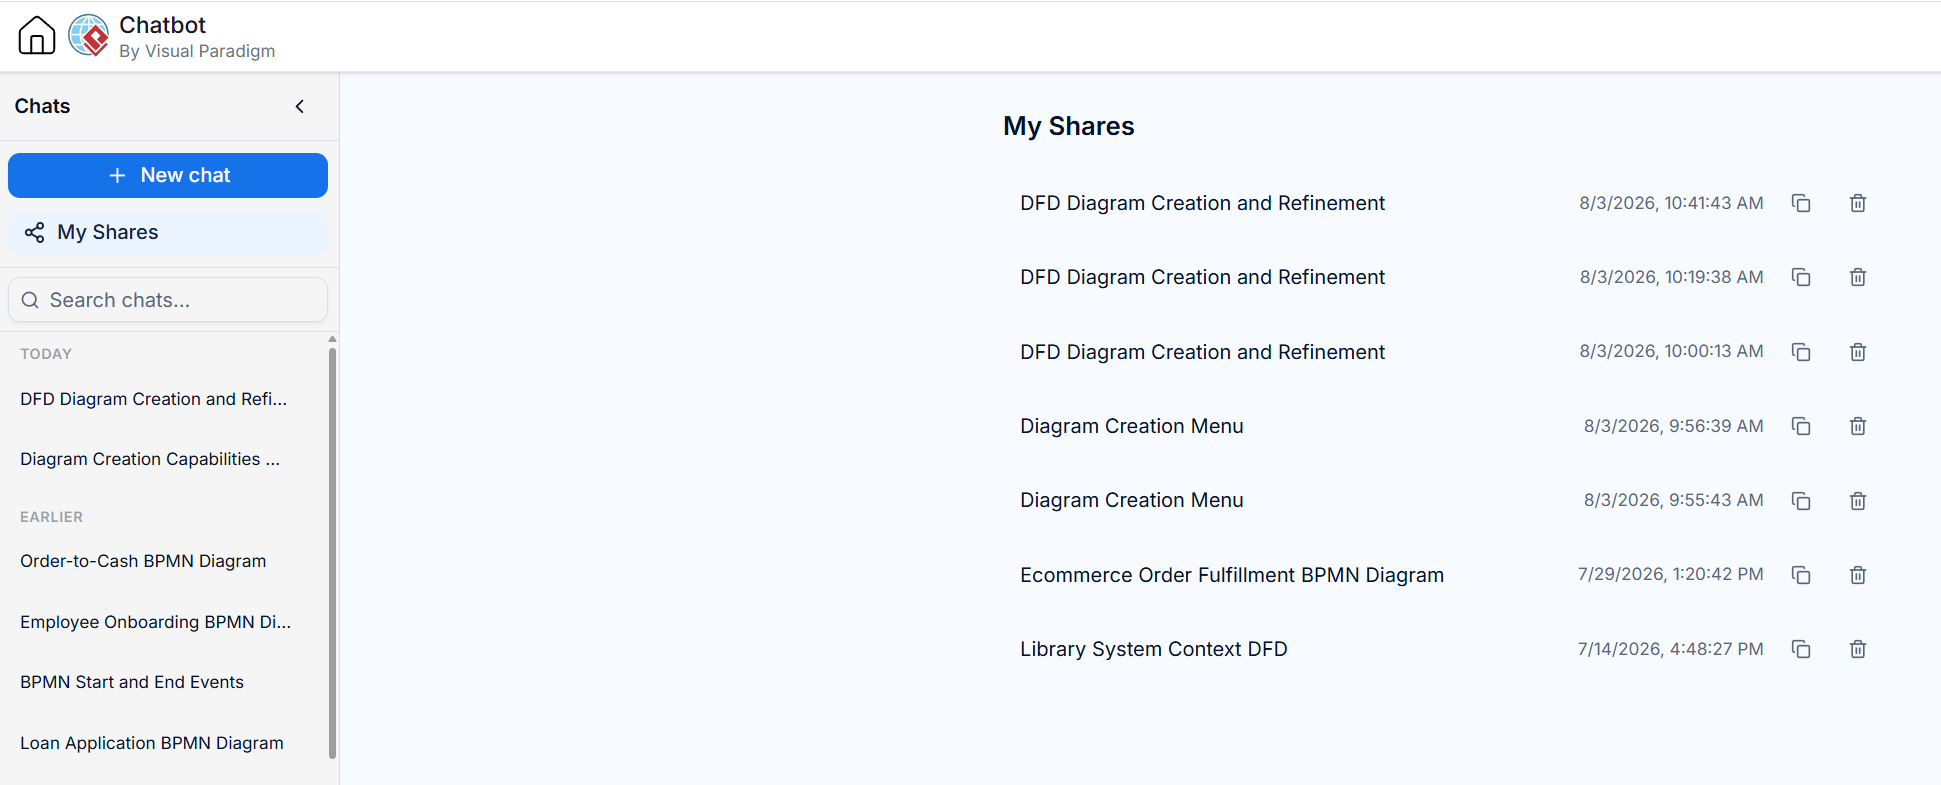
Step 6: Collaboration Through Sharing
Share your AI session URL with team members to enable collaborative refinement, ensuring everyone works from the same contextual baseline.
Key Concepts and Examples Summary
| Concept | Description | Example |
|---|---|---|
| Context Diagram | Level 0 view showing system as one process + external entities. | Online Store System ↔ Customer, Supplier |
| Balancing | Ensuring inputs/outputs at parent level match child level. | If Level 0 has “Order Info” input, Level 1 must consume it. |
| Decomposition | Breaking complex processes into manageable sub-processes. | “Process Order” → “Validate Stock”, “Charge Card”, “Generate Invoice” |
| Diagram as Code | Using text-based syntax (Graphviz) to generate visuals. | P1 -> P2 [label="Order Total"]; renders as an arrow. |
| AI Top-Down Refinement | Conversational drilling down while maintaining hierarchy. | Asking AI to “Zoom in on Payment” creates linked Level 2. |
Additional DFD Examples
- Customer Service System
- Food Ordering System
- Securities Trading
- Supermarket App
- Vehicle Maintenance Depot
- Video Rental Store
Conclusion
AI-assisted top-down decomposition represents a significant evolution in system modeling. By pairing the rigorous methodology of traditional DFDs with the generative power of the Visual Paradigm AI Chatbot, analysts can focus on logical correctness rather than graphical layout. The ability to converse with your model, drill down into specific processes, and maintain persistent shared sessions transforms DFD creation from a solitary documentation task into a dynamic, collaborative design activity. Whether you are architecting a new e-commerce platform or re-engineering legacy workflows, combining manual expertise with AI assistance ensures clarity, consistency, and alignment across all levels of system abstraction.
Recommended Resources: Visual Paradigm DFD & AI Tools
- AI Data Flow Diagram Generator by Visual Paradigm: Official guide on using the VP AI Chatbot specifically for generating and refining DFDs through natural language prompts.
- Understanding Data Flow Diagram Levels and Levelling Criteria: Detailed explanation of DFD hierarchy, balancing rules, and criteria for determining when to decompose a process further.
- What is Data Flow Diagram?: Comprehensive overview of DFD fundamentals, including symbol definitions, logical vs. physical distinctions, and best practices.
- AI Yourdon DeMarco DFD Generator: Specialized guide for generating DFDs using the classic Yourdon/DeMarco notation style via AI assistance.
- Online DFD Maker Features: Feature breakdown of Visual Paradigm’s web-based DFD editor, highlighting manual editing capabilities alongside AI generation.
This post is also available in Deutsch, Español and English.
Related posts:
 🚀 Simplify Complex Workflows with Visual Paradigm AI Sequence Diagram Tool!
 AI Animated Banner Generator Review: The Ultimate Tool for Instant Marketing Visuals
Review: Unleashing Creativity with the AI-Powered Flipbook Maker
From Idea to Strategy: My Journey Mastering Business Model Canvas with Visual Paradigm’s AI-Powered Tools
AI Animated Banner Generator Review: The Ultimate Tool for Instant Marketing Visuals
Review: Unleashing Creativity with the AI-Powered Flipbook Maker
From Idea to Strategy: My Journey Mastering Business Model Canvas with Visual Paradigm’s AI-Powered Tools