


What is Fishbone Diagram?
Fishbone Diagram (also known as Cause and Effect Diagram or Ishikawa Diagram) visually displays multiple causes for a problem. It helps identify stakeholder ideas about the causes of problems and allows the user to immediately categorize ideas into themes for analysis or further data gathering. It may be used in conjunction of the “five-whys” technique.
When do You Use It?
- When identifying possible causes for a problem
- When having difficulty understanding contributing factors or causes of a system failure
- Most helpful as a team process
5 Steps to Prepare Fishbone Diagram?
- Agree on the problem statement (also referred to as the effect). — Written at the mouth of the fish.
- Agree on the major categories of causes of the problem. Written as branches from the main arrow. — Major categories include: equipment or supply factors, environmental factors, rules/policy/procedure factors, and people/staff factors
- Brainstorm all the possible causes of the problem. Ask “why does this happen?” — Write it as a branch from the appropriate category.
- Again asks “Why does this happen?” about each cause. — Write sub-causes branching off the cause branches.
- Ask “Why?” and generate deeper levels of causes and continue organizing them under related causes or categories.
What are some potential pitfalls?
- Easy to focus on the symptoms instead of the causes of the problem
- Without input from key players, it’s easy to make assumptions about what you think the problems are instead of what the problems actually are
Looking for the Best Easy Software For Creating Fishbone Diagram?
Creating a Fishbone Diagram with Visual Paradigm
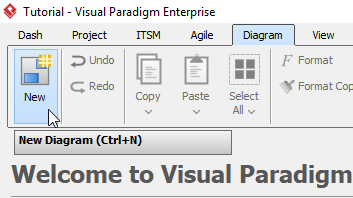
- Click Diagram > New form the toolbar.
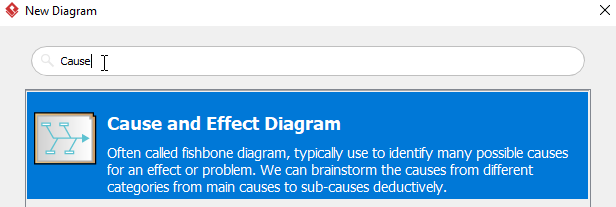
2. In the New Diagram window, choose Cause and Effect Diagram (a fishbone diagram is also know as a cause and effect diagram), then click Next at the bottom of the window.
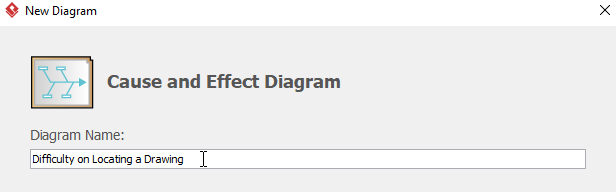
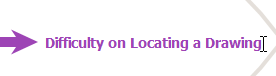
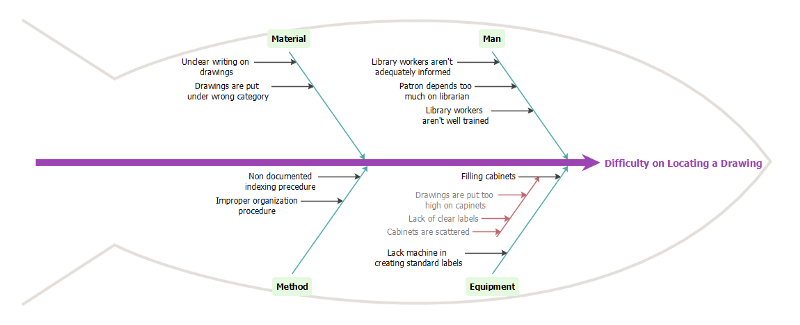
3. Name the diagram (for example: Difficulty on Locating a Drawing), then click OK to finish creating a new diagram.
4. You will then see something like this:
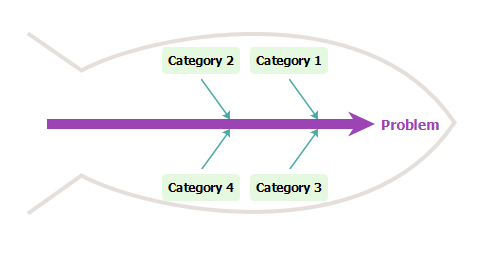
5. Double click Problem on the right hand side of the diagram, then rename it. In this case, we will rename it to Difficulty on Locating a Drawing.
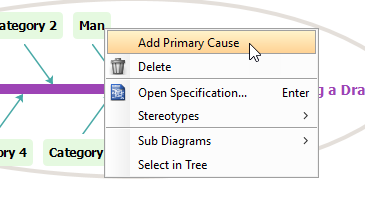
6. Double click Category1 to rename it to Man, then right click Man and select Add Primary Cause from the toolbar to create a new primary cause.
7. Double click Cause and rename it to Library workers aren’t adequately informed, then create a secondary cause by right clicking Library workers aren’t adequately informed and select Add Secondary Cause.
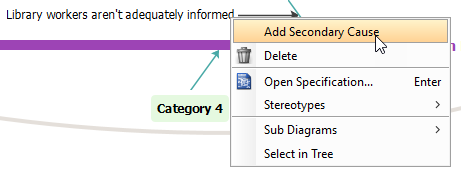
8. Rename the secondary cause Cause by double clicking it.
9. Repeat step 5 to 8 above to create more primary and secondary causes.
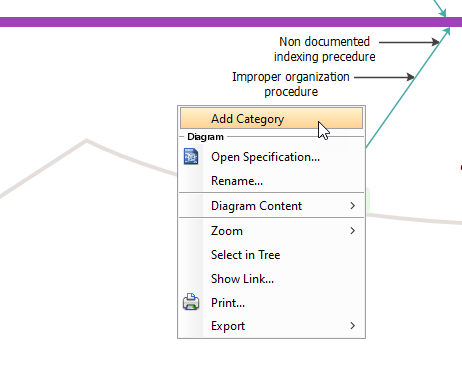
10. To create a new category, right click any empty space inside the fish, then select Add Category from the toolbar.
11. You will see something like this when you finish your diagram:
Other Fishbone Diagram Resources
How to Create a Fishbone Diagram? — Visual Paradigm
Cause and Effect Diagram Tool
This post is also available in Deutsch, Español, فارسی, Français, English, Bahasa Indonesia, 日本語, Polski, Portuguese, Ру́сский, Việt Nam, 简体中文 and 繁體中文.