


Data Flow diagrams (DFDS) represent the flow of information through the system. DFDs quickly became a popular way to visualize the major steps and data involved in software system processes.
A data-flow diagram (DFD) is a way of representing a flow of data of a process or a system (usually an information system), for example:
- Where Data Comes From?
- Where It Goes?
- How It Gets Stored?
In other words, it shows how data is processed by a system in terms of inputs and outputs using top-down decomposition techniques (or known as stepwise refinement.
What is Stepwise Refinement?
One of the effective way to solve a complex problem is to break it down into simpler sub-problems. You start by breaking down the whole task into simpler parts.
Step-by-step refinement is essentially a decomposition of the system to gain insight into the subsystems that make up the system, known as the top-down decomposition method.
For example, a system overview is developed as a system context diagram that specifies, but does not specify, any level of the subsystem. Each of these subsystems is then refined to greater detail (such as levels 0, 1, 2, and so on in DFD), sometimes at many additional subsystem levels, until the entire specification is reduced to basic elements.
As is common, the brainstorm has resulted in ideas (actually, things for our to-do list) that are at different levels of “detail” — some of them are “lower down” than others, or, we might say, some contain others.
Let’s arrange these hierarchically. In other words, let’s identify which steps are a part of another step. One way to do this is to think of each action as a set of action.
Stepwise Refinement Example
Clean house
{Vacuum dining room , Tidy up living room}
Cook
{Choose recipe , Shop for ingredients , Roast Chicken . Do Veggies}
Set Table
{Find table cloth , Get plates out , Put out glassware , Put out silverware , Napkins}
Roast chicken
{Pre heat oven to 400 , Put chicken in pan , Leave chicken in 400 oven for 90 minutes}
Do Veggie
{Chop vegetables , Cook vegetables}
(*Source: Top-down design and Step-wise refinement — Wiki books)
Once these basic elements are identified, we can build them into computer modules. Once they’re built, we can put them together and make the whole system out of these individual components.
Top-Down Decomposition Technique in DFD
In DFD, the top-down decomposition (also called leveling or stepwise refinement) is a technique used to show more detail in lower-level DFDs. Leveling is done by drawing a series of increasingly detailed diagrams until the desired degree of detail is reached. As shown in the Figure, DFD Leveling is first displaying the targeted system as a single process, and then showing more detail until all processes are functional primitives.
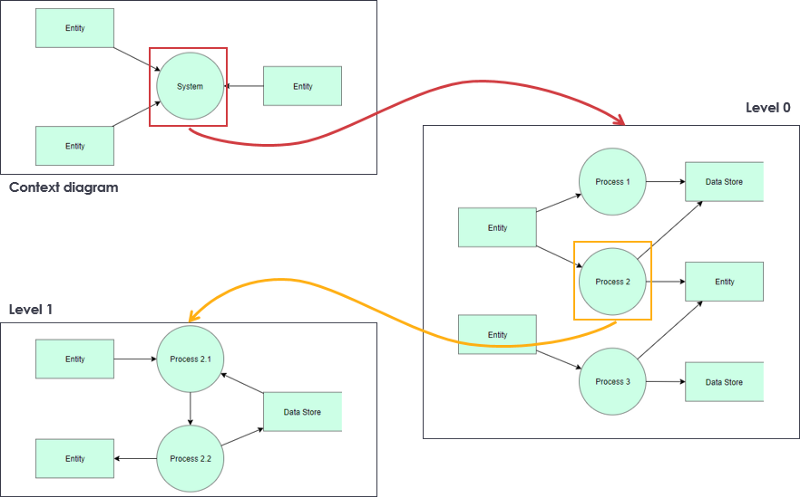
- DFDs That Are At A Higher Level Are Less Detailed
- High-Level DFDs Are To Be Decomposed Into More Detailed DFDs At Lower Levels
- The Context Diagram Is The Highest In The Hierarchy (See DFD Creation Rules). The So-Called Zero Level Is Followed By DFD 0, Starting With Process Numbering (E.G., Process 1, Process 2).
- In The Next, The So-Called First Level — DFD 1 — The Numbering Continues. E.G. Process 1 Is Divided Into The First Three Levels Of The DFD, Which Are Numbered 1.1, 1.2 And 1.3.
- Similarly, Processes In The Second Level (DFD 2) Are Numbered E.G. 1.1.1, 1.1.2, 1.1.3 And 1.1.4.
- The Number Of Levels Depends On The Size Of The Model System. Each Of The Processes In Level 0 May Not Have The Same Number Of Decomposition Levels.
DFD Examples — Customer Services System Example
The data flow diagram is a hierarchy of diagram consist of:
- Context Diagram (conceptually level zero)
- The Level-1 DFD
- And possible Level-2 DFD and further levels of functional decomposition depending on the complexity of your system
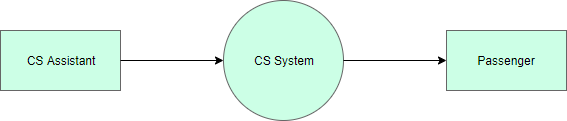
Context DFD
The figure below shows a context Data Flow Diagram that is drawn for a railway company’s Customer Service System. It contains a process (shape) that represents the system to model, in this case, the “CS System“. It also shows the participants who will interact with the system, called the external entities. In this example, the CS Assistant and Passenger are the two entities that will interact with the system. In between the process and the external entities, there is data flow (connectors) that indicate the existence of information exchange between the entities and the system.
Edit this Yourdon and Coad DFD Example
Context DFD is the entrance of a data flow model. It contains one and only one process and does not show any data store.
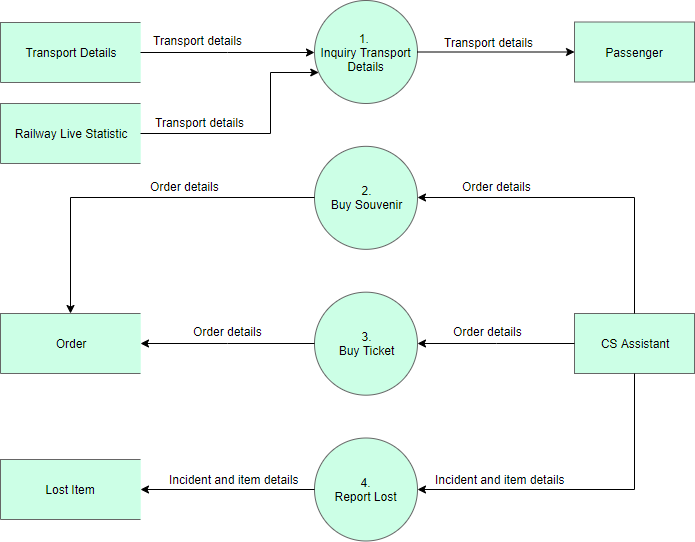
Level 1 DFD
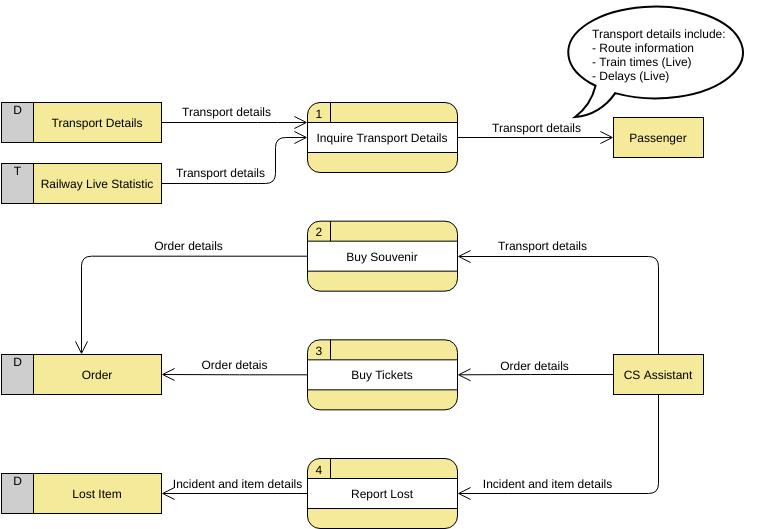
The figure below shows the level 1 DFD, which is the decomposition (i.e. break down) of the CS System process shown in the context DFD. Read through the diagram and then we will introduce some of the key concepts based on this diagram.
Edit this Yourdon and Coad Diagram Example
The CS System Data Flow Diagram example contains four processes, two external entities, and four data stores. Although there are no design guidelines that govern the positioning of shapes in a Data Flow Diagram, we tend to put the processes in the middle and data stores and external entities on the sides to make it easier to comprehend.
Based on the diagram, we know that a Passenger can receive Transport details from the Inquiry Transport Details process, and the details are provided by the data stores Transport Details and Railway Live Statistic. While data stored in Transport Details are persistent data (indicated by the label “D”), data stored in Railway Live Statistic are transient data that are held for a short time (indicated by the label “T”). A callout shape is used to list out the kind of details that can be inquired by a passenger.
CS Assistant can initiate the Buy Souvenir process, which will result in having the Order details stored in the Order data store. Although the customer is the real person who buys souvenirs, it is the CS Assistant who accesses the system for storing the order details. Therefore, we make the data flow from the CS Assistant to the Buy Souvenir process.
CS Assistant can also initiate the Buy Ticket process by providing Order details and the details will be stored again in the Order data store. Data Flow Diagram is a high-level diagram that is drawn with a high degree of abstraction. The data store Order which is drawn here does not necessarily imply a real order database or order table in a database. The way how order details are stored physically is to be decided later on when implementing the system.
Finally, CS Assistant can initiate the Report Lost process by providing the Incident and item details and the information will be stored in the Lost Item database.
Learn More DFD by Examples
This post is also available in Deutsch, Español, فارسی, Français, English, Bahasa Indonesia, 日本語, Polski, Portuguese, Ру́сский, Việt Nam, 简体中文 and 繁體中文.