


A dashboard is a collection of resources assembled to create a single unified visual display such as:
- Chart
- Infographics
- illustrations
- Diagrams
- Images
- etc.
Today I introduce a FREE online tool called Visual Paradigm Online that facilitates the creation of the above Visual Representation in one easy and yet FREE unified dashboard.
(Open and Edit the above Example Instantly)
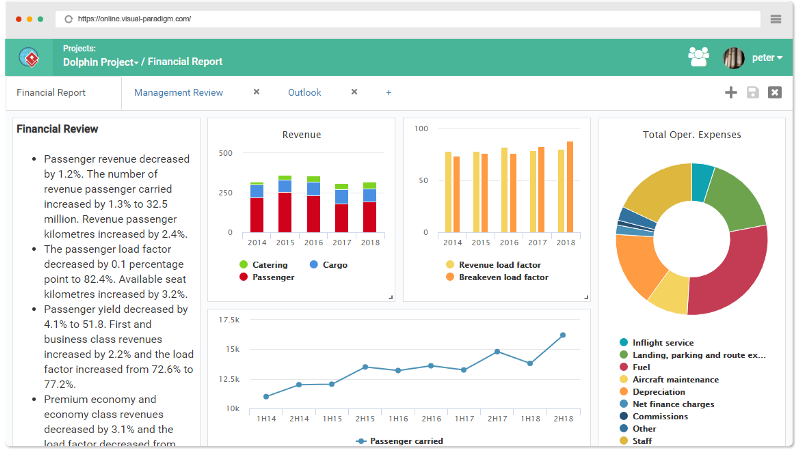
The dashboard above is an example for financial report. Dashboard is a tool that helps you present data in a way that helps other understand your data. You can create your dashboard with charts, maps and plots.
A top-rated dashboard solution
Visual Paradigm Online helps you visualize your data into valuable insights. Build dashboards and perform ad-hoc data analyses in just a few steps. A wide range of chart and graph are available to fulfill different business needs. Together with the intuitive spreadsheet editor, anyone can visualize data in few minutes. No coding, just insight.
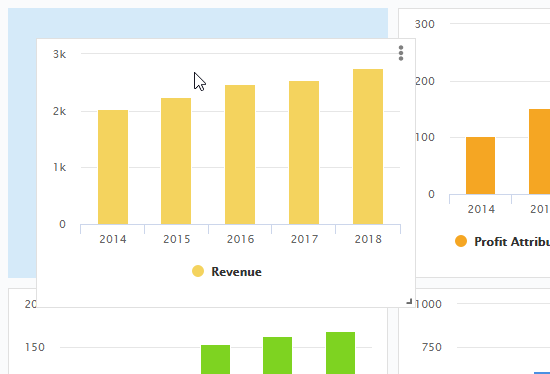
Easy dashboard creation
Anyone can make dashboard with intuitive drag & drop.
- Drag and drop to resize dashboard components. Content will be auto scaled and fit.
- Drag to move dashboard components. Components will be auto re-positioning for optimal layout.
Wide range of data visualization options
Assemble your custom dashboard with standard data visualizations like charts, maps and plots. Or embed a diagram, custom text or image into the chart. Hundreds of charts and diagrams are available. The choice is yours.s
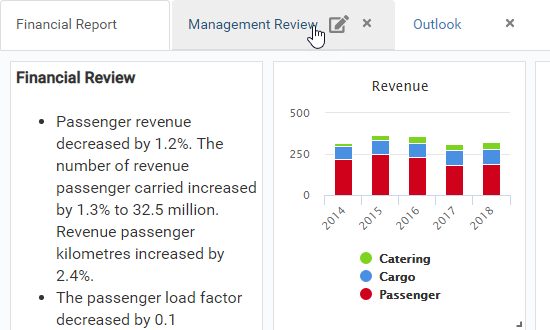
Multiple pages
Too much content? Want to visualize data from multiple angles? You can make information on a dashboard easier to understand by chunking the content into multiple pages.
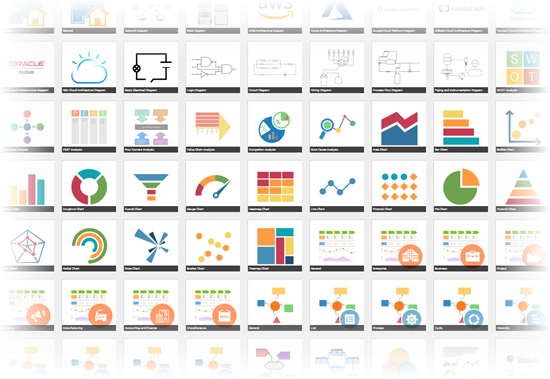
Wide Variety of Visuals
Create an unlimited number of diagrams, charts and other visuals from a wide range of diagram types. Get a head start with pre-made templates, or create your own.
Diagrams
- Capable for many business, technical and general diagram types including flowcharts, UML, mind maps, AWS… and a lot more!
Data Visualization
- Visualize data with dashboards and charts and perform data analyses in just a few steps.
Process Map Designer
- Design process, roadmap and matrix with Process Map Designer. 40+ templates (e.g. Customer Journey Map) are provided.
Build Visual Components with Visual Paradigm Online – 1100+ diagram examples and Templates
This post is also available in Deutsch, Español, فارسی, Français, English, Bahasa Indonesia, 日本語, Polski, Portuguese, Ру́сский, Việt Nam, 简体中文 and 繁體中文.