
Introduction
Unified Modeling Language (UML) has long been associated with heavyweight, documentation-driven development processes. However, when applied thoughtfully, UML can be a powerful tool for Agile teams. The key is using UML as a communication aid rather than a documentation burden—creating just enough visual models to enhance understanding without slowing down delivery.
Why UML in Agile?
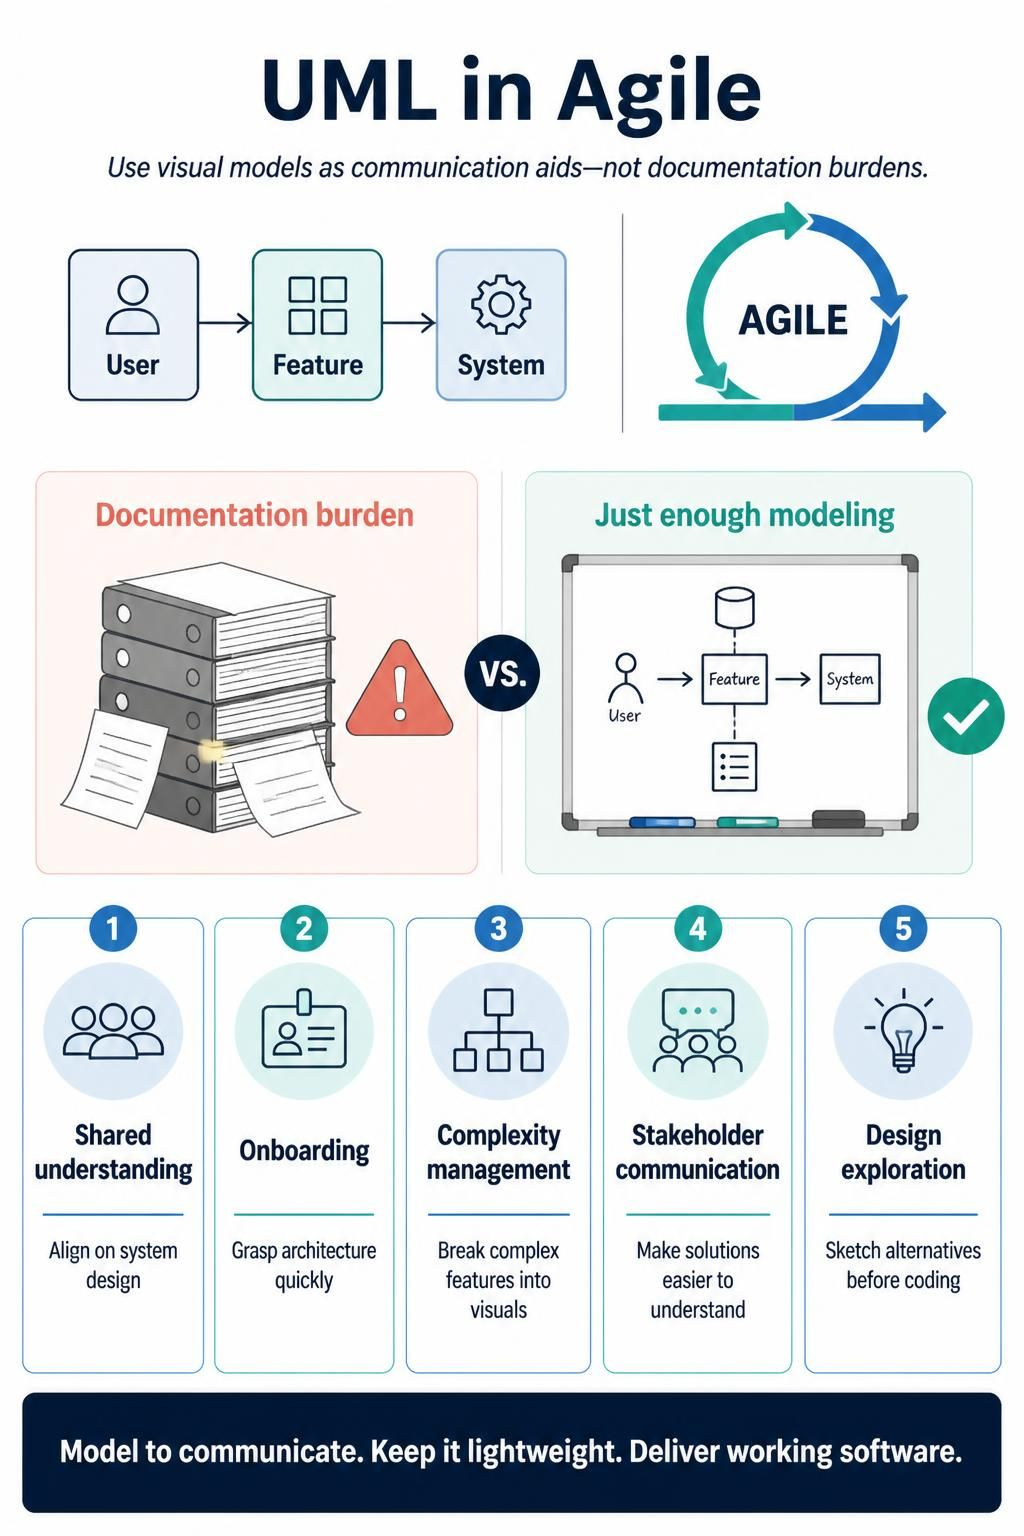
Agile teams value working software over comprehensive documentation, but they also value clear communication. UML diagrams serve several purposes in Agile contexts:
-
Shared understanding: Visual models help team members align on system design
-
Onboarding: New team members can quickly grasp architecture and relationships
-
Complexity management: Breaking down complex features into visual representations
-
Stakeholder communication: Non-technical stakeholders can better understand proposed solutions
-
Design exploration: Quickly sketching alternatives before committing to code
Core Principles for Agile UML
1. Just Enough, Just in Time
Create diagrams only when they add value. Don’t diagram everything upfront. Create models when you encounter complexity that’s hard to discuss verbally or in text alone.
2. Whiteboard Over Documentation
Prefer sketching on whiteboards, digital collaboration tools, or napkins over creating formal, polished diagrams. The goal is conversation, not perfection.
3. Evolve with the Code
Treat diagrams as living artifacts. Update them when the code changes significantly, or discard them if they’re no longer relevant. Avoid letting diagrams become outdated relics.
4. Focus on Communication, Not Completeness
A good Agile UML diagram communicates the specific point you need to make. It doesn’t need to show every attribute, method, or relationship.
5. Collaborative Creation
Create diagrams together during refinement sessions, design discussions, or sprint planning. The act of drawing together builds shared understanding.
Essential UML Diagrams for Agile Teams
Not all 14 UML diagram types are equally useful for Agile teams. Focus on these high-value diagrams:
1. Class Diagrams
When to use: Understanding domain models, defining data structures, clarifying relationships between entities
Agile approach:
-
Show only relevant classes for the current feature or sprint
-
Include key attributes and methods that matter for the discussion
-
Use simplified notation—skip visibility markers unless important
-
Focus on relationships (associations, inheritance, composition)
Example scenario: During backlog refinement for a new e-commerce feature, sketch classes for Product, Cart, and Order to clarify how they interact.
2. Sequence Diagrams
When to use: Understanding interactions between components, clarifying API calls, debugging complex flows
Agile approach:
-
Model one specific user story or interaction path
-
Show only the objects/components involved in that flow
-
Keep it horizontal—limit to 5-7 lifelines for readability
-
Use for discussing integration points or asynchronous behavior
Example scenario: Mapping out the sequence of events when a user checks out, showing interactions between frontend, payment service, inventory service, and notification service.
3. Activity Diagrams
When to use: Modeling business processes, workflow logic, decision points
Agile approach:
-
Focus on one process or user journey
-
Use swimlanes to show responsibility across teams or systems
-
Keep decision points simple
-
Great for acceptance criteria clarification
Example scenario: Diagramming the approval workflow for expense reports, showing different paths based on amount and department.
4. Component Diagrams
When to use: Understanding system architecture, microservices boundaries, deployment concerns
Agile approach:
-
Show high-level components and their interfaces
-
Useful for discussing technical debt or refactoring opportunities
-
Helps visualize dependencies between services
Example scenario: During architectural review, showing how the user authentication component interacts with the user profile service and session management.
5. State Machine Diagrams
When to use: Modeling objects with complex lifecycle states, order processing, workflow engines
Agile approach:
-
Focus on one entity with meaningful state transitions
-
Clearly label triggers and conditions
-
Helpful for identifying edge cases
Example scenario: Modeling an order’s states (Created, Paid, Shipped, Delivered, Returned) and valid transitions between them.
6. Use Case Diagrams
When to use: Initial project scoping, stakeholder alignment, identifying actors and goals
Agile approach:
-
Use sparingly—often user stories are sufficient
-
Helpful early in a project to identify scope boundaries
-
Keep at a high level; don’t drill into details
Example scenario: Early discovery phase to identify all actor types (Customer, Admin, Support Agent) and their primary goals.
When NOT to Use UML
Avoid UML when:
-
The concept is simple enough to explain in words
-
You’re creating diagrams nobody will reference again
-
The diagram takes longer to create than the feature takes to build
-
You’re documenting something that’s already clear in the code
-
Stakeholders won’t understand or engage with the diagram
Practical Integration into Agile Ceremonies
Backlog Refinement
-
Sketch class or sequence diagrams to clarify complex stories
-
Use activity diagrams to walk through acceptance criteria
-
Capture decisions and assumptions visually
Sprint Planning
-
Use component diagrams to identify dependencies between stories
-
Clarify technical approach with quick sketches
-
Estimate more accurately by visualizing complexity
Daily Standups
-
Reference existing diagrams when discussing blockers
-
Update diagrams if implementation diverges from design
Sprint Reviews
-
Show before/after diagrams to demonstrate architectural improvements
-
Use visuals to explain technical achievements to stakeholders
Retrospectives
-
Identify where better visualization could have prevented misunderstandings
-
Discuss whether certain diagrams added value or were waste
Design Sessions
-
Whiteboard multiple alternatives using UML notation
-
Vote on approaches based on clarity and feasibility
-
Capture agreed-upon design for future reference
Tools and Techniques (Without Specific Tool Recommendations)
Low-Fidelity Approaches
-
Whiteboards and markers
-
Paper and pencil
-
Napkin sketches
-
Sticky notes arranged on walls
Digital Collaboration
-
Shared digital whiteboards
-
Screen sharing during remote sessions
-
Simple drawing tools built into collaboration platforms
-
Text-based UML that can be version-controlled
Version Control for Diagrams
-
Store diagrams alongside code in repositories
-
Use formats that support diffing and merging
-
Treat diagram updates as part of pull requests when significant
Common Pitfalls and How to Avoid Them
Pitfall 1: Over-Engineering Diagrams
Problem: Spending hours perfecting notation, colors, and layout
Solution: Set time limits. If a diagram takes more than 15-20 minutes to create, it’s probably too detailed.
Pitfall 2: Creating Diagrams No One Reads
Problem: Generating comprehensive documentation that becomes obsolete
Solution: Only create diagrams that serve an immediate communication need. Ask: “Who needs this, and when?”
Pitfall 3: Ignoring Diagrams After Creation
Problem: Diagrams diverge from implementation
Solution: Either keep diagrams updated as part of definition of done, or explicitly mark them as “snapshot in time” and accept they’ll become historical references.
Pitfall 4: Using UML as a Substitute for Conversation
Problem: Sending diagrams instead of discussing designs
Solution: Use diagrams as conversation starters, not replacements for dialogue. Walk through diagrams together.
Pitfall 5: Requiring UML Expertise
Problem: Team members feel excluded because they don’t know UML notation
Solution: Teach basics informally. Use simplified notation. Focus on concepts over strict syntax. Most people can understand boxes, arrows, and labels.
Scaling UML Across Multiple Teams
Architecture Decision Records (ADRs)
Include simple UML diagrams in ADRs to capture why certain architectural choices were made. This helps other teams understand context.
Interface Contracts
Use component or class diagrams to define APIs and interfaces between teams. This creates clear boundaries and expectations.
Onboarding Packages
Create a small set of key diagrams that help new team members understand the system. Keep this curated and updated.
Cross-Team Dependencies
Use sequence or component diagrams to visualize dependencies between teams’ services. This aids in coordination and identifies coupling.
Measuring Value
How do you know if UML is helping your Agile team?
Positive indicators:
-
Fewer misunderstandings during implementation
-
Faster onboarding for new team members
-
Clearer technical discussions
-
Reduced rework due to design flaws caught early
-
Stakeholders better understand technical constraints
Negative indicators:
-
Time spent on diagrams reduces velocity
-
Team members ignore or complain about diagrams
-
Diagrams are consistently outdated
-
Creating diagrams becomes a bureaucratic requirement
Adapting to Your Context
Every team is different. Consider these factors when deciding how to use UML:
Team maturity: Experienced teams may need fewer diagrams. Junior-heavy teams may benefit more from visual models.
System complexity: Simple CRUD applications rarely need extensive modeling. Complex distributed systems benefit from visualizing interactions.
Regulatory environment: Some industries require certain documentation. Find the minimum viable UML that satisfies compliance.
Remote vs. co-located: Remote teams may rely more on digital diagrams. Co-located teams can leverage physical whiteboards.
Stakeholder technical literacy: More technical stakeholders can engage with detailed diagrams. Business stakeholders need simpler, higher-level views.
Quick Reference: Which Diagram When?
| Situation | Recommended Diagram |
|---|---|
| Understanding data relationships | Class Diagram |
| Clarifying API interactions | Sequence Diagram |
| Modeling business workflows | Activity Diagram |
| Explaining system architecture | Component Diagram |
| Tracking object lifecycle | State Machine Diagram |
| Initial scope discovery | Use Case Diagram |
| Deployment concerns | Deployment Diagram |
| Parallel processes | Activity Diagram with Swimlanes |
Conclusion
UML in Agile is about pragmatic communication, not comprehensive documentation. The most successful Agile teams use UML selectively, collaboratively, and lightly. They create diagrams when visual thinking adds value, keep them simple and focused, and aren’t afraid to discard them when they’ve served their purpose.
Remember: the goal isn’t to produce perfect UML diagrams. The goal is to build the right software, and sometimes a quick sketch helps everyone get on the same page faster than words alone. Start small, experiment with what works for your team, and let your practices evolve based on actual value delivered.
The best UML diagram is the one that prevents a misunderstanding, accelerates a decision, or clarifies a complex concept—and then gets out of the way so the team can focus on delivering value.
Reference
- Mastering UML Class Diagrams: A Practical User’s Guide to Visual Paradigm: Step-by-step guide for creating class diagrams, managing visibility, and using advanced techniques like generalization sets.
- Unleash Your Creativity with Visual Paradigm Online Free Edition: Overview of the free online edition’s features, including unlimited diagrams, export formats, and cross-platform support.
- Practical 3: Structural Implementation: Practical session on generating class diagrams with AI, drawing component diagrams, and creating deployment diagrams.
- How Visual Paradigm’s AI Chatbot Revolutionizes Diagram Creation: Explains how the AI chatbot enables conversational diagram creation with true modeling intelligence and contextual understanding.
- Visual Paradigm for UML Quick Start: Official quick start guide covering environment, creating diagrams, documenting model elements, and basic formatting.
- How to Create UML Use Case Diagram in Visual Paradigm: Tutorial on creating use case diagrams with actors, system boundaries, and include/extend relationships.
- Visual Paradigm VPasCode: Comprehensive Guide: Guide to the diagram-as-code tool supporting PlantUML, Mermaid, and Graphviz with AI generation and live preview.
- Visual Paradigm Community Circle – Diagramming and Modeling: Documentation covering diagram editing, modeling utilities, model grids, and chart diagrams.
- Mastering Sequence Diagram Modeling: A Practical Approach with Visual Paradigm: Practical examples for sequence diagrams covering basic interaction, conditional behavior, loops, and exception handling.
- Systematic Review of UML Diagramming Software Tools for Higher Education: Academic review noting Visual Paradigm was rated best at collaboration features among top tools.
Related posts:
 Visual Paradigm AI: Generate Professional UML Use Case Diagrams from Text in Seconds
 GourmetReserve Development Simplified: Transforming Requirements with the Best AI-Powered Use Case Modeling Studio
 The Best AI-Powered Database Modeling Tool for Designing Hospital Systems: Visual Paradigm Online
 Automating Student Record System Analysis: From Raw Text to Class Models with Visual Paradigm