
1. Introduction to Data Flow Diagrams (DFDs)
A Data Flow Diagram (DFD) is a graphical representation of how data flows through a system — showing where data originates, how it’s transformed, where it’s stored, and where it ultimately lands. Unlike flowcharts (which focus on control flow and sequence), DFDs emphasize data movement and transformation without worrying about timing or order of execution.
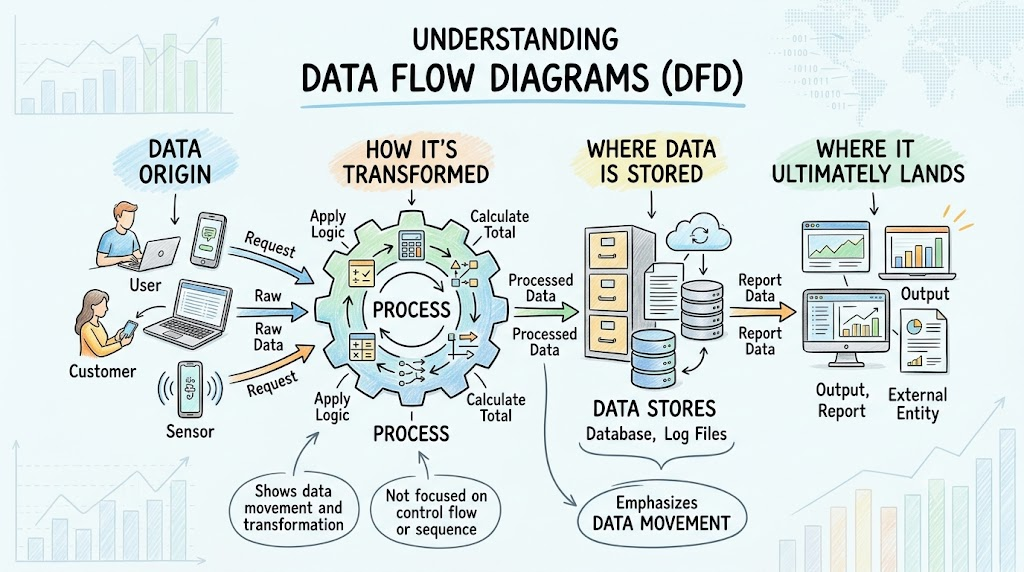
Why use DFDs?
- Analyze an existing system or design a new one
- Identify data inputs, outputs, and stores early
- Communicate system boundaries and data requirements to stakeholders
- Decompose complexity from a bird’s-eye view down to implementation detail
2. The Four Core Components of a DFD
Every DFD, at any level, is built from just four basic elements (Gane-Sarson notation):
| Component | Notation | Role | Example |
|---|---|---|---|
| External Entity | Rectangle | Source or destination of data outside the system boundary | Customer, Payment Gateway |
| Process | Circle | Transforms incoming data into outgoing data | “Place Order”, “Authorize Payment” |
| Data Store | Record / open rectangle | A place where data is held for later use | Orders, Product Inventory |
| Data Flow | Arrow (labeled) | The movement of data between the above | “Order Details”, “Payment Status” |
💡 Key rule: A process must have both input and output flows. A process with only inputs or only outputs is a modeling error — every transformation produces a result.
3. DFD Levels — The Top-Down Pyramid
The power of top-down decomposition is that you start abstract and add detail iteratively. Each level has a standard numbering convention:
| Level | Name | Content |
|---|---|---|
| Level 0 | Context Diagram | Single process (the whole system), all external entities, and their flows — no data stores, no internal detail |
| Level 1 | System DFD | The system decomposed into major processes (1.0, 2.0, 3.0…), internal data stores, and flows |
| Level 2 | Sub-Diagram | A single Level-1 process decomposed into finer processes (2.1, 2.2, 2.3…) |
| Level 3 | Sub-Sub-Diagram | A single Level-2 process decomposed further (2.2.1, 2.2.2, 2.2.3…) |
The numbering tells you exactly where you are in the hierarchy — 2.2.4 belongs to 2.2, which belongs to 2.0. This tree structure keeps large systems navigable.
4. The House Style (Color Legend)
Every diagram in this guide follows one consistent visual convention. In Graphviz, the recipe is: style first, then declare, then connect.
| Element | Shape | Fill | Border | Purpose |
|---|---|---|---|---|
| External Entity | box |
#E1F5FE |
#0288D1 |
Who is outside |
| Process | circle |
#E8F5E9 |
#388E3C |
What transforms data |
| Data Store | record |
#FFF9C4 |
#FBC02D |
Where data rests |
| Parent Process (ref) | circle |
#FCE4EC |
#C2185B |
Context outside current level |
| System Boundary | dashed,rounded cluster |
#FAFAFA / #757575 |
Grey | Fence of the current diagram |
| Data Flow | arrow |
— | #555555 |
Movement of data |
⚠️ Important — a style template is NOT a diagram
A Graphviz file that only defines node/edge styles but never declares any nodes or edges will render as an empty canvas. A DFD needs three ingredients in order:
- Style the graph —
graph [...],node [...],edge [...]attributes. - Declare the elements — external entities (boxes), processes (circles), data stores (records), wrapped in a dashed
clusterboundary. - Draw the flows — explicit
A -> B [label="..."]edges, usingdir=bothfor two-way exchanges.
Compare these two — both validate fine, but only the second produces a picture:
❌ Style only (renders nothing):
digraph DFD {
    graph [rankdir = LR]
    node [shape = box, style = "filled", fillcolor = "#E1F5FE"]
    edge [color = "#555555", arrowsize = 0.8]
}
✅ Complete (renders):
digraph DFD {
    graph [rankdir = LR]
    node [style = "filled", fillcolor = "#E1F5FE", shape = box]
    Customer;
    // ...plus processes, data stores, boundary, and edges
}
5. The Top-Down Decomposition Process (Step by Step)
The Online Order Process System demonstrates the methodology. At every level you’ll get complete, runnable Graphviz code.
Step 1 — Build the Context Diagram (Level 0)
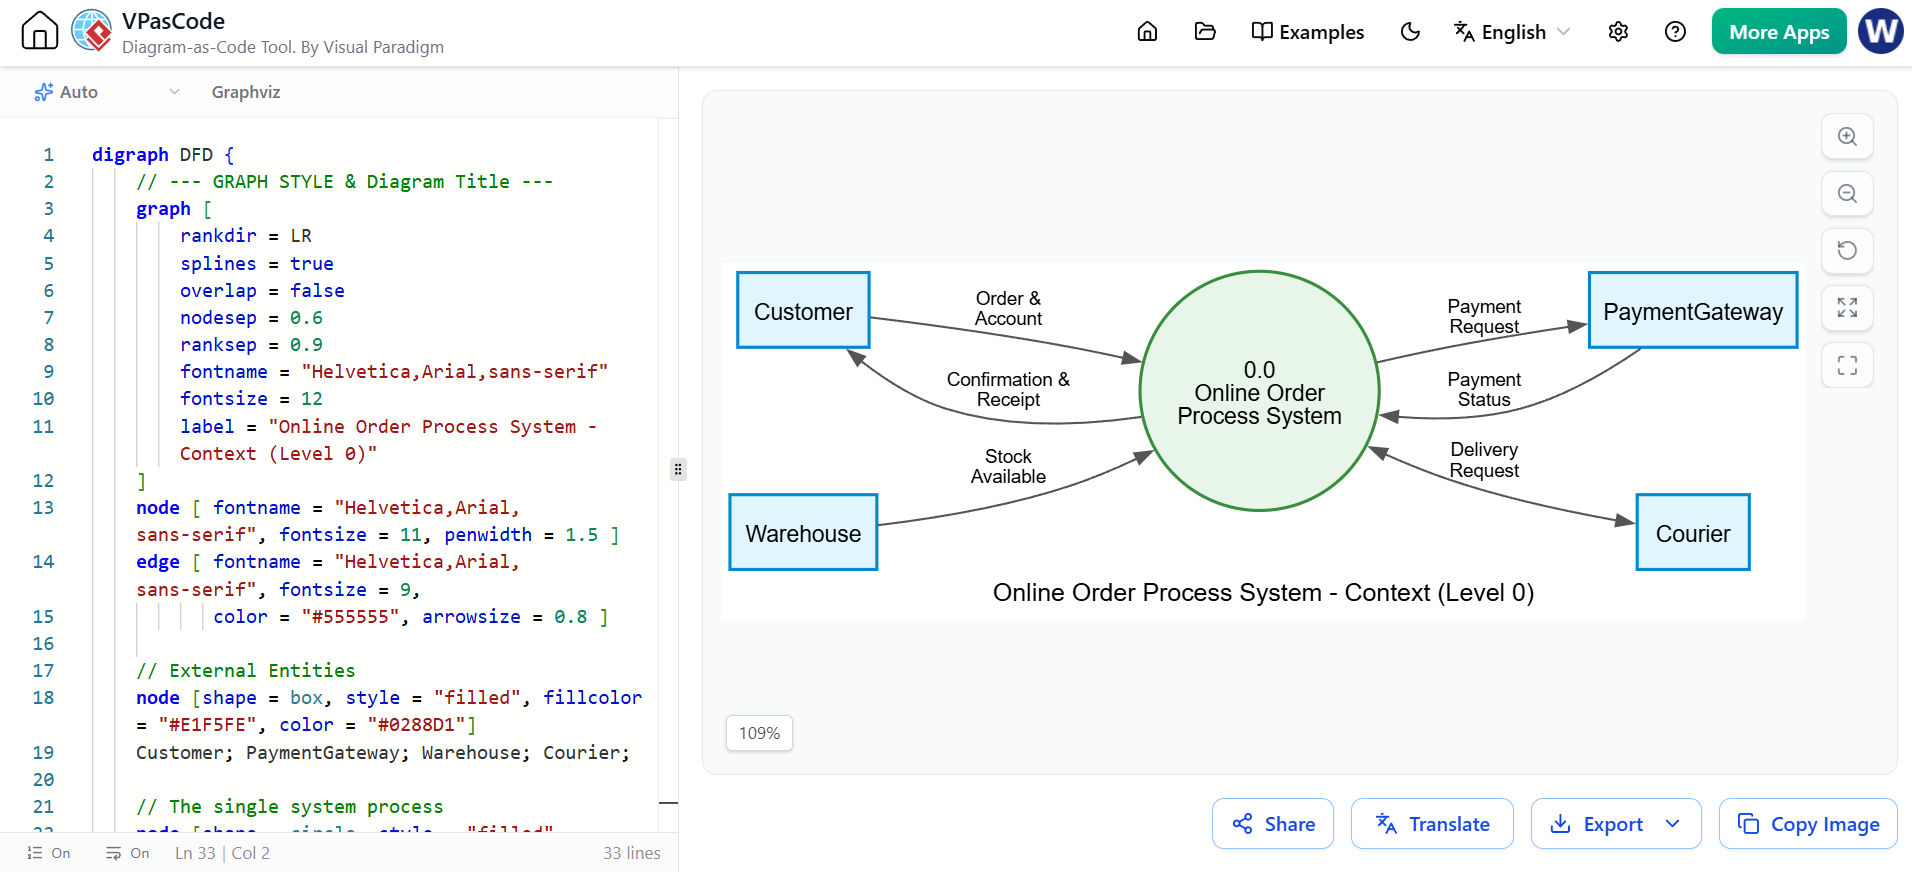
Start with the whole system as one single process and identify every interaction with the outside world. No data stores, no internal detail.
digraph DFD {
    // --- GRAPH STYLE & Diagram Title ---
    graph [
        rankdir = LR
        splines = true
        overlap = false
        nodesep = 0.6
        ranksep = 0.9
        fontname = "Helvetica,Arial,sans-serif"
        fontsize = 12
        label = "Online Order Process System - Context (Level 0)"
    ]
    node [ fontname = "Helvetica,Arial,sans-serif", fontsize = 11, penwidth = 1.5 ]
    edge [ fontname = "Helvetica,Arial,sans-serif", fontsize = 9,
           color = "#555555", arrowsize = 0.8 ]

    // External Entities
    node [shape = box, style = "filled", fillcolor = "#E1F5FE", color = "#0288D1"]
    Customer; PaymentGateway; Warehouse; Courier;

    // The single system process
    node [shape = circle, style = "filled", fillcolor = "#E8F5E9",
          color = "#388E3C", fixedsize = true, width = 1.6]
    System [label="0.0\nOnline Order\nProcess System"];

    // Data flows (bidirectional where data is exchanged both ways)
    Customer -> System [label="Order &\nAccount"];
    System -> Customer [label="Confirmation &\nReceipt"];
    System -> PaymentGateway [label="Payment\nRequest"];
    PaymentGateway -> System [label="Payment\nStatus"];
    Warehouse -> System [label="Stock\nAvailable"];
    System -> Courier [label="Delivery\nRequest", dir=both];
}
Interpretation: The context diagram answers “what are the boundaries of this system, and who does it talk to?” — it shows external entities and their flows, but hides all internal structure. We see the system takes orders from Customer, charges via PaymentGateway, checks inventory against Warehouse, and hands fulfillment to Courier.
Step 2 — Decompose into Level-1 (Major Processes)
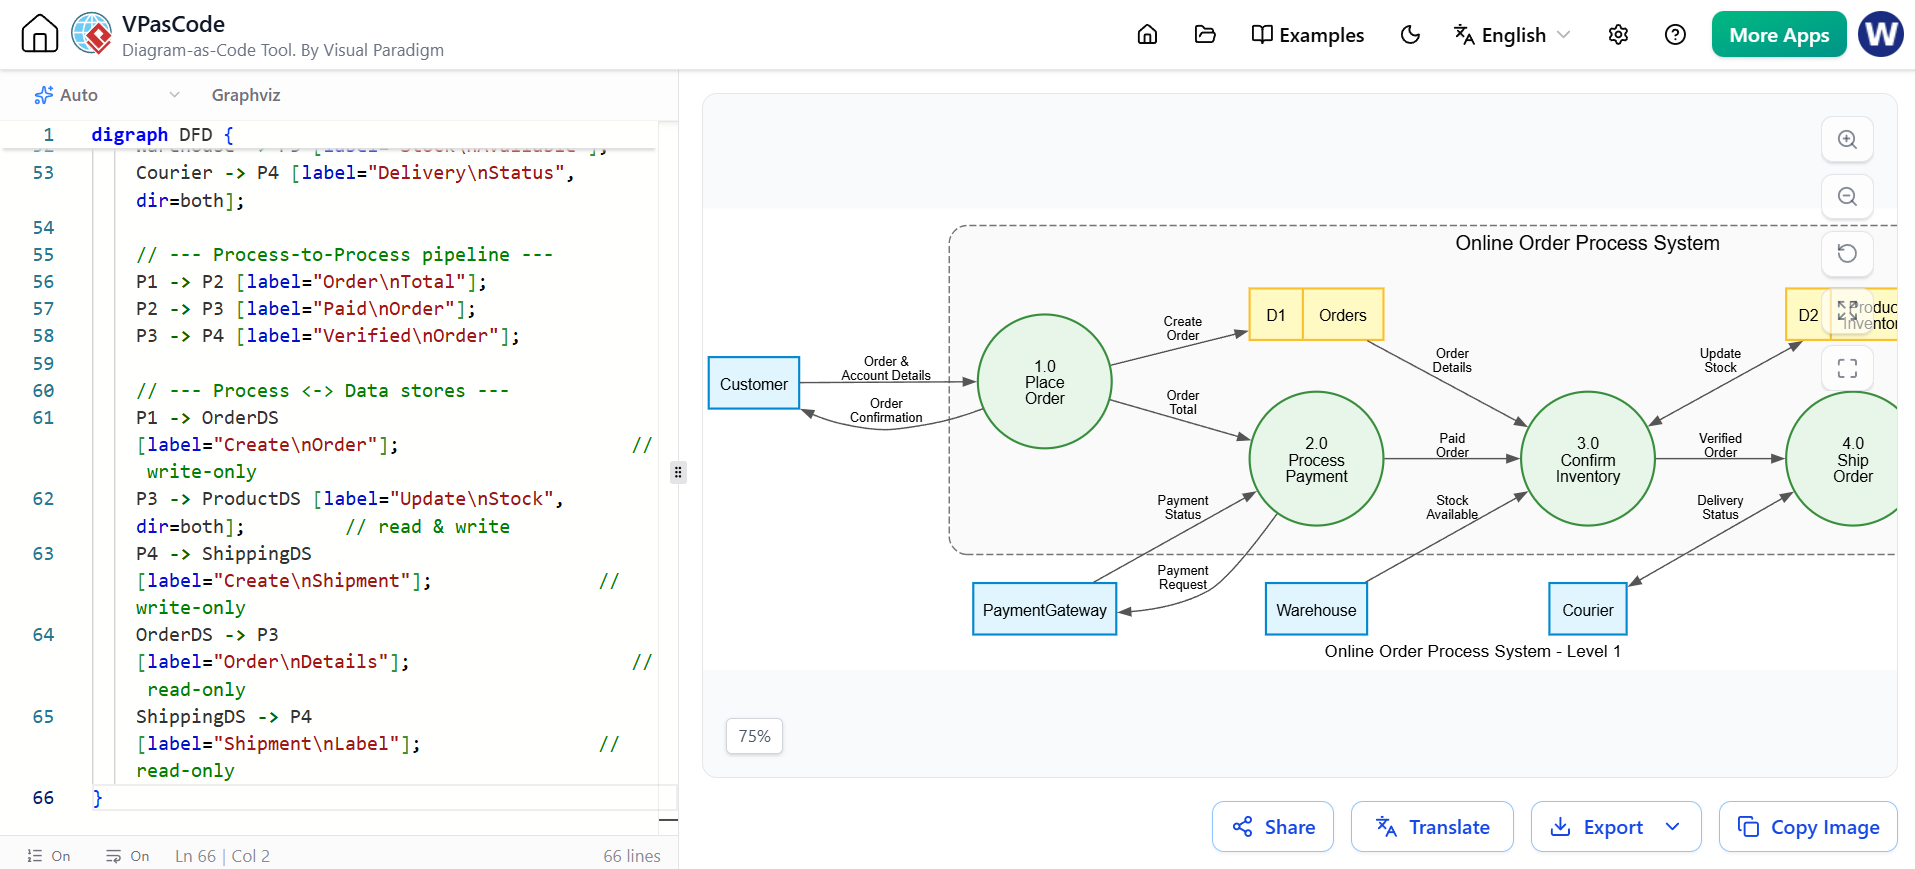
Break the single context process into the key functions and add shared data stores. Wrap processes + stores in a dashed rounded system boundary.
digraph DFD {
    // --- GRAPH STYLE & Diagram Title ---
    graph [
        rankdir = LR
        splines = true
        overlap = false
        nodesep = 0.5
        ranksep = 0.8
        fontname = "Helvetica,Arial,sans-serif"
        fontsize = 12
        label = "Online Order Process System - Level 1"
    ]
    node [ fontname = "Helvetica,Arial,sans-serif", fontsize = 11, penwidth = 1.5 ]
    edge [ fontname = "Helvetica,Arial,sans-serif", fontsize = 9,
           color = "#555555", arrowsize = 0.8 ]

    // External Entities
    node [shape = box, style = "filled", fillcolor = "#E1F5FE", color = "#0288D1"]
    Customer; PaymentGateway; Warehouse; Courier;

    // --- SYSTEM BOUNDARY CONTAINER ---
    subgraph cluster_SystemBoundary {
        label = "Online Order Process System";
        fontname = "Helvetica,Arial,sans-serif"
        fontsize = 14
        color = "#757575"
        style = "dashed,rounded"
        bgcolor = "#FAFAFA"
        margin = 20

        // Processes (green circles)
        node [shape = circle, style = "filled", fillcolor = "#E8F5E9",
              color = "#388E3C", fixedsize = true, width = 1.3]
        P1 [label="1.0\nPlace\nOrder"];
        P2 [label="2.0\nProcess\nPayment"];
        P3 [label="3.0\nConfirm\nInventory"];
        P4 [label="4.0\nShip\nOrder"];

        // Data Stores (yellow records)
        node [shape = record, style = "filled", fillcolor = "#FFF9C4",
              color = "#FBC02D", fixedsize = false]
        OrderDS    [label="{ D1 | Orders }"];
        ProductDS  [label="{ D2 | Product\nInventory }"];
        ShippingDS [label="{ D3 | Shipments }"];
    }

    // --- DATA FLOWS: External entities ---
    Customer -> P1 [label="Order &\nAccount Details"];
    P1 -> Customer [label="Order\nConfirmation"];
    P2 -> PaymentGateway [label="Payment\nRequest"];
    PaymentGateway -> P2 [label="Payment\nStatus"];
    Warehouse -> P3 [label="Stock\nAvailable"];
    Courier -> P4 [label="Delivery\nStatus", dir=both];

    // --- Process-to-Process pipeline ---
    P1 -> P2 [label="Order\nTotal"];
    P2 -> P3 [label="Paid\nOrder"];
    P3 -> P4 [label="Verified\nOrder"];

    // --- Process <-> Data stores ---
    P1 -> OrderDS [label="Create\nOrder"];                     // write-only
    P3 -> ProductDS [label="Update\nStock", dir=both];         // read & write
    P4 -> ShippingDS [label="Create\nShipment"];               // write-only
    OrderDS -> P3 [label="Order\nDetails"];                    // read-only
    ShippingDS -> P4 [label="Shipment\nLabel"];                // read-only
}
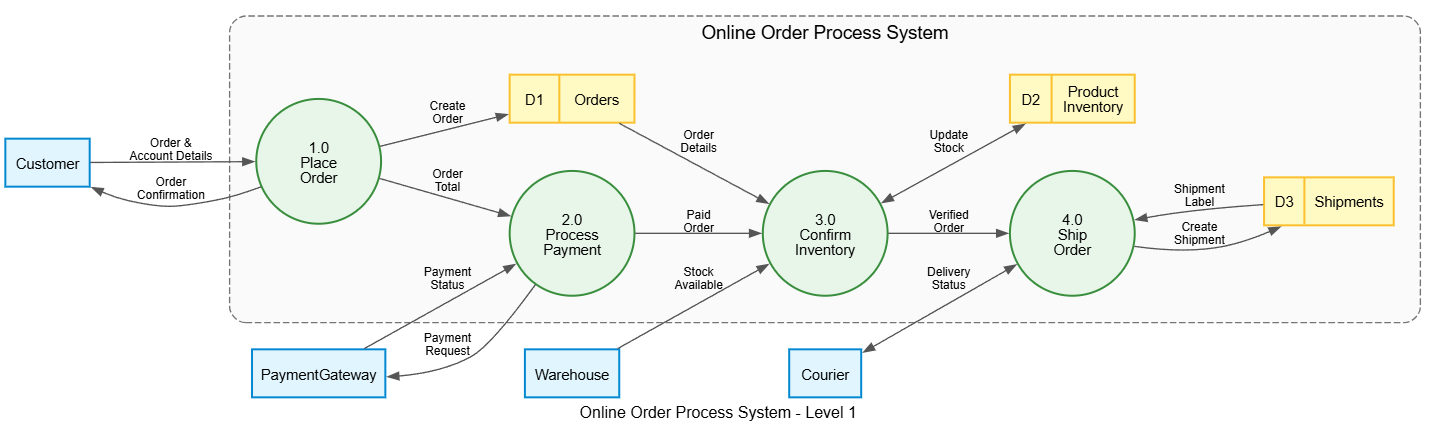 Interpretation:
- The linear chain
P1 → P2 → P3 → P4shows an ordered pipeline: an order is placed before payment, before inventory check, before shipping. - The Payment Gateway exchange uses two one-way arrows (
Payment Requestoutward,Payment Statusinward). - Data stores act as state:
P1writes Orders,P3reads & updates stock (dir=both),P4writes Shipments. P3 → ProductDSusesdir=both— one edge, not two — because the process both reads and updates inventory.
Step 3 — Drill Down: Level-2 (Focus on one process)
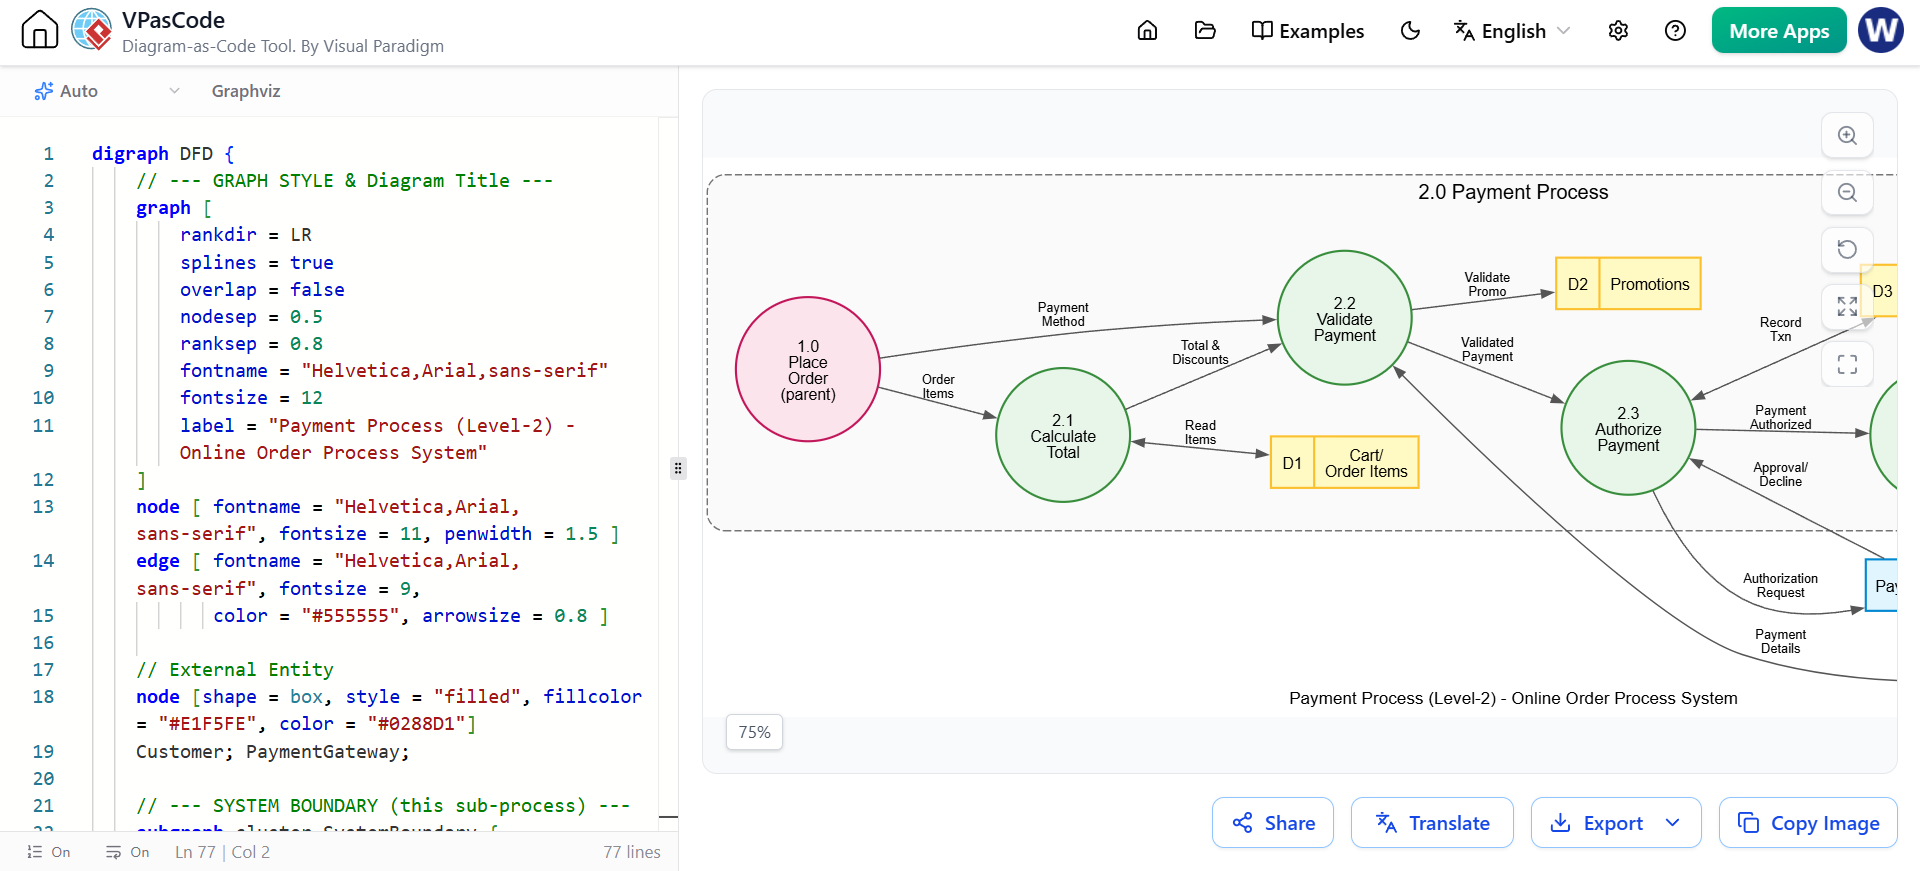
Pick a Level-1 process and decompose just that one. Show parent processes at the boundary (pink) so you retain context, plus sub-processes, sub-stores, and flows.
digraph DFD {
    // --- GRAPH STYLE & Diagram Title ---
    graph [
        rankdir = LR
        splines = true
        overlap = false
        nodesep = 0.5
        ranksep = 0.8
        fontname = "Helvetica,Arial,sans-serif"
        fontsize = 12
        label = "Payment Process (Level-2) - Online Order Process System"
    ]
    node [ fontname = "Helvetica,Arial,sans-serif", fontsize = 11, penwidth = 1.5 ]
    edge [ fontname = "Helvetica,Arial,sans-serif", fontsize = 9,
           color = "#555555", arrowsize = 0.8 ]

    // External Entity
    node [shape = box, style = "filled", fillcolor = "#E1F5FE", color = "#0288D1"]
    Customer; PaymentGateway;

    // --- SYSTEM BOUNDARY (this sub-process) ---
    subgraph cluster_SystemBoundary {
        label = "2.0 Payment Process";
        fontname = "Helvetica,Arial,sans-serif"
        fontsize = 14
        color = "#757575"
        style = "dashed,rounded"
        bgcolor = "#FAFAFA"
        margin = 20

        // Sub-processes (green circles)
        node [shape = circle, style = "filled", fillcolor = "#E8F5E9",
              color = "#388E3C", fixedsize = true, width = 1.3]
        P21 [label="2.1\nCalculate\nTotal"];
        P22 [label="2.2\nValidate\nPayment"];
        P23 [label="2.3\nAuthorize\nPayment"];
        P24 [label="2.4\nConfirm\nOrder"];

        // Sub-data-stores (yellow records)
        node [shape = record, style = "filled", fillcolor = "#FFF9C4",
              color = "#FBC02D", fixedsize = false]
        CartDS   [label="{ D1 | Cart/\nOrder Items }"];
        PromoDS  [label="{ D2 | Promotions }"];
        PaymentDS [label="{ D3 | Payment\nTransactions }"];
        OrderDS  [label="{ D4 | Orders }"];

        // Parent processes (pink) - context from higher level
        node [shape = circle, style = "filled", fillcolor = "#FCE4EC",
              color = "#C2185B", fixedsize = true, width = 1.4]
        P1 [label="1.0\nPlace\nOrder\n(parent)"];
        P3 [label="3.0\nConfirm\nInventory\n(parent)"];
    }

    // Flows from parents / customer into sub-processes
    P1 -> P21 [label="Order\nItems"];
    P1 -> P22 [label="Payment\nMethod"];
    Customer -> P22 [label="Payment\nDetails"];

    // Sub-process chain
    P21 -> P22 [label="Total &\nDiscounts"];
    P22 -> P23 [label="Validated\nPayment"];
    P23 -> P24 [label="Payment\nAuthorized"];

    // External gateway interaction
    P23 -> PaymentGateway [label="Authorization\nRequest"];
    PaymentGateway -> P23 [label="Approval/\nDecline"];

    // Output to parents / customer
    P24 -> P3 [label="Paid\nOrder"];
    P24 -> Customer [label="Payment\nReceipt"];

    // Data store accesses
    P21 -> CartDS [label="Read\nItems", dir=both];
    P22 -> PromoDS [label="Validate\nPromo"];
    P23 -> PaymentDS [label="Record\nTxn", dir=both];
    P24 -> OrderDS [label="Update\nStatus"];
}
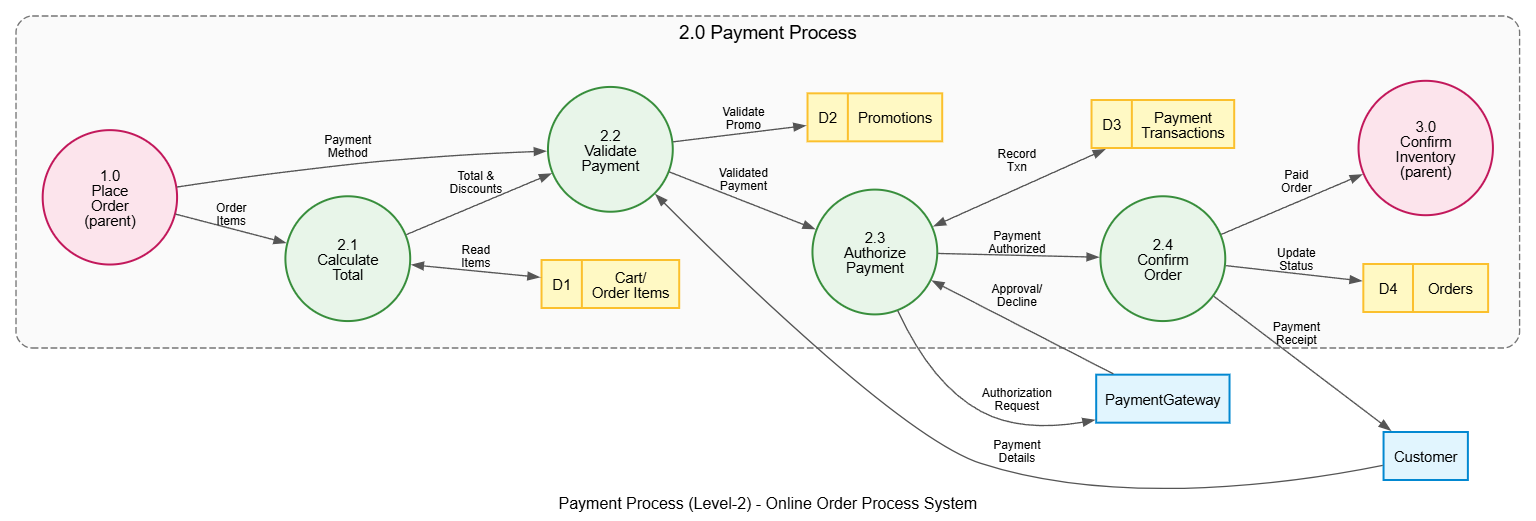 Interpretation (vs. Level-1):
- 2.1 Calculate Total is a pure computation — reads cart items, produces a figure, no external I/O beyond stores.
- 2.3 Authorize Payment is the only step talking to the external Payment Gateway — money movement is cleanly isolated.
- The
Ordersstore reappears because 2.4 updates order status (originally written by 1.0 at Level-1). - The chain
2.1 → 2.2 → 2.3 → 2.4is a sequential validation pipeline before handing off to 3.0 (pink parent). - Parent processes 1.0 & 3.0 are drawn pink outside the boundary to anchor where flows originate and end.
Step 4 — Drill Down Again: Level-3 (Repeat recursively)
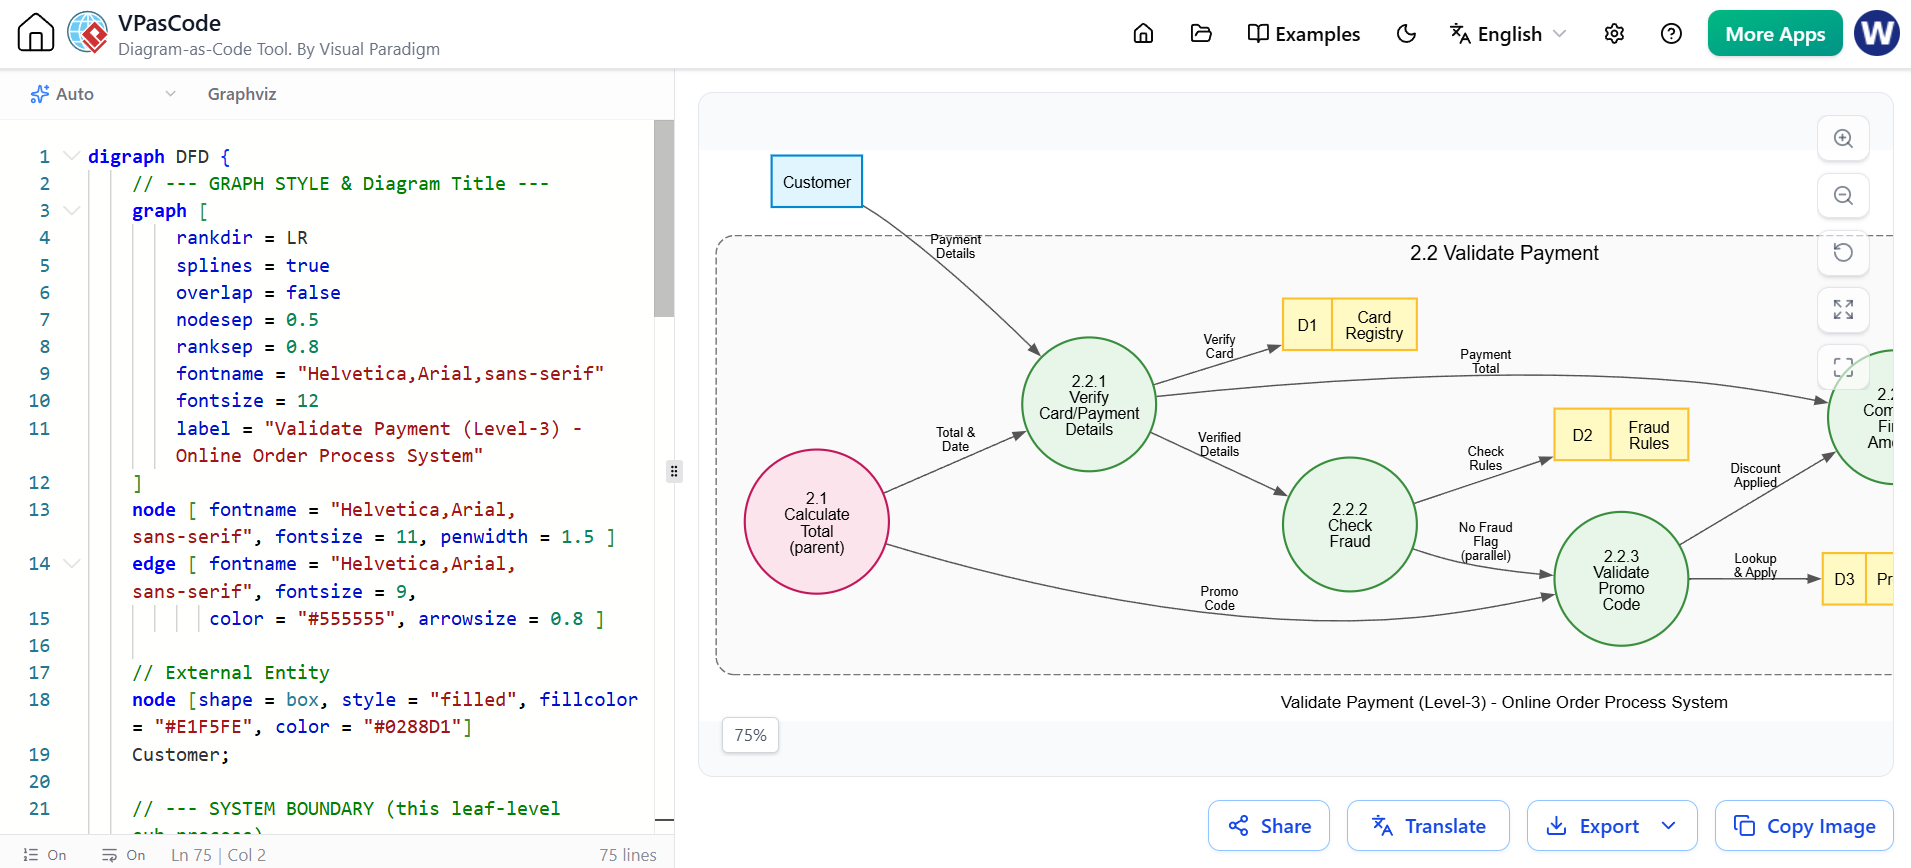
Repeat the exact same technique on any sub-process still too complex. We zoom into 2.2 Validate Payment.
digraph DFD {
    // --- GRAPH STYLE & Diagram Title ---
    graph [
        rankdir = LR
        splines = true
        overlap = false
        nodesep = 0.5
        ranksep = 0.8
        fontname = "Helvetica,Arial,sans-serif"
        fontsize = 12
        label = "Validate Payment (Level-3) - Online Order Process System"
    ]
    node [ fontname = "Helvetica,Arial,sans-serif", fontsize = 11, penwidth = 1.5 ]
    edge [ fontname = "Helvetica,Arial,sans-serif", fontsize = 9,
           color = "#555555", arrowsize = 0.8 ]

    // External Entity
    node [shape = box, style = "filled", fillcolor = "#E1F5FE", color = "#0288D1"]
    Customer;

    // --- SYSTEM BOUNDARY (this leaf-level sub-process) ---
    subgraph cluster_SystemBoundary {
        label = "2.2 Validate Payment";
        fontname = "Helvetica,Arial,sans-serif"
        fontsize = 14
        color = "#757575"
        style = "dashed,rounded"
        bgcolor = "#FAFAFA"
        margin = 20

        // Leaf processes (green circles)
        node [shape = circle, style = "filled", fillcolor = "#E8F5E9",
              color = "#388E3C", fixedsize = true, width = 1.3]
        P221 [label="2.2.1\nVerify\nCard/Payment\nDetails"];
        P222 [label="2.2.2\nCheck\nFraud"];
        P223 [label="2.2.3\nValidate\nPromo\nCode"];
        P224 [label="2.2.4\nCompute\nFinal\nAmount"];

        // Leaf data stores (yellow records)
        node [shape = record, style = "filled", fillcolor = "#FFF9C4",
              color = "#FBC02D", fixedsize = false]
        CardDS  [label="{ D1 | Card\nRegistry }"];
        FraudDS [label="{ D2 | Fraud\nRules }"];
        PromoDS [label="{ D3 | Promotions }"];
        CartDS  [label="{ D4 | Cart/\nOrder Items }"];

        // Parent processes (pink)
        node [shape = circle, style = "filled", fillcolor = "#FCE4EC",
              color = "#C2185B", fixedsize = true, width = 1.4]
        P21 [label="2.1\nCalculate\nTotal\n(parent)"];
        P23 [label="2.3\nAuthorize\nPayment\n(parent)"];
    }

    // Inputs
    P21 -> P221 [label="Total &\nDate"];
    Customer -> P221 [label="Payment\nDetails"];

    // Sequential validation, with parallel branch
    P221 -> P222 [label="Verified\nDetails"];
    P222 -> P223 [label="No Fraud\nFlag\n(parallel)"];

    // Feed the final computation
    P21 -> P223 [label="Promo\nCode"];
    P221 -> P224 [label="Payment\nTotal"];
    P223 -> P224 [label="Discount\nApplied"];

    // Output to parent
    P224 -> P23 [label="Validated &\nDiscounted\nTotal"];

    // Data store accesses
    P221 -> CardDS [label="Verify\nCard"];
    P222 -> FraudDS [label="Check\nRules"];
    P223 -> PromoDS [label="Lookup\n& Apply"];
    P224 -> CartDS [label="Read\nItems", dir=both];
}
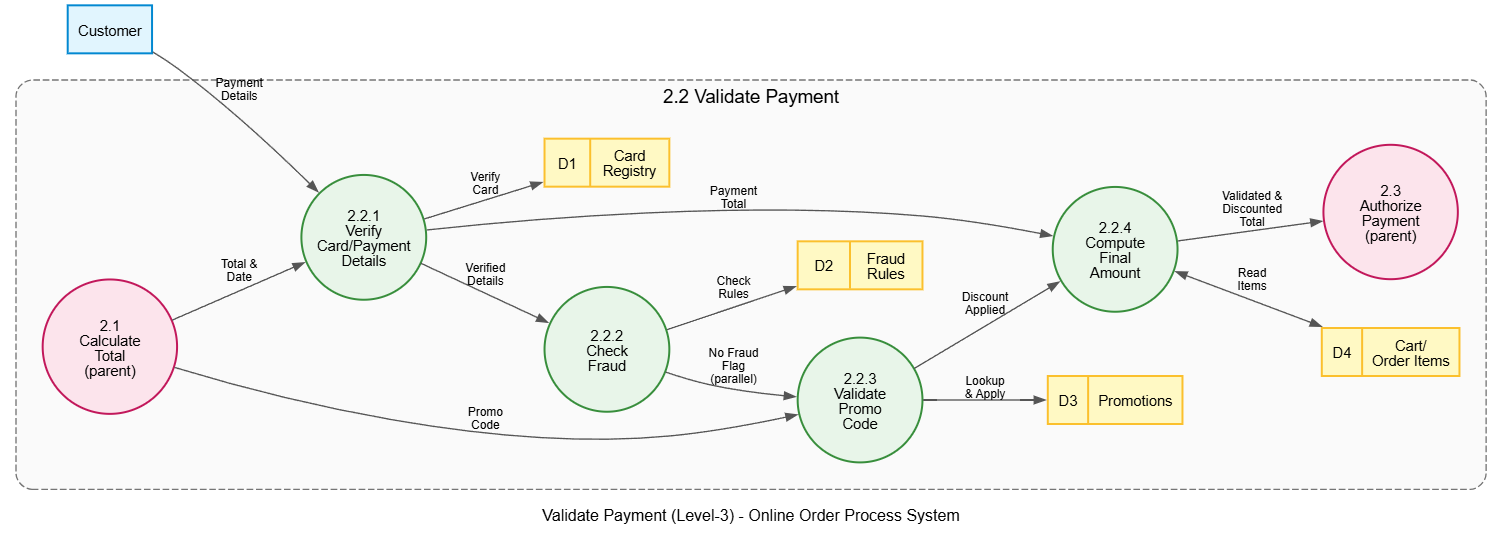 Interpretation:
- 2.2.1 Verify Card is a gate — it must succeed before fraud-checking starts.
- 2.2.2 (Fraud) and 2.2.3 (Promo) run in parallel: both read rules and both feed the final computation. The “(parallel)” label flags this.
- 2.2.4 Compute Final Amount is a fan-in point — it joins
Payment Total+Discountinto one validated output that exits to parent 2.3. - Card Registry and Fraud Rules are detail-level stores not visible at Level-2 — new stores emerge naturally as you decompose.
Step 5 — Stop When Processes Are “Primitive”
Continue decomposing until each process describes a single, unambiguous, implementable action. There’s no fixed depth; stop when a process maps cleanly to one function or one decision. Levels 2.2.1–2.2.4 above are already primitive.
6. Best Practices & Common Pitfalls
✅ Best practices
- Number processes hierarchically (
2.2.4) so any diagram is self-locating in the tree. - Draw parent processes at the boundary (pink) so flows retain context — never orphan an input/output.
- Use one bidirectional edge (
dir=both) for two-way exchanges instead of two separate arrows. Reduces clutter. - Keep labels descriptive but short (“Authorize Payment”, not “AP”).
- Decompose one process at a time — each level is its own diagram; don’t cram multiple levels into one.
- Balance the diagrams — inputs/outputs at a parent level must equal the combined inputs/outputs of its children (balancing rule).
- Always declare elements — a style-only template that declares no nodes or edges renders an empty canvas. Every DFD must style, then declare, then connect.
- Name data stores uniquely within child diagrams, but re-renumber locally (D1, D2…) for self-containment.
❌ Common pitfalls
- Orphan processes — a process with no input or output. Every process transforms something.
- Missing balancing — a flow appears at Level-1 but none of its Level-2 children produce/consume it.
- Premature detail — exposing data stores at Level-0 context diagram (they belong only at lower levels).
- Control-flow thinking — putting loops or decision symbols into a DFD; save that for flowcharts. DFDs show data, not order.
- Two parallel arrows for what should be one
dir=bothedge — creates duplicate-line clutter. - Wrong store access direction — labeling a store as read-only when it’s actually written (or vice versa).
- Style template mistaken for a diagram — forgetting to declare nodes and edges produces a blank graph.
7. Top-Down Verification Checklist
Before presenting a diagram, check:
- ✅ Every process has ≥1 input and ≥1 output.
- ✅ Every flow label is a noun (“Order Details”), not a verb.
- ✅ Every data store is read and written at some point (unless clearly external reference data).
- ✅ Level boundaries balance: children consume & produce exactly what their parent exchanged.
- ✅ External entities appear only at the edges, never inside a boundary.
- ✅
dir=bothis used for two-way exchanges; one-way arrows otherwise. - ✅ Pink parent-process references correctly show the level being decomposed.
- ✅ The code declares real nodes, edges, and a boundary — it’s not just a style rule.
8. TOP-Down Decompostion Process Summary
Top-down DFD decomposition is a journey from abstraction to detail:
- Context (L0) — one box, all boundaries & external entities.
- System (L1) — major processes, stores, and the data pipeline.
- Sub-diagrams (L2, L3…) — recursively zoom into one process at a time, keeping parent context visible and local stores numbered.
Each level answers a different question: L0 asks “what’s the system’s footprint?”, L1 asks “what are the major data flows?”, L2+ asks “how exactly is this data transformed?”
The Online Order Process example demonstrates the full chain in complete, runnable Graphviz code — from a 4-entity context diagram, down to a 4-step validation routine (2.2.1 → 2.2.4). By stemming numbers, balancing flows, respecting a consistent color legend (blue boxes, green circles, yellow records, pink parent references, dashed grey boundary), and always declaring every node/edge explicitly, any large system stays navigable and unambiguous — and every diagram actually renders.
9. Tooling: Building DFD Top-Down Decomposition with Visual Paradigm AI
Visual Paradigm AI puts an AI chatbot directly inside the modeling tool. Instead of hand-drawing every level, you can drive the whole decomposition conversationally, then fine-tune the result. Here’s how to use it for exactly the approach in this guide.
9.1 Core Capabilities for DFD Work
The VP AI Chatbot is a text-and-code assistant that works with you through dialogue. For DFD top-down decomposition, it can:
| Capability | What it does for you |
|---|---|
| Generate diagram code | Produce Graphviz (DOT) for a given process description — one level at a time |
| Analyze attached images | Read a hand-drawn or existing DFD image you upload and turn it into structured models |
| Refine iteratively | Take your feedback (“zoom into 2.2”, “add the decline branch”) and regenerate the diagram |
| Explain interpretations | Walk through what each entity, process, store, and flow means |
| Validate syntax | Check that the DOT is structurally sound before you render it |
| Produce strategy/chart output | Generate supporting charts or frameworks that accompany the DFD (e.g., a swimlane or org context) |
📌 Note: Visual Paradigm supports a range of diagramming notations. Prefer BPMN for business-process modeling that needs start/end events, gateways, and swimlanes; use Graphviz-based DFDs for strict data-flow modeling as shown throughout this guide.
9.2 Worked Dialogue — Decomposing the Online Order Process
Here is a realistic chat session that mirrors the steps we walked through. Notice how each prompt zooms one level deeper — exactly the top-down methodology.
Prompt 1 — Start the context diagram:
“Create a Context Diagram (Level 0) for an Online Order Process system. External entities: Customer, Payment Gateway, Warehouse, Courier.”
VP AI responds with a Level-0 DFD — one central process, four external entities, and their flows — which you place in a diagram.
Prompt 2 — Add the level of detail:
“Now decompose it into a Level-1 DFD with processes: 1.0 Place Order, 2.0 Process Payment, 3.0 Confirm Inventory, 4.0 Ship Order. Add data stores for Orders, Product Inventory, and Shipments.”
VP AI returns the Level-1 diagram with processes chained in sequence, stores attached, and external-entity flows preserved — the pipeline you saw in Step 2 of the guide.
Prompt 3 — Zoom into one process:
“Zoom into 2.0 Process Payment. Make a Level-2 sub-diagram with 2.1 Calculate Total, 2.2 Validate Payment, 2.3 Authorize Payment, 2.4 Confirm Order. Keep 1.0 and 3.0 as parent references.”
VP AI produces the Level-2 sub-diagram: sub-processes, local stores (D1–D4), the payment-gateway interaction, and pink parent references for 1.0 and 3.0 — matching Step 3.
Prompt 4 — Drill down again:
“Drill into 2.2 Validate Payment as a Level-3 diagram: 2.2.1 Verify Card, 2.2.2 Check Fraud, 2.2.3 Validate Promo, 2.2.4 Compute Final Amount. Add stores for Card Registry, Fraud Rules, Promotions, and Cart Items.”
VP AI generates the Level-3 leaf diagram with the fan-in computation (2.2.4) and the parallel fraud/promo branches — exactly Step 4.
Prompt 5 — Add exception handling:
“Add the failure path: if 2.2.2 Check Fraud flags the transaction, route to a Cancellation Notice process back to the Customer.”
VP AI refines the diagram with a decline branch and re-balances the flows automatically.
9.3 Prompting Patterns That Work
Use these patterns to get reliable, on-methodology results:
| Goal | Example prompt |
|---|---|
| Decompose one level deeper | “Zoom into 3.0 Confirm Inventory as a Level-2 sub-diagram.” |
| Specify numbering | “Use numbered processes 2.1, 2.2, 2.3.” |
| Preserve parent context | “Keep 1.0 and 3.0 as parent references at the boundary.” |
| Add data stores | “Include stores: D1 Cart Items, D2 Promotions.” |
| Show bidirectional flow | “Use dir=both for the process↔store reads and writes.” |
| Balance the level | “Make sure the inputs and outputs match the parent level.” |
| Add a failure path | “Add an exception branch when payment is declined.” |
| Clamp the depth | “Stop at primitive processes — single, implementable actions.” |
9.4 Uploading an Image for Analysis
If you already have a hand-drawn or legacy DFD and want it digitized:
- Attach the image to the chat (a screenshot, photo, or export of an existing DFD).
- Ask: “Analyze this DFD image and turn it into a structured model I can edit.”
- VP AI examines the image (reading shapes, labels, and arrows) and reconstructs the entities, processes, stores, and flows as an editable diagram.
📌 The AI reads the image’s content — rectangles, circles, records, and their labels — and reproduces them in the proper notation. This is a fast path from a rough sketch to a clean, layered model that you can then decompose further.
9.5 Iterating with the Artifact Workflow
VP AI stores each generated diagram as an artifact you can reference during refinement:
- “Refine the Level-2 artifact to add a fraud-decline branch.” — targets a specific already-generated diagram rather than regenerating from scratch.
- “Regenerate the Context Diagram but drop the Warehouse entity.” — replaces an artifact when scope changes.
- “Compare the Level-2 and Level-3 artifacts for balancing.” — cross-checks parent/child flow parity.
Because artifacts keep the conversation’s state, you can layer refinement after refinement without losing earlier decisions — the essence of top-down decomposition.
9.6 Recommended Workflow Checklist
| Stage | Action |
|---|---|
| 1. Scaffold | Prompt for the Context Diagram (Level 0) first. |
| 2. Lay down Level 1 | Ask for the major-process decomposition with stores and a boundary. |
| 3. Drill down | Zoom one process at a time; keep parent references. |
| 4. Refine | Request exception paths, balancing fixes, and store corrections. |
| 5. Validate | Have the AI check the DOT syntax; review the checklist in Section 7. |
| 6. Document | Ask for the interpretation narrative to attach alongside each level. |
9.7 Example Output — Ask VP AI to Generate the Level-1 Code
A typical response from the chatbot for the Step-2 decomposition would be the complete, runnable DOT you saw earlier:
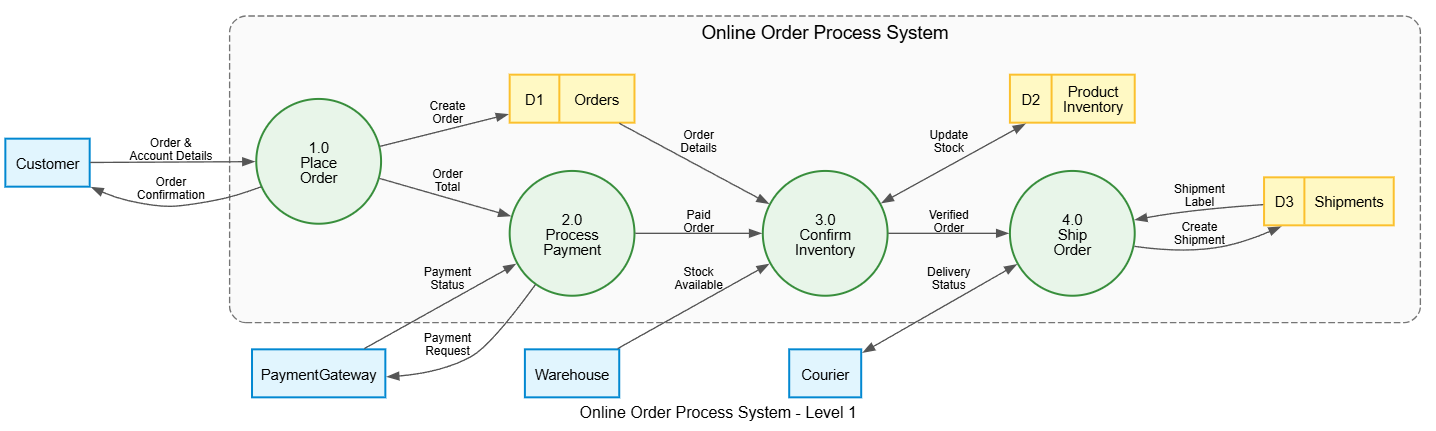
digraph DFD {
    graph [
        rankdir = LR, splines = true, overlap = false,
        nodesep = 0.5, ranksep = 0.8,
        fontname = "Helvetica,Arial,sans-serif", fontsize = 12,
        label = "Online Order Process System - Level 1"
    ]
    node [ fontname = "Helvetica,Arial,sans-serif", fontsize = 11, penwidth = 1.5 ]
    edge [ fontname = "Helvetica,Arial,sans-serif", fontsize = 9,
           color = "#555555", arrowsize = 0.8 ]

    // External Entities
    node [shape = box, style = "filled", fillcolor = "#E1F5FE", color = "#0288D1"]
    Customer; PaymentGateway; Warehouse; Courier;

    subgraph cluster_SystemBoundary {
        label = "Online Order Process System";
        fontname = "Helvetica,Arial,sans-serif"
        fontsize = 14
        color = "#757575"
        style = "dashed,rounded"
        bgcolor = "#FAFAFA"
        margin = 20

        node [shape = circle, style = "filled", fillcolor = "#E8F5E9",
              color = "#388E3C", fixedsize = true, width = 1.3]
        P1 [label="1.0\nPlace\nOrder"];
        P2 [label="2.0\nProcess\nPayment"];
        P3 [label="3.0\nConfirm\nInventory"];
        P4 [label="4.0\nShip\nOrder"];

        node [shape = record, style = "filled", fillcolor = "#FFF9C4",
              color = "#FBC02D", fixedsize = false]
        OrderDS    [label="{ D1 | Orders }"];
        ProductDS  [label="{ D2 | Product\nInventory }"];
        ShippingDS [label="{ D3 | Shipments }"];
    }

    // Flows
    Customer -> P1 [label="Order &\nAccount Details"];
    P1 -> Customer [label="Order\nConfirmation"];
    P2 -> PaymentGateway [label="Payment\nRequest"];
    PaymentGateway -> P2 [label="Payment\nStatus"];
    Warehouse -> P3 [label="Stock\nAvailable"];
    Courier -> P4 [label="Delivery\nStatus", dir=both];

    P1 -> P2 [label="Order\nTotal"];
    P2 -> P3 [label="Paid\nOrder"];
    P3 -> P4 [label="Verified\nOrder"];

    P1 -> OrderDS [label="Create\nOrder"];
    P3 -> ProductDS [label="Update\nStock", dir=both];
    P4 -> ShippingDS [label="Create\nShipment"];
    OrderDS -> P3 [label="Order\nDetails"];
    ShippingDS -> P4 [label="Shipment\nLabel"];
}
Paste that into a VP diagram, and you have the fully structured Level-1 model — ready to be decomposed again with the next prompt.
10. Summary
Top-down DFD decomposition is a journey from abstraction to detail:
- Context (L0) — one box, all boundaries & external entities.
- System (L1) — major processes, stores, and the data pipeline.
- Sub-diagrams (L2, L3…) — recursively zoom into one process at a time, keeping parent context visible and local stores numbered.
Each level answers a different question: L0 asks “what’s the system’s footprint?”, L1 asks “what are the major data flows?”, L2+ asks “how exactly is this data transformed?”
With Visual Paradigm AI, the whole ladder is conversational: prompt for Level 0, ask it to decompose, zoom one process at a time, request exception branches, and upload images to digitize existing diagrams. Combined with strict numbering, flow balancing, a consistent color legend, and complete declare-then-connect code, any large system stays navigable, unambiguous — and every diagram actually renders. 🚀
Related posts:
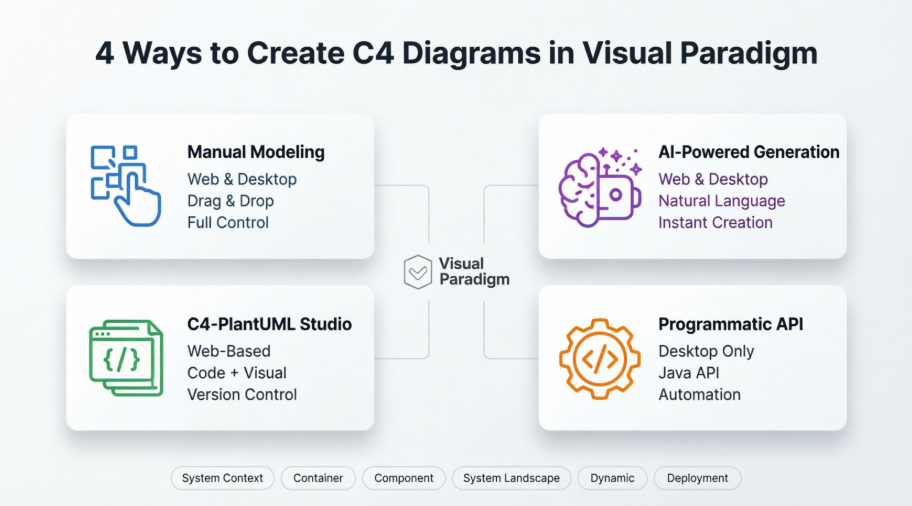 Mastering C4 Diagrams in Visual Paradigm: A Hands-On Review of All Four Creation Methods
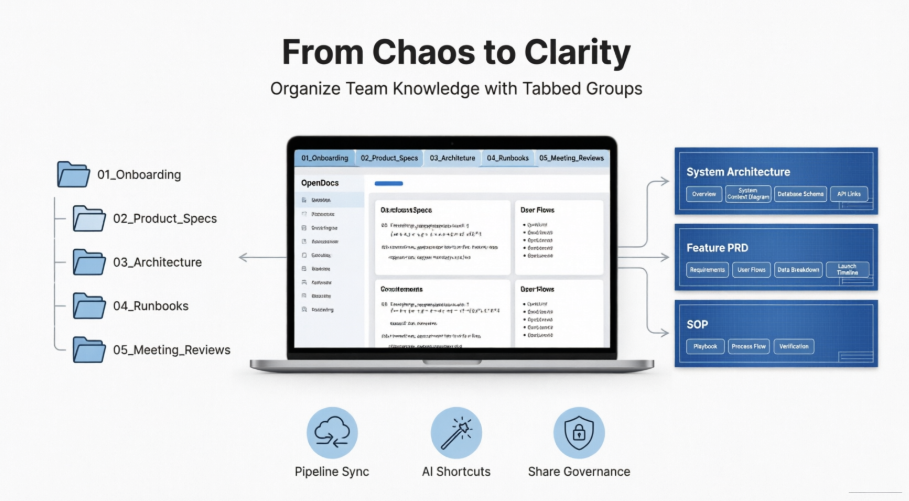 Smarter Documentation with OpenDocs’ Tabbed Groups
 From Idea to Diagram in Seconds: My Hands-On Review of Visual Paradigm’s AI Chatbot for Visual Modeling
Comprehensive Guide: Diagram Generation Methods in Visual Paradigm
From Idea to Diagram in Seconds: My Hands-On Review of Visual Paradigm’s AI Chatbot for Visual Modeling
Comprehensive Guide: Diagram Generation Methods in Visual Paradigm