


Introduction
As a business analyst who has spent countless hours wrestling with complex system documentation, I remember the frustration of manually drawing data flow diagrams late into the night. If you’re like me—someone who needs to visualize how data moves through systems but doesn’t always have the time or design skills to create polished diagrams—this guide is for you. Over the past few months, I’ve explored various DFD tools and techniques, and I’m excited to share what I’ve learned about creating professional data flow diagrams, especially with the game-changing AI tools that have recently become available. Whether you’re a seasoned systems analyst or just starting your journey into process modeling, this comprehensive review will walk you through everything I discovered about DFDs and how modern AI technology is transforming the way we work.
Understanding Data Flow Diagrams: What I Learned
When I first started working with Data Flow Diagrams (DFDs), I was overwhelmed by the technical jargon. But as I dove deeper, I realized that DFDs are simply visual representations showing how data travels through a business information system. From my experience, they’re invaluable for understanding how data moves from input through various processes to storage and finally to report generation.

Through my projects, I discovered that DFDs come in two main flavors:
Logical DFDs became my go-to when I needed to understand business functionality without getting bogged down in technical details. These helped me focus on what the business actually does—how data flows to support business operations.
Physical DFDs, on the other hand, proved essential when I needed to show stakeholders exactly how the system would be implemented, including hardware, software, and human processes.
My Hands-On Experience with DFD Symbols
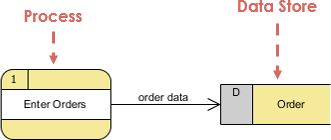
Process Symbols: The Heart of My Diagrams
In my work, I’ve found that processes are where the magic happens. Every time I create a DFD, I represent processes as rounded rectangles. Through trial and error, I learned that every process needs:
-
A clear name (verb + noun format like “Calculate Commission” or “Verify Order”)
-
A unique ID for easy reference
-
At least one input and one output data flow

What worked for me: I always name my processes with action words. Instead of “Payment,” I use “Apply Payment.” This simple change made my diagrams much clearer to non-technical stakeholders.
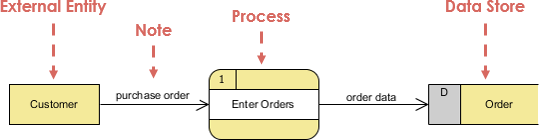
Data Flow: Tracking Information Movement
Data flows have been crucial in my diagrams for showing how information travels. I use straight lines with arrows to represent:
-
Input flows (arrows pointing into processes)
-
Output flows (arrows pointing out of processes)
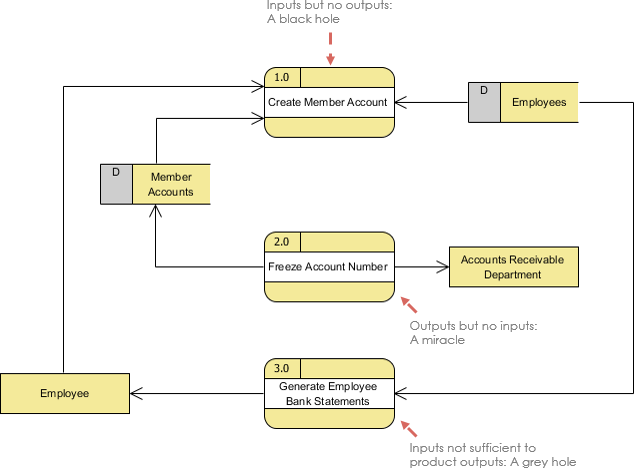
My biggest lesson: I learned the hard way that data can’t just appear or disappear. Every process must transform data from one form to another. Early in my career, I made these common mistakes:
-
Black holes – processes with inputs but no outputs (data disappears!)
-
Miracles – processes with outputs but no inputs (data appears from nowhere!)
-
Grey holes – processes where outputs don’t match inputs
The rule I now follow religiously: All data flows must begin and end at a processing step. Data can’t transform itself!
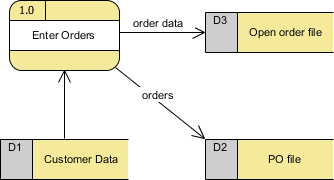
Data Store: Where Information Lives
When I need to show where data is saved for later use, I use data stores. In my projects, these represent databases, files, or any persistent storage.
My approach:
-
Data stores must connect to processes (never directly to external entities)
-
Each store needs at least one input flow (to write data) and one output flow (to read data)
-
I label them with plural nouns like “Orders,” “Customers,” or “Inventory”

External Entities: The System’s Boundaries
External entities helped me define where my system begins and ends. I represent people, organizations, or other systems that interact with my system as rectangles.
What I’ve learned:
-
External entities are also called “terminators” (they’re where data originates or ends)
-
They never process data—only provide or receive it
-
Every entity must connect to a process through a data flow

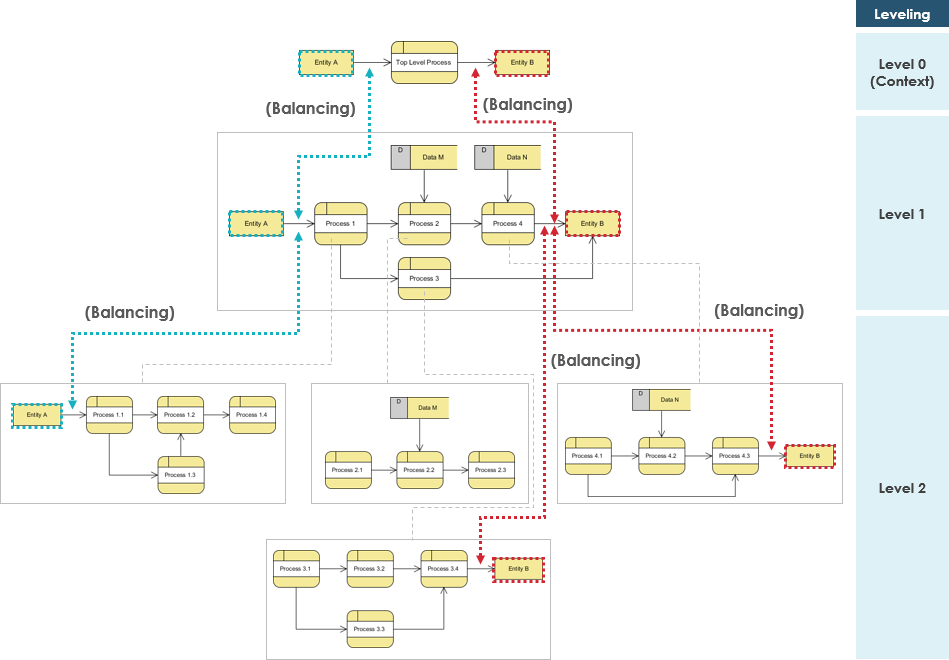
My Strategy for Top-Down Decomposition
One technique that transformed my DFD work is top-down decomposition (also called leveling). Here’s how I approach it:
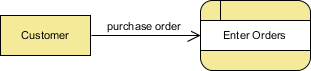
Starting with Context Diagrams (Level 0)
I always begin with a single process representing the entire system. My context diagram rules:
-
Keep it to one page
-
Name the process after the system (e.g., “Order Processing System”)
-
Show all external entities and major data flows
-
No data stores at this level
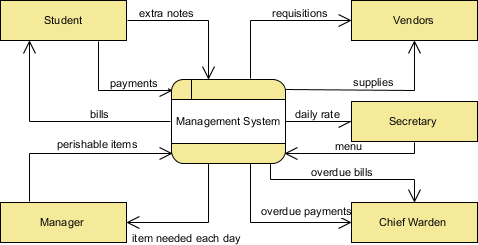
Moving to Level 1 DFDs
Next, I explode that single process into major subprocesses. My experience taught me:
-
Use decimal numbering (1.0, 2.0, 3.0)
-
Maintain the same inputs and outputs as the context diagram (balancing!)
-
Limit processes to 7±2 for readability
-
Duplicate external entities if needed to avoid crossing lines (I mark duplicates with an asterisk)
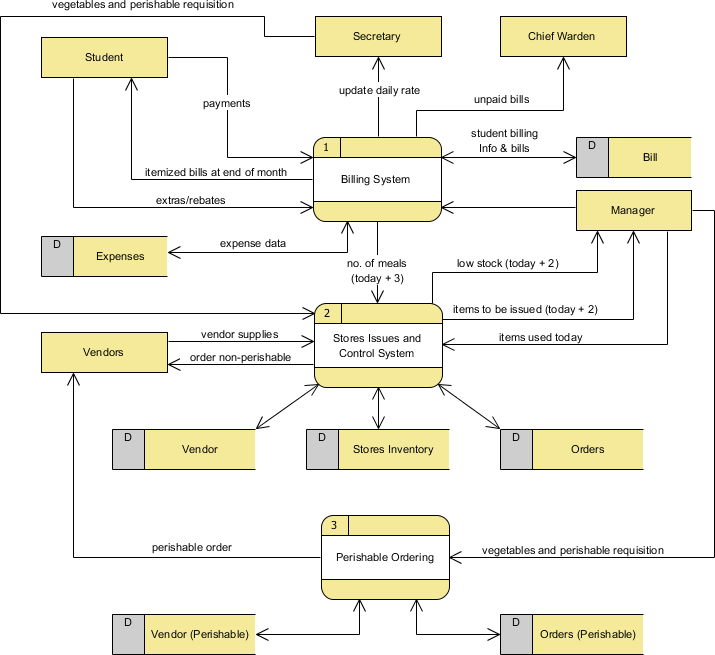
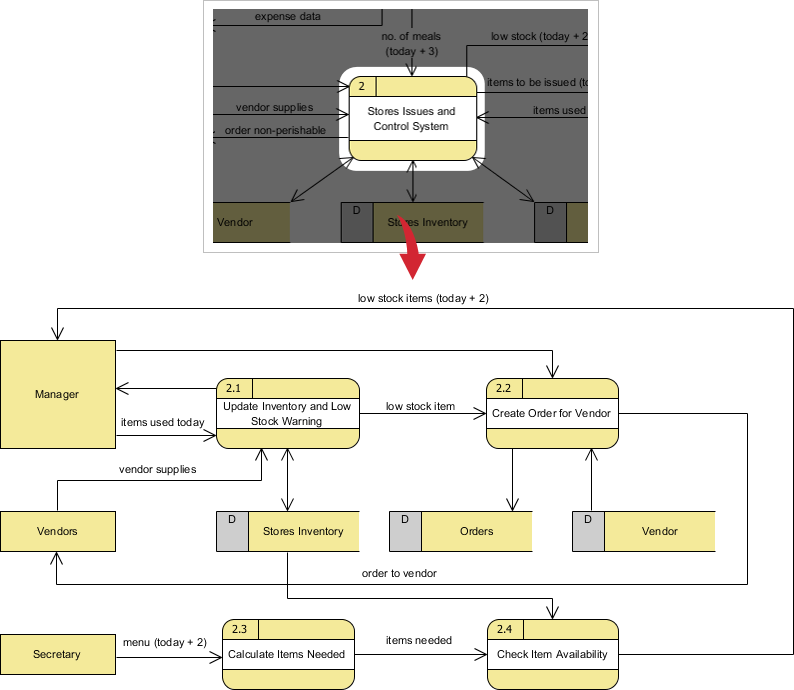
Drilling Down to Level 2
For complex processes, I create Level 2 diagrams. My tip: When a process has many external entity connections, I first create a mini context diagram for just that process before decomposing it further.
Balancing rule I follow: The inputs and outputs must be conserved between levels. If Level 0 has three inputs, Level 1 must have the same three inputs (though they may feed different subprocesses).
Guidelines I Developed for Creating Effective DFDs
After creating dozens of diagrams, here are my personal guidelines:
Naming Conventions That Worked for Me
-
Unique names only: I never reuse names within the same diagram level
-
Process numbering: I use hierarchical numbering (1, 1.1, 1.1.1) to show relationships
-
Descriptive labels: I avoid vague terms like “Process Data” and use specific names like “Validate Customer Information”
Complexity Management
-
The 7±2 rule: I keep processes per diagram between 5-9 maximum
-
No crossing lines: I duplicate entities or use multiple views when diagrams get cluttered
-
One page for context: My Level 0 always fits on a single page
Common Mistakes I Avoid
-
Entity-to-entity flows without processing
-
Entity-to-data-store direct connections
-
Data-store-to-data-store transfers
-
Unconnected elements floating in the diagram
My Experience: Logical vs Physical DFDs
Understanding when to use logical versus physical DFDs was a turning point in my work.
When I Use Logical DFDs
I create logical DFDs when I need to:
-
Communicate with business users who don’t care about technology
-
Understand business processes independent of implementation
-
Create stable documentation that won’t change with technology upgrades
-
Identify business requirements before technical decisions
Benefits I’ve experienced:
-
Better communication with non-technical stakeholders
-
More stable systems (business functions change less often than technology)
-
Easier maintenance since business logic is clearly separated from implementation
-
Simpler diagrams without technical details
When I Use Physical DFDs
Physical DFDs became essential when I needed to:
-
Show developers exactly what to build
-
Distinguish between manual and automated processes
-
Specify actual file names and database tables
-
Document the sequence of operations
-
Identify temporary data stores (like work files)
-
Add validation controls and error handling
Example from my work: When I documented a grocery store checkout system:
Logical DFD approach:
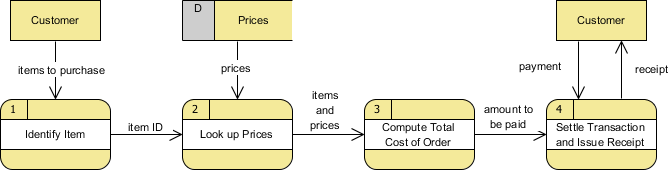
I focused on: Customer brings items → Prices looked up → Total calculated → Payment received → Receipt given
Physical DFD approach:
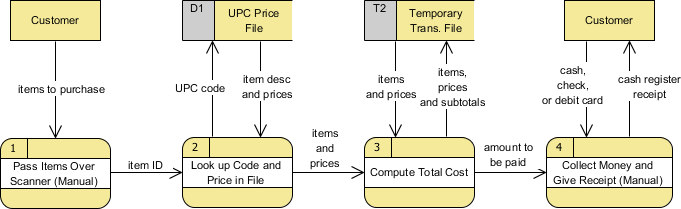
I detailed: Customer brings items with UPC codes → Barcode scanner reads prices → Subtotal stored in temporary file → Payment by cash/check/debit card → Cash register receipt printed
Discovering Visual Paradigm’s AI DFD Generator: My Review
The Game-Changer
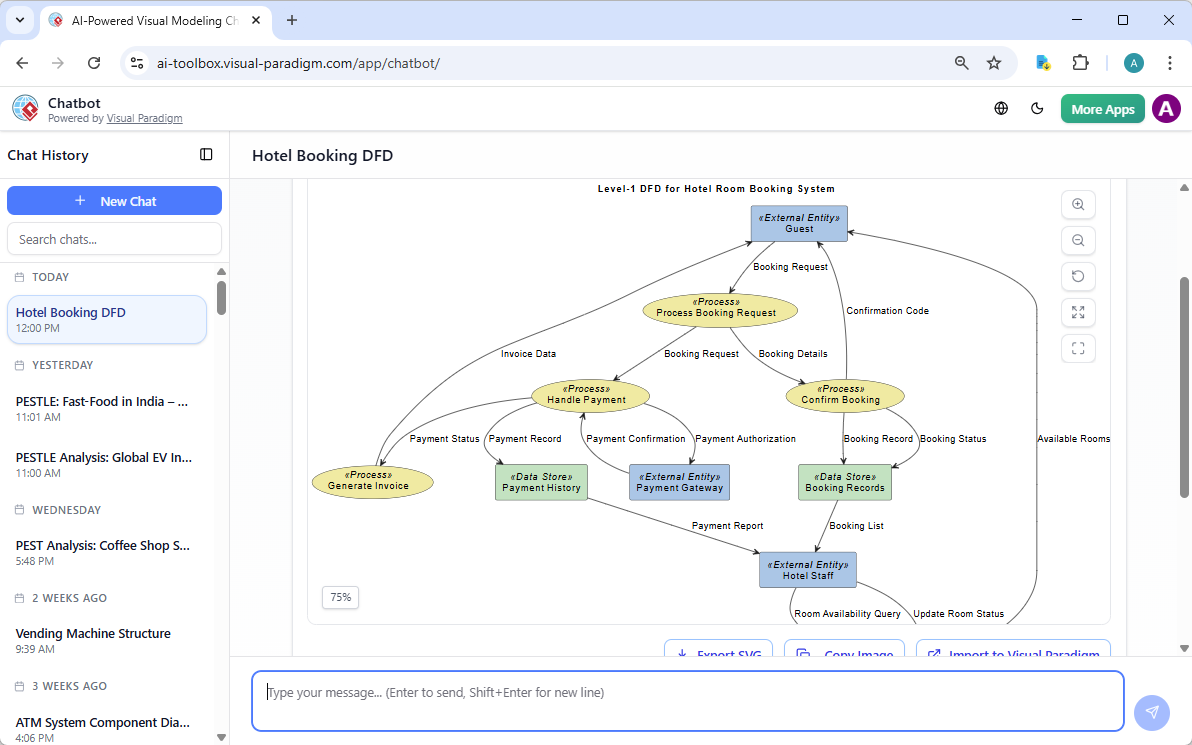
In March 2026, I discovered something that completely transformed my workflow: Visual Paradigm’s AI-powered DFD generator built into their AI Chatbot. As someone who has tried numerous diagramming tools, I was skeptical at first. Could AI really understand my system requirements and generate accurate DFDs?
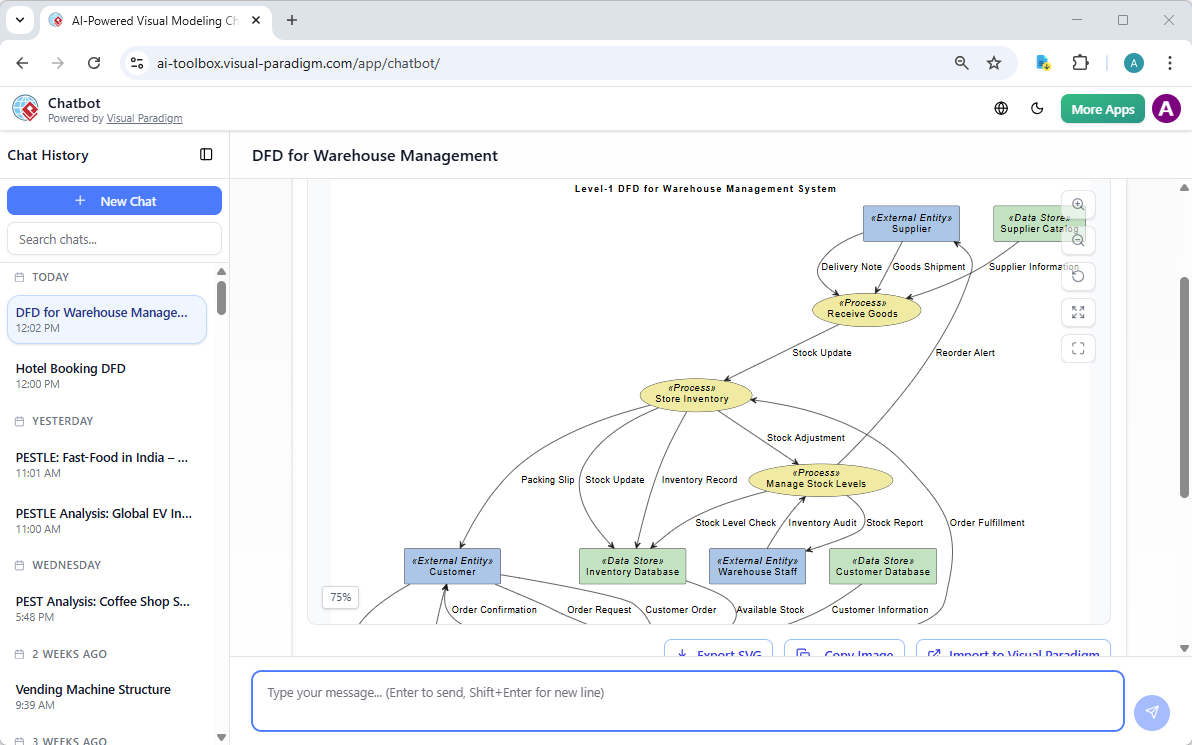
My first impression: I was blown away. I simply typed “Generate a DFD for a warehouse management system,” and within seconds, I had a professional, presentation-ready diagram. No dragging shapes, no manual alignment, no formatting headaches.
How I Use the AI DFD Generator
My workflow:
-
Access the tool: I head to the Visual Paradigm AI Chatbot (it’s free to start!)
-
Describe my system in plain English: Instead of wrestling with diagram notation, I just describe what I need:
-
“Generate a Level-1 DFD for an online banking system”
-
“Create a DFD for hospital patient management”
-
“Diagram an airline reservation system”
-
-
Watch the magic happen: The AI instantly identifies:
-
External entities (customers, vendors, systems)
-
Processes (what transformations occur)
-
Data stores (databases, files)
-
Data flows (how information moves)
-
-
Refine conversationally: This is where it gets really powerful. I can say:
-
“Add a payment verification process”
-
“Connect the customer entity to the order database”
-
“What data enters the inventory process?”
-
The AI understands and updates the diagram accordingly. It’s like having a modeling expert looking over my shoulder.
Real Projects I’ve Completed with the AI Tool
Project 1: Hospital Management System
When I needed to document a hospital’s patient flow, I prompted: “Generate a Data Flow Diagram for Hospital Management System”
What impressed me: The AI created a comprehensive Level-1 DFD showing:
-
External entities: Patients, Doctors, Pharmacists, Billing Department, Insurance Providers
-
Processes: Managing patient records, scheduling appointments, prescribing medications, processing billing, verifying insurance
-
Data stores: Patient Database, Appointment Schedule, Medication Inventory, Billing Records, Insurance Database
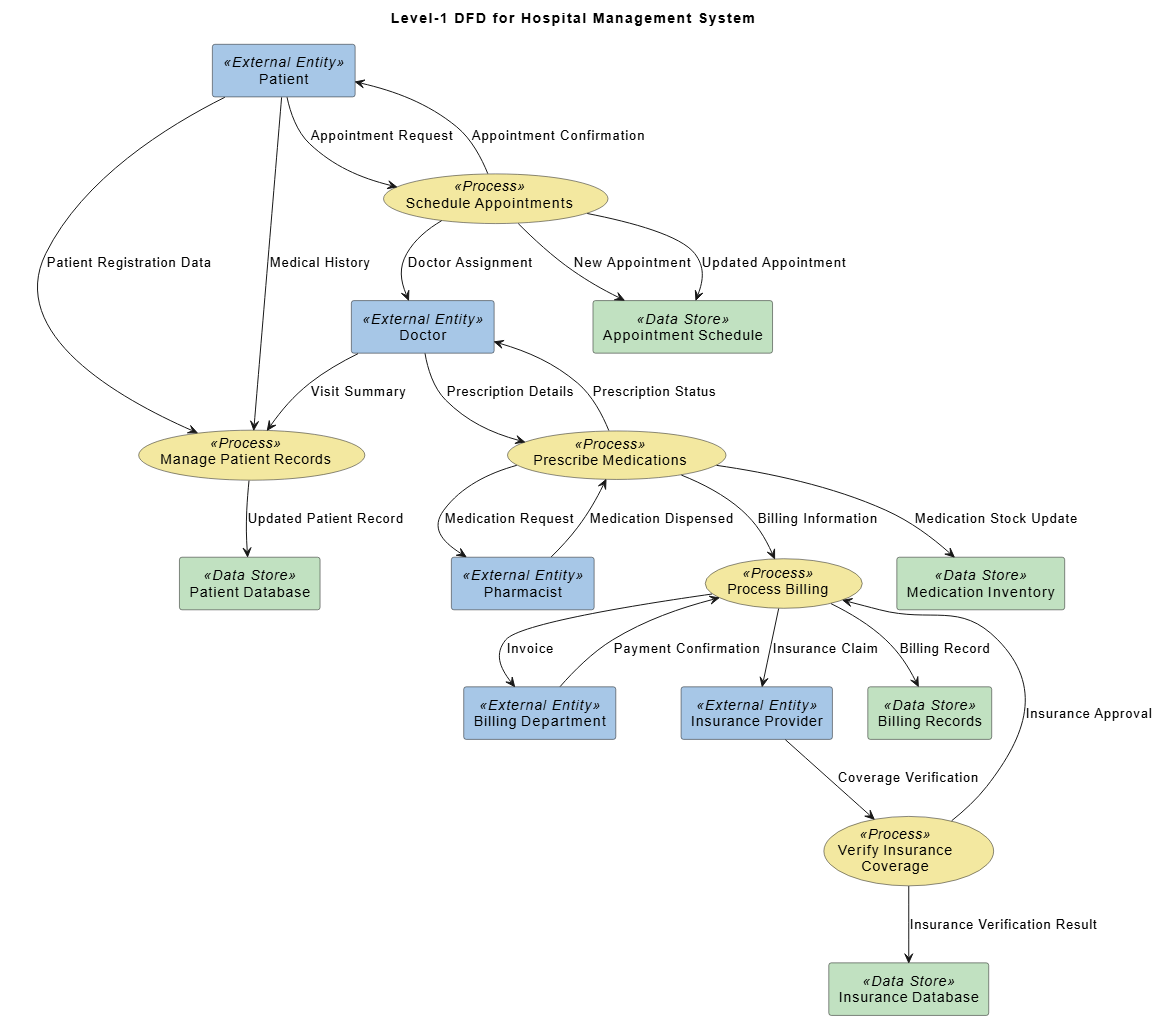
The diagram clearly showed how data flows between all stakeholders and how information is transformed at each step. What would have taken me hours was done in under 10 seconds.
Project 2: Airline Reservation System
For an airline client, I used the prompt: “Generate a Data Flow Diagram for Airline Reservation System”
The result: A professional diagram capturing:
-
External entities: Passengers, Airport Authority, Payment Gateway, Flight Operators
-
Key processes: Managing flight schedules, processing bookings, handling payments, generating tickets, updating passenger records
-
Data repositories: Flight Database, Passenger Database, Booking Records, Payment Log
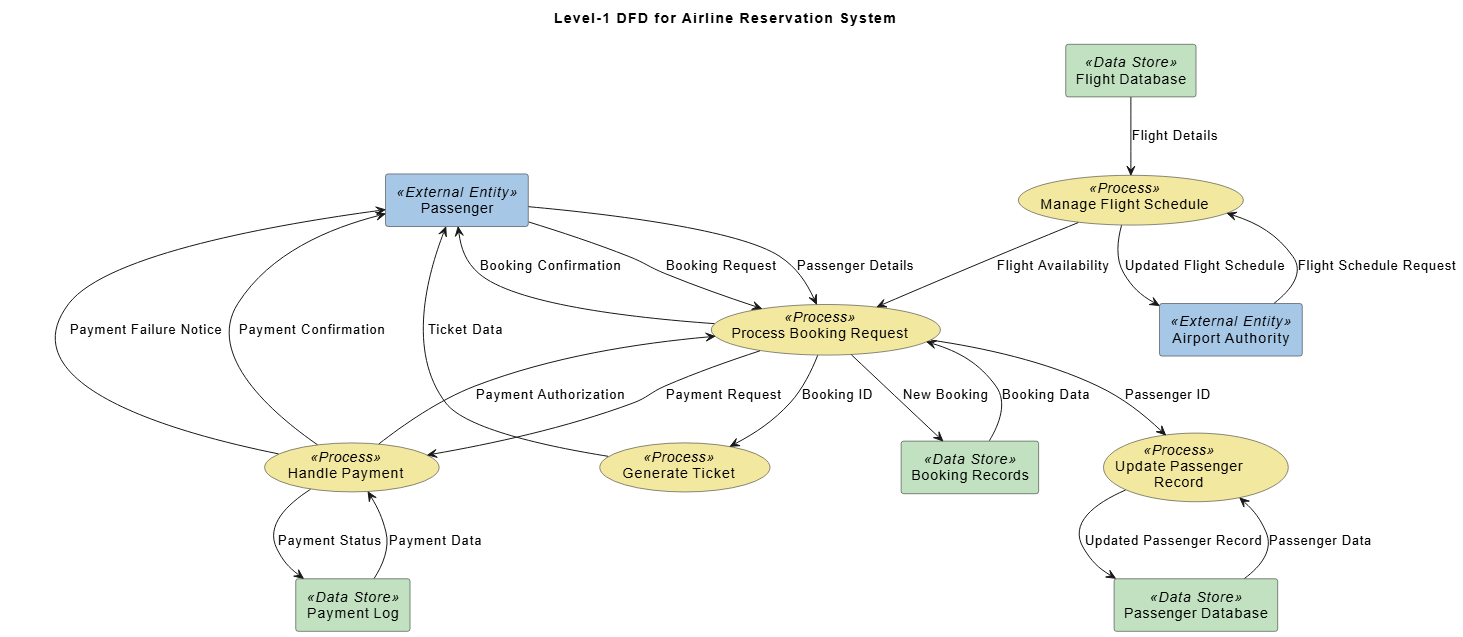
The AI even included details like booking requests, flight availability checks, payment authorization flows, and confirmation messages. The level of detail was impressive.
Project 3: Online Banking System
When documenting a fintech application, I prompted: “Generate a Data Flow Diagram for Online Banking System”
What I got: A security-conscious diagram showing:
-
External entities: Customers, Bank Administrators, Third-Party Payment Services
-
Processes: User authentication, account management, transaction processing, report generation
-
Secure data stores: Customer Database, Account Information Database, Transaction Log, Audit Trail
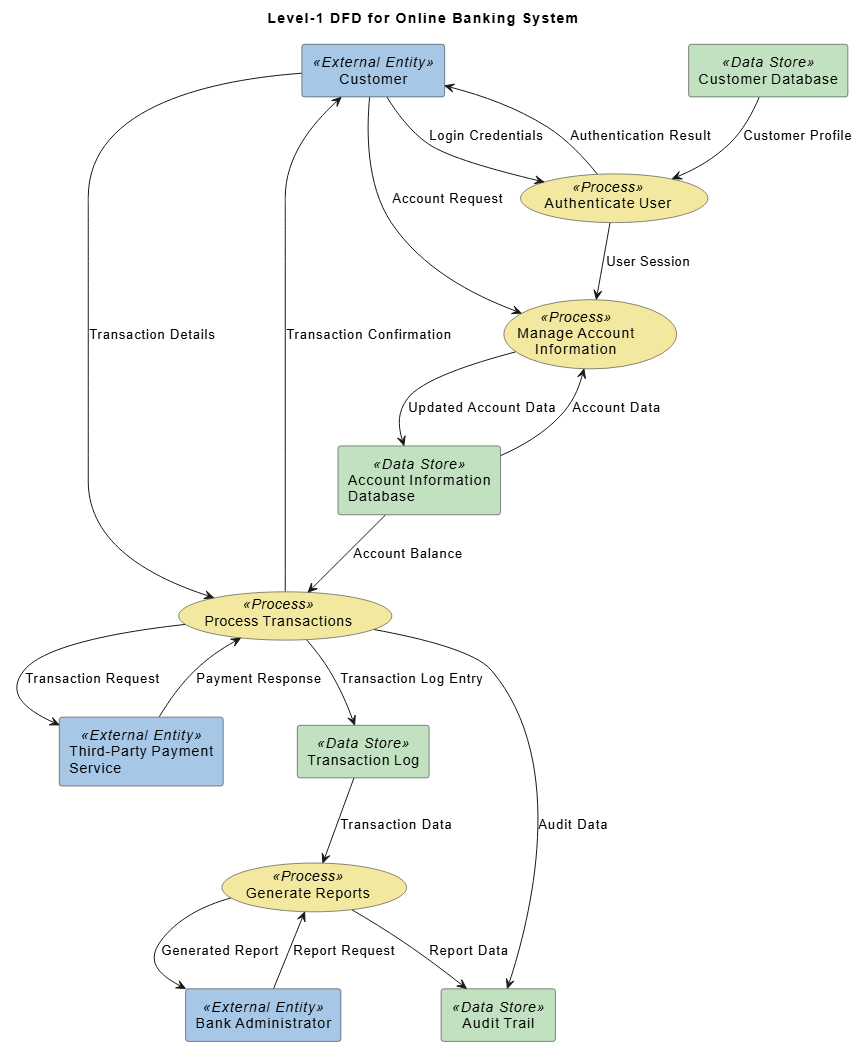
The AI understood the importance of showing login credentials, transaction details, payment requests, and audit trails—critical elements for banking systems.
Features That Transformed My Work
1. Multiple Notation Support
I discovered the AI can generate DFDs in different industry-standard notations:
-
Gane-Sarson
-
Yourdon & Coad
-
Yourdon DeMarco
This flexibility helped me match my organization’s existing documentation standards.
2. Conversational Refinement
Unlike static diagram tools, I can have an ongoing conversation with the AI:
-
“Add a validation process before the database write”
-
“Show me what happens when payment fails”
-
“Create a Level-2 diagram for the authentication process”
3. Model Integrity
The AI maintains consistency across diagram levels. When I decompose a process, it automatically:
-
Carries down relevant data stores
-
Maintains entity relationships
-
Preserves data flow connections
-
Ensures balancing between levels
4. Integration with My Workflow
Once generated, the diagrams are fully editable. I can:
-
Export to PNG, SVG, or XMI formats for presentations
-
Embed live diagrams in documentation using the Pipeline feature
-
Continue refining manually or with more AI prompts
-
Collaborate with team members through Visual Paradigm’s sharing features
What I Love About This AI Tool
Speed: What used to take me 2-3 hours now takes 10-15 seconds for the initial draft.
Accuracy: The AI correctly identifies processes, entities, and data flows based on my descriptions.
Learning curve: I didn’t need to memorize notation rules or spend hours learning the tool. Natural language is all it needs.
Professional results: The diagrams are clean, properly aligned, and presentation-ready immediately.
Iterative development: I can start vague and refine incrementally, which matches how I actually think about systems.
My Honest Assessment
Strengths:
-
Incredibly fast generation from text descriptions
-
Understands complex system requirements
-
Produces accurate, balanced DFDs
-
Supports multiple notation standards
-
Conversational interface feels natural
-
Fully editable output (not just static images)
-
Free to start trying
Areas I’d like to see improved:
-
Sometimes I need to be very specific about process boundaries
-
Very niche industry terminology occasionally needs clarification
-
Complex conditional flows sometimes require manual adjustment
Overall verdict: As someone who has used many modeling tools over the years, Visual Paradigm’s AI DFD generator is the most significant productivity improvement I’ve experienced in diagramming. It doesn’t replace the need to understand DFD concepts—you still need to know what processes, entities, and data flows are—but it eliminates the tedious manual work and lets me focus on system analysis rather than diagram mechanics.
Conclusion: My Journey Forward with AI-Powered DFDs
Looking back on my experience with data flow diagrams, I’m amazed at how much the field has evolved. When I started, creating a single DFD meant hours of manual drawing, constant erasing, and endless formatting adjustments. Today, with AI-powered tools like Visual Paradigm’s DFD generator, I can transform a simple text description into a professional diagram in seconds.
What this means for you: Whether you’re a business analyst, systems architect, software engineer, or student, you no longer need to be a diagramming expert to create professional DFDs. The AI handles the technical drawing while you focus on what really matters: understanding how data flows through your systems and communicating that clearly to stakeholders.
My recommendation: If you’re still creating DFDs manually, I strongly encourage you to try an AI-powered approach. Start with the free version of Visual Paradigm’s AI Chatbot, describe a simple system you’re working on, and see what happens. I think you’ll be as impressed as I was. The time you save on diagram creation can be reinvested in deeper analysis, better stakeholder communication, or frankly, getting home to your family at a reasonable hour.
The future of modeling: Based on my experience, AI-powered diagramming isn’t just a convenience—it’s becoming essential for staying competitive in systems analysis and business process modeling. The technology has matured to the point where the diagrams are accurate, professional, and ready for enterprise use.
My advice? Embrace these tools, but don’t skip learning the fundamentals. Understanding DFD concepts, symbols, and rules will make you better at prompting the AI and validating its output. The combination of solid foundational knowledge plus AI-powered efficiency is, in my experience, unbeatable.
Ready to transform your DFD workflow? I started my journey at Visual Paradigm’s AI Chatbot, and I believe it’s the perfect place for you to begin yours. The tool is free to start, requires no installation, and you’ll have your first AI-generated DFD in under a minute.
Happy diagramming!
- References
- What is Data Flow Diagram (DFD)?: Comprehensive guide explaining DFD fundamentals, symbols, and notation with visual examples
- Data Flow Diagram (DFD) Tutorial: Step-by-step tutorials for creating effective data flow diagrams
- DFD Guidelines and Best Practices: Practical knowledge base covering DFD design principles and common patterns
- Beginner’s Guide to Yourdon DeMarco DFD Diagrams: Introduction to Yourdon DeMarco notation style for data flow diagrams
- AI-Powered DFD Generator in Visual Paradigm AI Chatbot: Announcement and overview of the new AI DFD generation capabilities
- Data Flow Diagram Tool Features: Professional DFD editor features and capabilities
- Create DFD from Text with AI: Guide to generating data flow diagrams using natural language prompts
- AI Diagram Generator: New Types Including DFD & ERD: Details about AI-powered diagram generation for multiple diagram types
- Visual Paradigm AI Chatbot: AI-powered chatbot for visual modeling and diagram creation
- Comprehensive Review: Visual Paradigm’s AI Diagram Generation Features: Third-party review of AI diagram generation capabilities
- Yourdon and Coad DFD Editor: Tools for creating DFDs using Yourdon and Coad notation
This post is also available in Deutsch, Español, فارسی, Français, English, Bahasa Indonesia, 日本語, Polski, Portuguese, Ру́сский, Việt Nam, 简体中文 and 繁體中文.