


Flowchart is a general type of “Process Diagram”, “Process Model” or “Workflow Diagram”. It allows you to draw a picture of how a process works so that you can understand the existing process and form ideas on how to improve it. Since humans are primarily a visual species, a flowchart conveys information more effectively than a written or verbal description. Making a process visible also makes it easier to manage and captures the subtle interactions between the components.
A flowchart is used to show the successive steps in a process. Such diagrams use a series of interrelated symbols to map the entire process, making the process easy to understand and helpful in communicating with others. Flowcharts can be used to explain the workings of a complex and/or abstract process, system, concept or algorithm. Flowcharting can also help to plan and develop processes, or improve existing processes.
Why are flowcharts still relevant today?
Flowcharts can provide step-by-step illustrations for mapping complex situations, such as programming or business workflows. There are many types of process diagrams, including swim diagrams, such as cross-functional, opportunity, or deployment process diagrams.
Let’s take a look at a few more reasons why flowcharts are an effective addition to the programming process.
Here are the benefits that flowcharts can bring.
- Easy to learn.
- Instant communication.
- Effective analysis
- Good for non-technical.
- Increased efficiency.
- Problem solving.
- Visual Algorithm
- Proper Debugging
- Procedural Description
The Elements of Flowchart?
Different symbols mean different things, and each symbol has its own specific shape. The label of each step is written within the symbol shape; flowcharts use curved rectangles to show the beginning and end of a process; line segments or arrows are used to show the direction or flow from one step to another; simple instructions or action rectangles are used to indicate when a decision needs to be made, and diamond shapes are used. In addition to these, there are many other symbols that can be used in flowcharts.
Flowcharts can be horizontal or vertical.
Flowchart Symbols
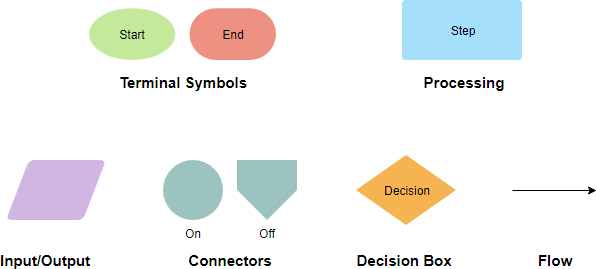
Different flowchart shapes have different conventional meanings. The meanings of some of the more common shapes are as follows:
Terminator
The terminator symbol represents the starting or ending point of the system.

Process
A box indicates some particular operation.

Document
This represents a printout, such as a document or a report.

Decision
A diamond represents a decision or branching point. Lines coming out from the diamond indicates different possible situations, leading to different sub-processes.

Data
It represents information entering or leaving the system. An input might be an order from a customer. Output can be a product to be delivered.

On-Page Reference
This symbol would contain a letter inside. It indicates that the flow continues on a matching symbol containing the same letter somewhere else on the same page.

Off-Page Reference
This symbol would contain a letter inside. It indicates that the flow continues on a matching symbol containing the same letter somewhere else on a different page.

Delay or Bottleneck
Identifies a delay or a bottleneck.

Flow
Lines represent the flow of the sequence and direction of a process.
![]()
Usages of flowcharts
- Document a process
- Develop an understanding of how a process is accomplished
- Communicate to others how a process is accomplished
- When planning a project
- brainstorm an idea
- Debug a function or program
- Explain a procedure
- Research a process that needs improvement
- When there is a need for better communication between people involved in the same process
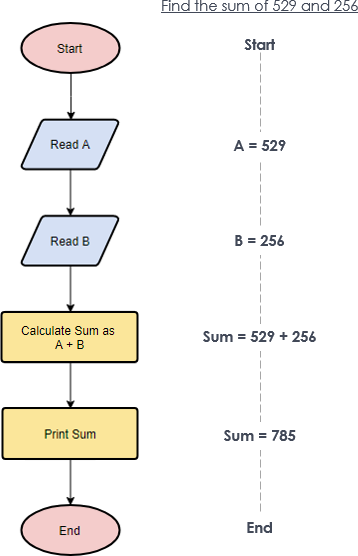
Flowchart Example – Simple Algorithms
A flowchart can also be used in visualizing algorithms, regardless of its complexity. Here is an example that shows how flowchart can be used in showing a simple summation process.
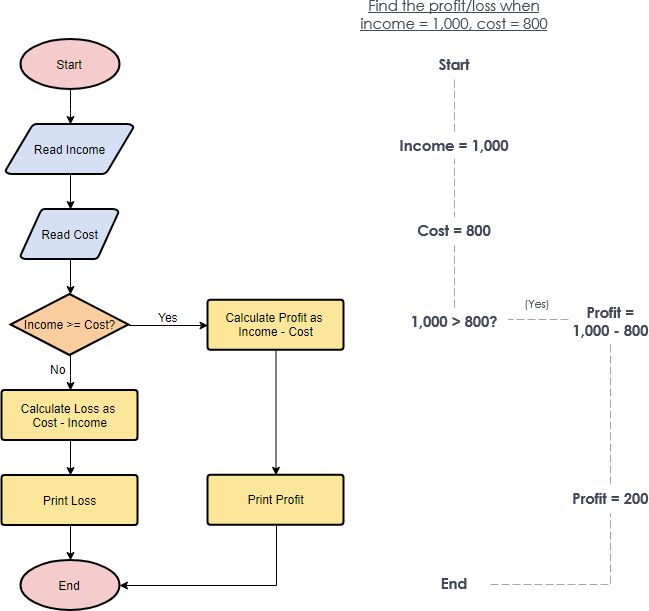
Flowchart Example – Calculate Profit and Loss
The flowchart example below shows how profit and loss can be calculated.
Use Flowchart in Different Levels of Detail
A high-level flowchart, showing six to 12 steps, gives a panoramic view of a process. These flowcharts show clearly the major blocks of activity, or the major system components, in a process.
High-level flowcharts are especially useful in the early phases of a project. A detailed flowchart is a close-up view of the process, typically showing dozens of steps. These flowcharts make it easy to identify rework loops and complexity in a process.

Detailed flowcharts are useful after teams have pinpointed issues or when they are making changes in the process.
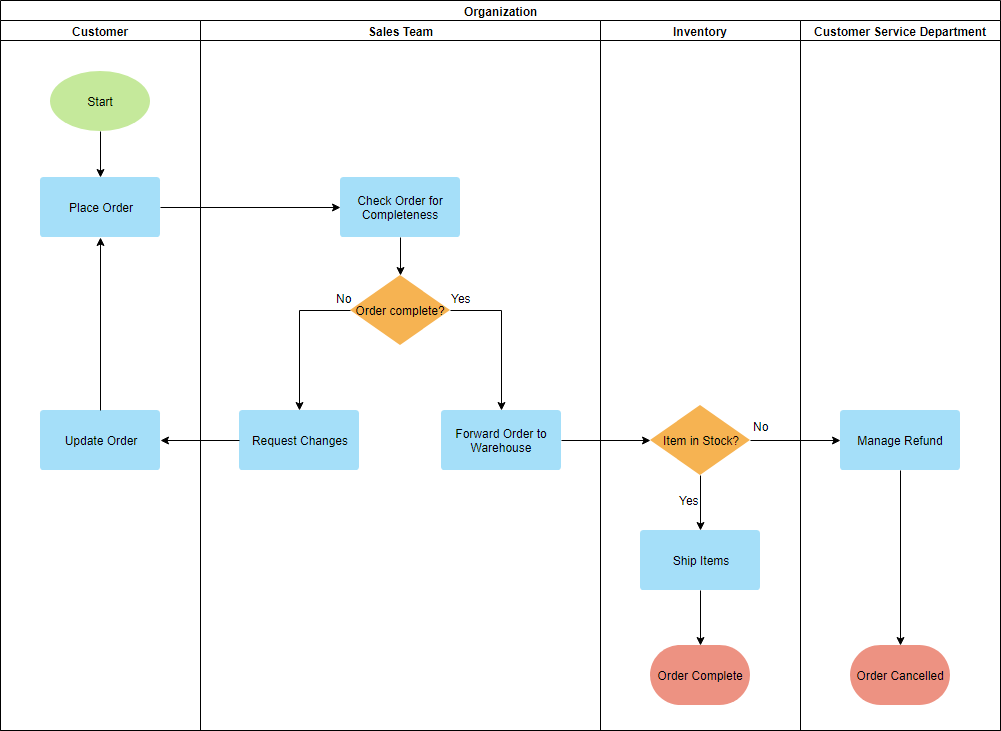
Swimlane Flowchart
A basic flowchart consists of a series of process steps connected by arrows showing the order of operations which is regarded as one dimensional. A swimlane flowchart (also known as a cross-functional flowchart) provides an additional dimension by assigning each process step to a category. Most often the category is a stakeholder (person, role, or department that visually distinguishes job sharing and responsibilities for sub-processes of a business process. The swimlanes may be arranged either horizontally or vertically.
What are the Differences? Flowchart vs Swimlane Flowchart
The swimlane flowchart differs from other flowcharts in that processes and decisions are grouped visually by placing them in lanes. Parallel lines divide the chart into lanes, with one lane for each person, group or subprocess. Lanes are labeled to show how the chart is organized.
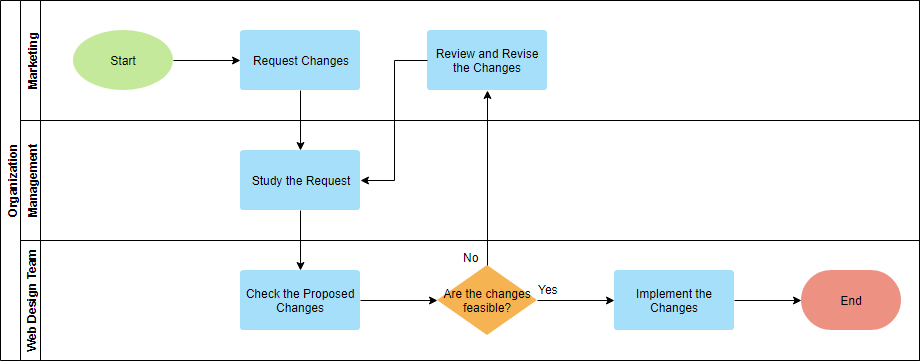
In the example below, the vertical direction represents the sequence of events in the overall process, while the horizontal divisions depict what sub-process is performing that step. Arrows between the lanes represent how information or material is passed between the sub-processes.
Alternately, the flow can be rotated so that the sequence reads horizontally from left to right, with the roles involved being shown at the left edge. This can be easier to read and design since computer screens are typically wider than they are tall, which gives an improved view of the flow.
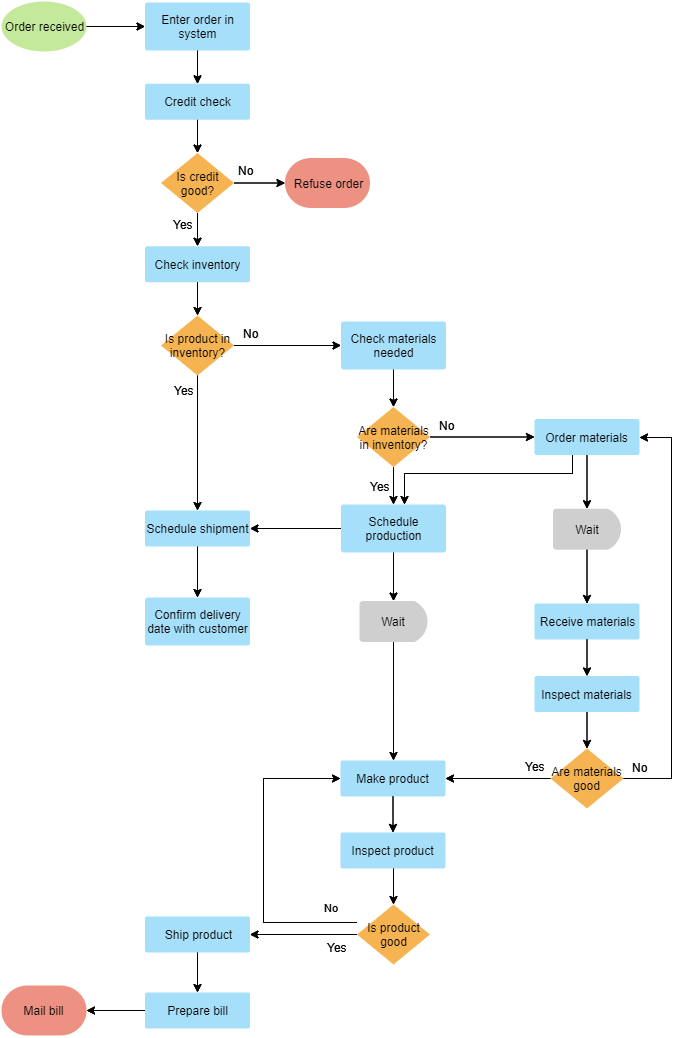
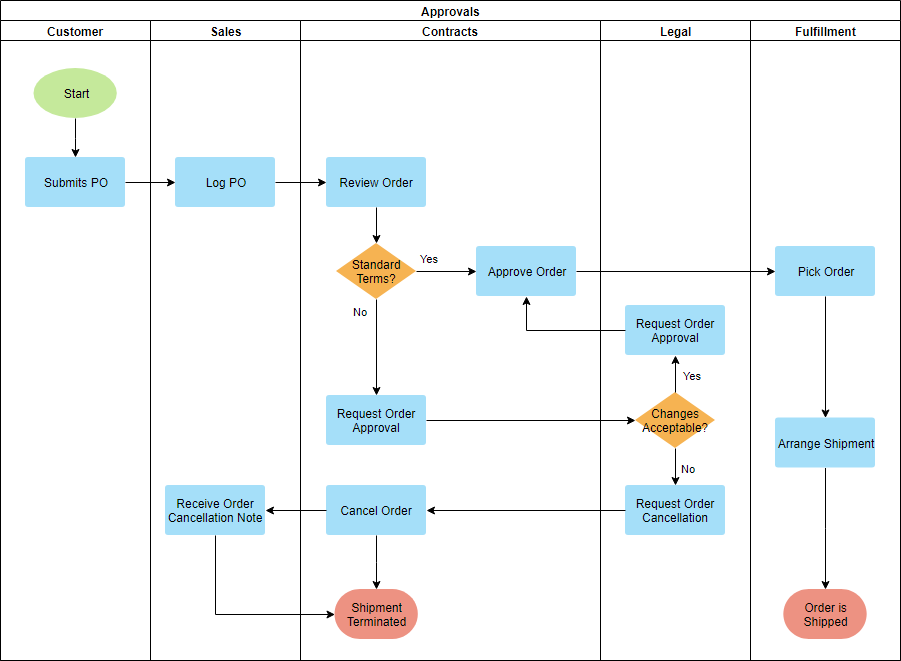
Deployment Swimlane Flowchart
The shapes used in drawing a deployment flowchart are the same as those in a standard flowchart with swimlane notations. A deployment flowchart combines two key features:
- The Sequence Of Steps In A Process
- Who Is Responsible For Which Deployment Step
It shows the steps in a process and also shows which person or group is involved in the step response. The example below shows the responsible groups listed across the top. These groups are Production, Administration, and Marketing. You could draw a deployment flowchart that lists people instead of groups. The benefit of a deployment flowchart is that it shows where work is handed from one person or group to another which are the places where misunderstandings and errors could be minimized.
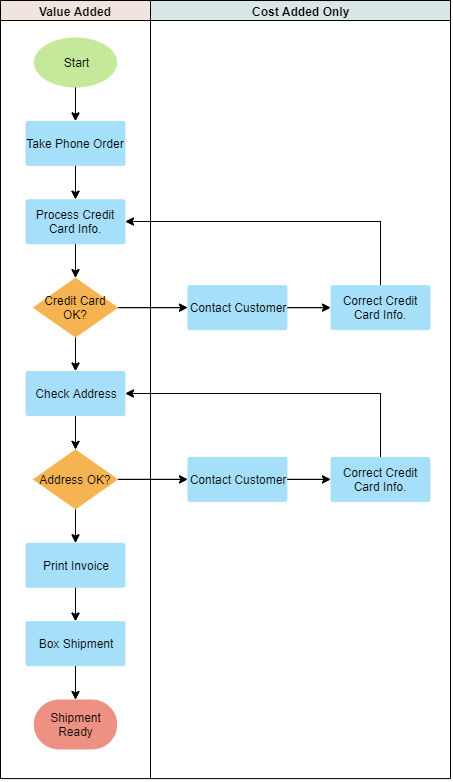
Opportunity Swimlane Flowchart
Opportunity flowcharts (also known as Value-Added flowcharts) are used to identify which steps in a process are value-added or wasteful. It separates those essential steps for making a product or service from those cost-added activities.
- Create an opportunity swimlane flowchart is to identify all the process steps.
- Determine which of the steps add value from the perspective of the customers and which do not.
- Create the flowchart for each step in the appropriate column.
References
This post is also available in Deutsch, Español, فارسی, Français, English, Bahasa Indonesia, 日本語, Polski, Portuguese, Ру́сский, Việt Nam, 简体中文 and 繁體中文.