


Introduction: Why I Turned to State Machine Diagrams (And Why You Might Too)
As a product manager who’s spent years bridging technical teams and business stakeholders, I’ve learned that clarity is everything. When requirements get complex—especially for event-driven systems like payment flows, user onboarding, or IoT device logic—textual specifications alone often fall short. That’s when I discovered UML State Machine Diagrams.
This guide shares my journey learning, applying, and reviewing state machine diagrams through Visual Paradigm’s tools. Whether you’re a developer modeling object lifecycles, a BA documenting business rules, or a PM aligning cross-functional teams, this practical walkthrough will help you understand not just what state diagrams are, but how to use them effectively in real-world projects. Let’s dive in.

What Exactly Is a State Machine Diagram?
At its core, a State Machine Diagram (also called a state diagram, state chart, or state transition diagram) models how an entity behaves based on its current state and the events it receives. Unlike simple flowcharts, state machines explicitly capture that past history matters—an object’s response to the same event can differ dramatically depending on what state it’s in.
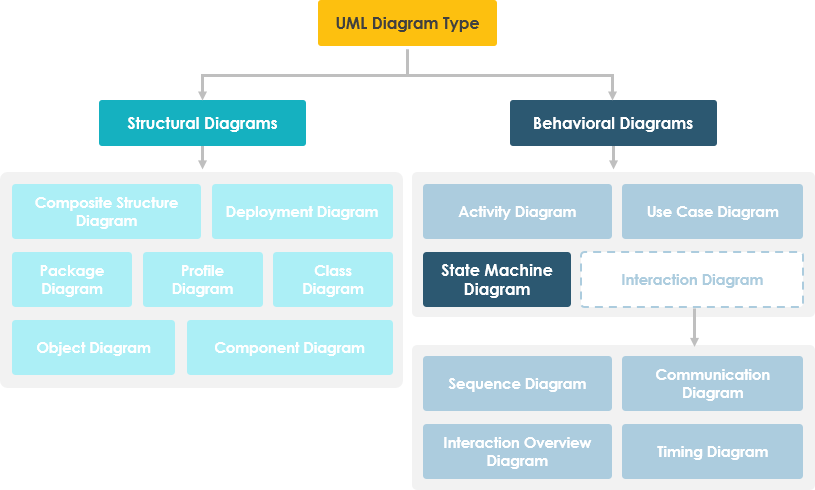
In UML terms, these diagrams belong to the behavioral diagram family and are essential for modeling dynamic system behavior. I found them particularly valuable when documenting:
-
User session management (logged in/out, idle, expired)
-
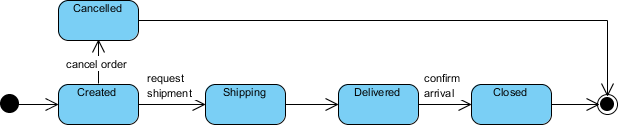
Order processing workflows (pending, confirmed, shipped, cancelled)
-
Device control logic (on, off, standby, error)
Why State Machine Diagrams? A Real-World Perspective
The power of state diagrams becomes obvious when modeling state-dependent behavior. Consider this bank account example I often use with engineering teams:
You have $100,000 in a bank account. The withdraw function works as:
balance := balance - withdrawAmount—but only if the balance after withdrawal isn’t less than $0.
This rule holds regardless of withdrawal frequency. But what happens if a withdrawal would make the balance negative? Suddenly, the behavior changes entirely because the state of the account has shifted from “positive” to “overdrawn.” A state machine diagram makes this transition explicit, along with the guard conditions and actions that accompany it.
Key insight: State diagrams help teams visualize when and why behavior changes—not just what the behavior is. This reduces ambiguity in requirements and prevents costly implementation errors.
💡 Note: A state machine diagram describes all events, states, and transitions for a single object. A sequence diagram, by contrast, shows events across multiple objects in a single interaction.
Core Concepts: States, Events, Transitions & Actions
What Is a State?
As Rumbaugh defines it: “A state is an abstraction of the attribute values and links of an object. Sets of values are grouped together into a state according to properties that affect the gross behavior of the object.”
In practice, a state represents a condition where:
-
A constraint holds true
-
The object executes an activity
-
The object waits for an event
Characteristics of States:
-
Occupies an interval of time
-
Associated with attribute values satisfying specific conditions
-
Behavior depends on both current input and historical context
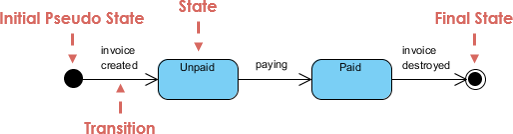
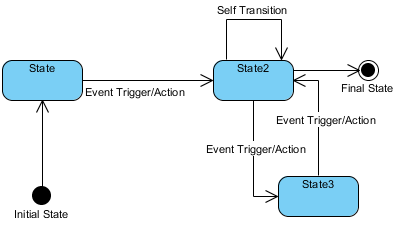
Initial and Final States
-
Initial state: Shown as a solid black circle. Marks where the state machine begins.
-
Final state: Shown as concentric circles. Represents termination of the object’s lifecycle.
Events: The Triggers of Change
Events cause transitions between states. UML recognizes four types:
-
Signal event: Arrival of an asynchronous message
-
Call event: Procedural operation call
-
Time event: Triggered after a specified duration
-
Change event: Fires when a condition becomes true
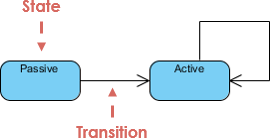
Transitions: Moving Between States
A transition represents movement from a source state to a target state, triggered by an event and optionally guarded by a condition. The pattern:
-
Object is in source state
-
Event occurs
-
Optional guard condition evaluates to true
-
Action executes (if defined)
-
Object enters target state
Actions vs. Activities
| Actions | Activities |
|---|---|
| Atomic, uninterruptible computations | Non-atomic, potentially long-running |
| Associated with transitions | Associated with states |
Examples: sendNotification(), updateBalance() |
Examples: processingPayment, validatingUser |
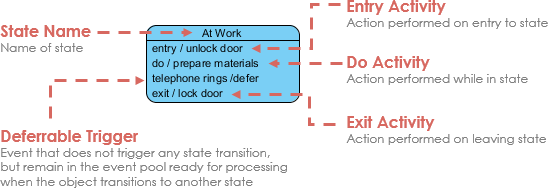
Entry/Exit Actions in Practice
Entry and exit actions execute automatically when entering or leaving a state:
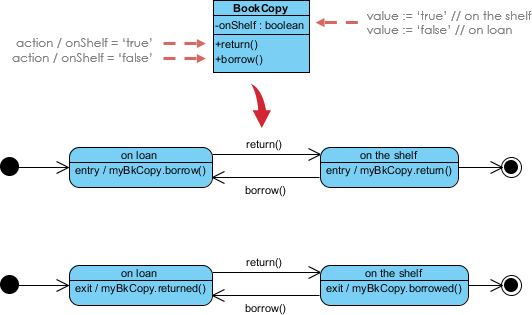
Example: For a BookCopy object:
-
Entry action on
CheckedOut:recordCheckoutDate() -
Exit action from
CheckedOut:calculateLateFees()
Building Your First State Machine Diagram: Step-by-Step
I tested Visual Paradigm’s manual workflow, and here’s how intuitive it felt:
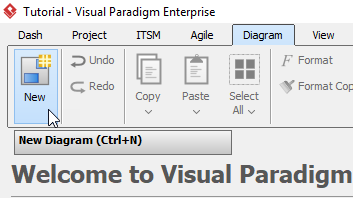
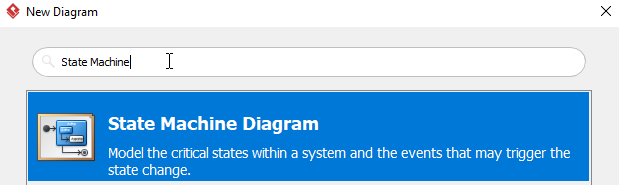
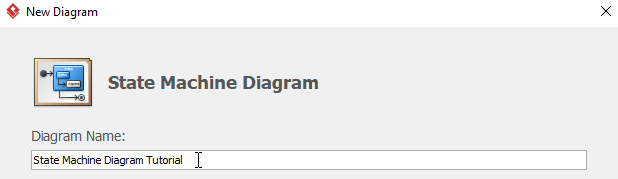
Step 1: Create a New Diagram
Select Diagram > New from the toolbar, then choose State Machine Diagram.
Step 2: Name and Initialize
Name your diagram (e.g., “BookCopy Lifecycle”) and click OK. You’ll see an empty canvas with an initial pseudo-state.
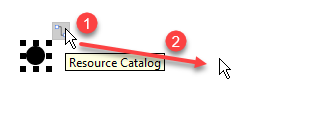
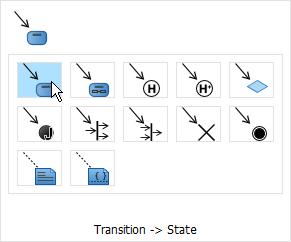
Step 3: Add States and Transitions
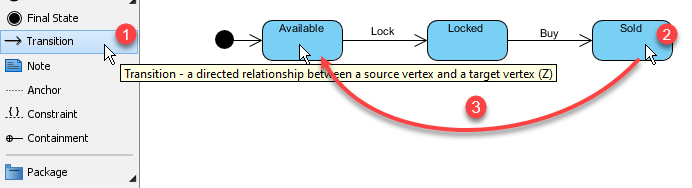
Click the initial state, drag the resource icon to position a new state, and select Transition → State. Rename states as needed.
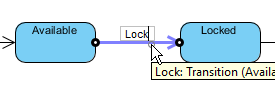
Step 4: Label Transitions
Double-click any transition arrow to name the triggering event (e.g., “Lock”, “Return”, “Renew”).
Step 5: Connect Additional Transitions
Use the Transition tool to link existing states. Don’t forget to name each one!
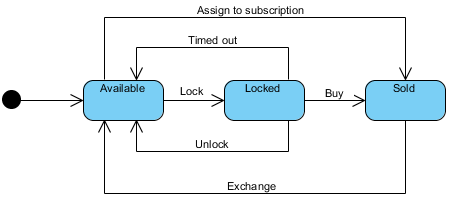
Final Result
Advanced Features: When Simple Isn’t Enough
Substates: Managing Complexity Through Nesting
Composite states let you group related substates, reducing visual clutter. For example, a “Heater” system might have a “Cooling” composite state containing “Startup,” “Ready,” and “Running” substates.
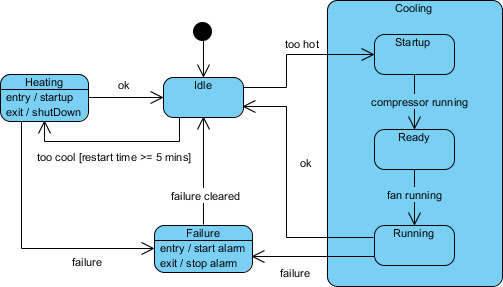
Testing tip: Derive test cases directly from your diagram:
-
Idle state receives “Too Hot” event
-
Cooling/Running state receives “Failure” event
-
Failure state receives “Failure Cleared” event
History States: Remembering Where You Left Off
By default, entering a composite state restarts its nested machine from the initial state. History states (marked with H or H*) let you re-enter the last active substate.
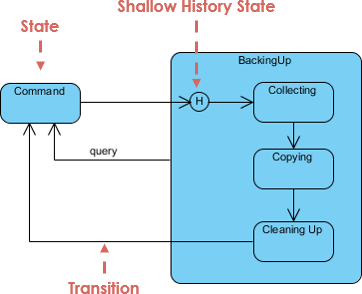
Use case: A user pauses a multi-step checkout flow. When they return, the system resumes from the exact step they left—not the beginning.
Concurrent States: Modeling Parallel Behaviors
Some processes involve independent, simultaneous activities. Concurrent regions (separated by dashed lines) model this elegantly.
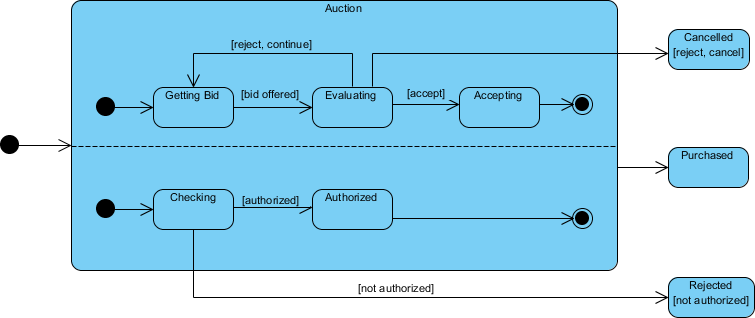
Example: An auction system concurrently processes bids and authorizes payment limits. The composite state exits only when both sub-processes complete.
Two Paths to Creation: Manual Precision vs. AI Speed
During my evaluation, I tested both approaches Visual Paradigm offers:
🛠️ Traditional Manual Method
Best for: Final documentation, compliance-heavy projects, or when you need pixel-perfect control.
Workflow:
-
Drag-and-drop states and transitions
-
Right-click to open Specification windows for guard conditions, entry/exit actions
-
Add horizontal/vertical regions for concurrent behaviors
Pros: Full control, standards-compliant output, ideal for complex guard logic
Cons: Steeper learning curve, time-intensive for iterative prototyping
🤖 AI-Assisted Generation
Best for: Rapid prototyping, brainstorming sessions, or translating verbal requirements into visuals.
Workflow:
-
Open AI Chatbot (Tools menu or top-right icon)
-
Describe behavior: “Create a state machine for an ATM withdrawal: start at Idle, accept card, verify PIN, allow withdrawal if balance sufficient, eject card on completion or error”
-
Review and refine via chat: “Add a timeout transition from PIN entry to Idle”
Smart features I appreciated:
-
Automatic layout and OMG/IEEE notation compliance
-
Detection of unreachable states or dead-end transitions
-
One-click export to Visual Paradigm Desktop for code engineering (Java, Python, C++)
Practical Tips From My Experience
-
Start simple: Model the happy path first, then add error states and edge cases.
-
Name transitions clearly: Use verb-noun pairs (
LockAccount,ProcessPayment) for readability. -
Document guard conditions:
[balance >= amount]prevents ambiguity. -
Use entry/exit actions sparingly: Reserve them for behaviors that always occur on state entry/exit.
-
Validate with stakeholders: Walk through the diagram with business users to confirm behavior matches expectations.
-
Generate test cases: Each transition represents a potential test scenario.
Conclusion: When to Reach for a State Machine Diagram
After weeks of hands-on use, I now consider state machine diagrams an essential tool in my product toolkit—not just for technical documentation, but for aligning cross-functional teams around complex behavioral requirements.
Use state diagrams when:
✅ Modeling event-driven systems (IoT, workflows, user sessions)
✅ Clarifying state-dependent business rules
✅ Deriving test cases for QA teams
✅ Onboarding new engineers to system behavior
Consider alternatives when:
❌ The logic is purely sequential (use a flowchart)
❌ You’re modeling interactions between multiple objects (use a sequence diagram)
❌ Requirements are still highly volatile (start with user stories first)
Visual Paradigm’s dual approach—manual precision plus AI acceleration—makes it accessible whether you’re a UML veteran or a curious newcomer. The free Community Edition is genuinely usable for learning and small projects, while the AI features significantly reduce the friction of getting started.
If you’re wrestling with ambiguous requirements or complex state logic, I encourage you to try sketching a state machine diagram. You might be surprised how much clarity it brings—not just to your documentation, but to your entire team’s understanding of the system.
References
- AI State Diagram Generator | Visual Paradigm AI: Comprehensive guide to Visual Paradigm’s AI-powered state diagram generation features, including conversational editing and smart layout.
- All You Need to Know about State Diagrams: Foundational reference covering state diagram concepts, notation, and best practices.
- Visual Paradigm Release Notes: AI Diagram Generator: Announcement of AI diagram generator expansion to 13 diagram types, highlighting speed and intelligence improvements.
- Mastering State Diagrams with Visual Paradigm AI: Automated Toll Systems: Case study demonstrating AI-assisted state diagram creation for complex embedded systems.
- Beginner’s Guide to State Machine Diagrams: Entry-level tutorial walking through core concepts with practical examples.
- How to Draw State Machine Diagram in UML (Tutorial): Step-by-step visual tutorial for manual state diagram creation in Visual Paradigm.
- Creating States in Visual Paradigm User Guide: Official documentation on state creation, modification, and specification.
- Modeling Guidelines for State Machines: Advanced modeling techniques including composite states, history, and concurrency.
- Visual Paradigm AI Chatbot Features: Overview of AI chatbot capabilities for diagram generation and refinement.
- AI Chatbot: UML State Machine Diagram Generator: Direct link to the web-based AI tool for generating state diagrams via natural language.
- What Makes Visual Paradigm’s AI Chatbot Different?: Comparative analysis of Visual Paradigm’s AI approach versus generic diagramming AIs.
- Hands-On Review: Visual Paradigm AI Activity Diagram Generator: Independent review of AI diagramming capabilities, with insights applicable to state machines.
- Mastering UML State Machine Diagrams with Visual Paradigm AI: In-depth tutorial combining theory with AI-assisted practical workflows.
- YouTube: State Machine Diagram Tutorial: Video walkthrough of manual state diagram creation techniques.
- YouTube: AI-Powered State Diagram Generation: Demonstration of conversational AI generating and refining state diagrams.
- YouTube: Advanced State Machine Modeling: Tutorial covering substates, history, and concurrent regions in Visual Paradigm.
This post is also available in Deutsch, Español, فارسی, Français, English, Bahasa Indonesia, 日本語, Polski, Portuguese, Ру́сский, Việt Nam, 简体中文 and 繁體中文.