


1. Introduction to Data Flow Diagrams
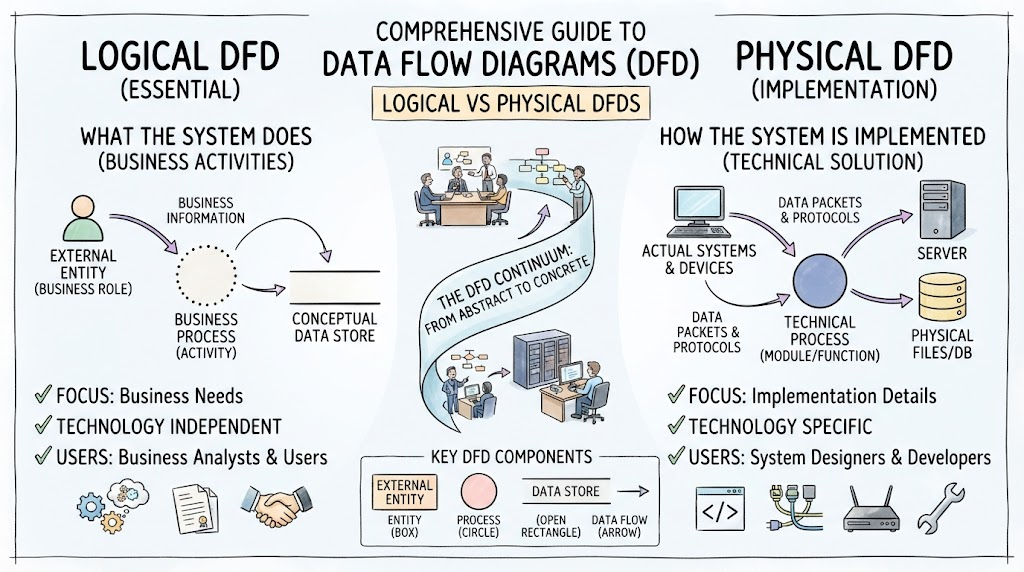
A Data Flow Diagram (DFD) is a graphical representation of how data moves through an information system. It shows:
- Where data comes from and goes to
- How data is processed
- Where data is stored
- Who or what interacts with the system
2. Key Concepts
Core Elements
| Element | Symbol | Purpose |
|---|---|---|
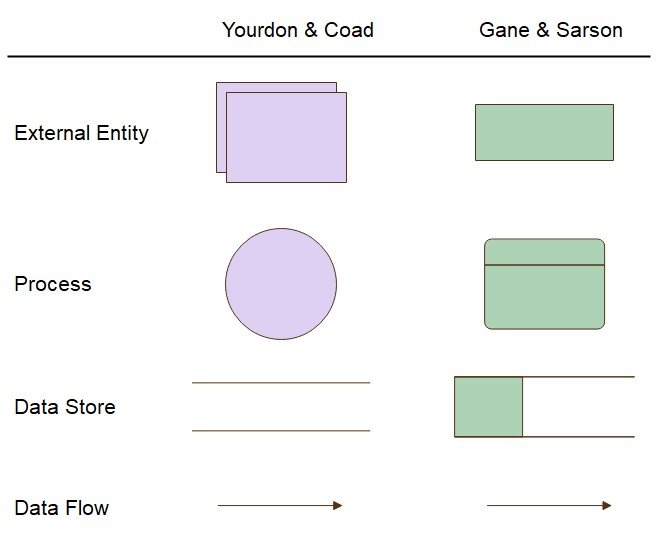
| External Entity | Rectangle | Person, organization, or system that sends/receives data |
| Process | Circle/Ellipse | Transforms incoming data into outgoing data |
| Data Store | Open Rectangle | Repository for persistent data storage |
| Data Flow | Arrow | Shows the direction of data movement |
DFD Levels
- Context Diagram (Level 0): Highest level, shows system boundaries and major external entities
- Level 1: Decomposes the main process into major sub-processes
- Level 2+: Further decomposition showing detailed processes
3. Logical vs Physical DFDs
Logical DFD
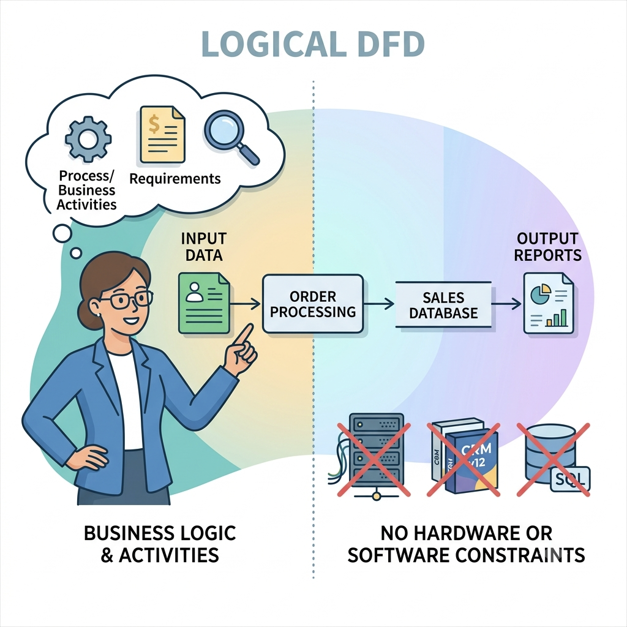
A logical DFD (also called “essential model”) focuses on:
- WHAT the system does
- Business activities and information requirements
- Independent of implementation technology
Characteristics:
- Shows business operations and processes
- No technology-specific details
- More abstract and user-focused
- Helps understand business requirements
Physical DFD
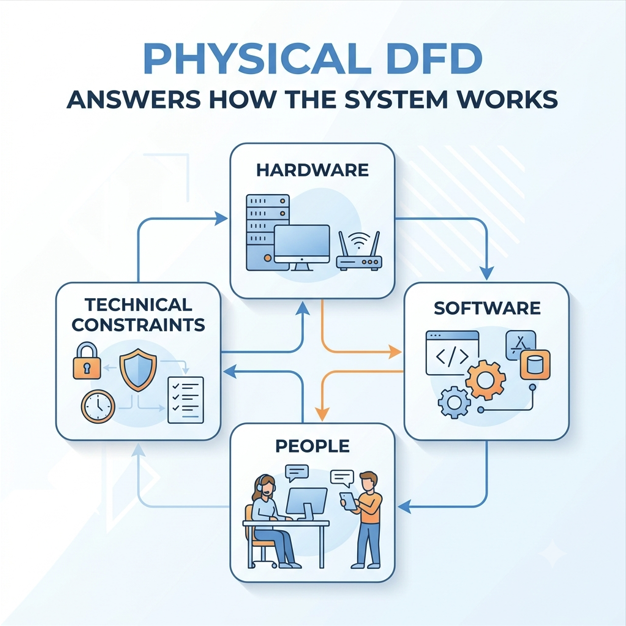
A physical DFD (also called “implementation model”) focuses on:
- HOW the system will be implemented
- Technical details and constraints
- Specific technologies and systems
Characteristics:
- Shows actual hardware, software, and people
- Includes implementation details
- More concrete and developer-focused
- Helps in system design and deployment
Comparison Table
| Aspect | Logical DFD | Physical DFD |
|---|---|---|
| Focus | Business needs | Implementation |
| Who | Business analysts, users | System designers, developers |
| Level | High-level, abstract | Detailed, concrete |
| Components | Business processes | Technical processes |
| Data Stores | Conceptual entities | Physical files/databases |
| Entities | Business roles | Actual systems/devices |
4. DFD Components
External Entities
- Sources and destinations of data
- Outside the system boundary
- Named with nouns
Processes
- Transform data from input to output
- Named with verb + noun
- Numbered for identification
Data Stores
- Persistent data repositories
- Named with nouns
- D1, D2, D3… numbering
Data Flows
- Show movement of data
- Named with descriptive labels
- Direction indicates flow
5. Working Examples with Graphviz
Example 1: Hotel Management System (Logical DFD)
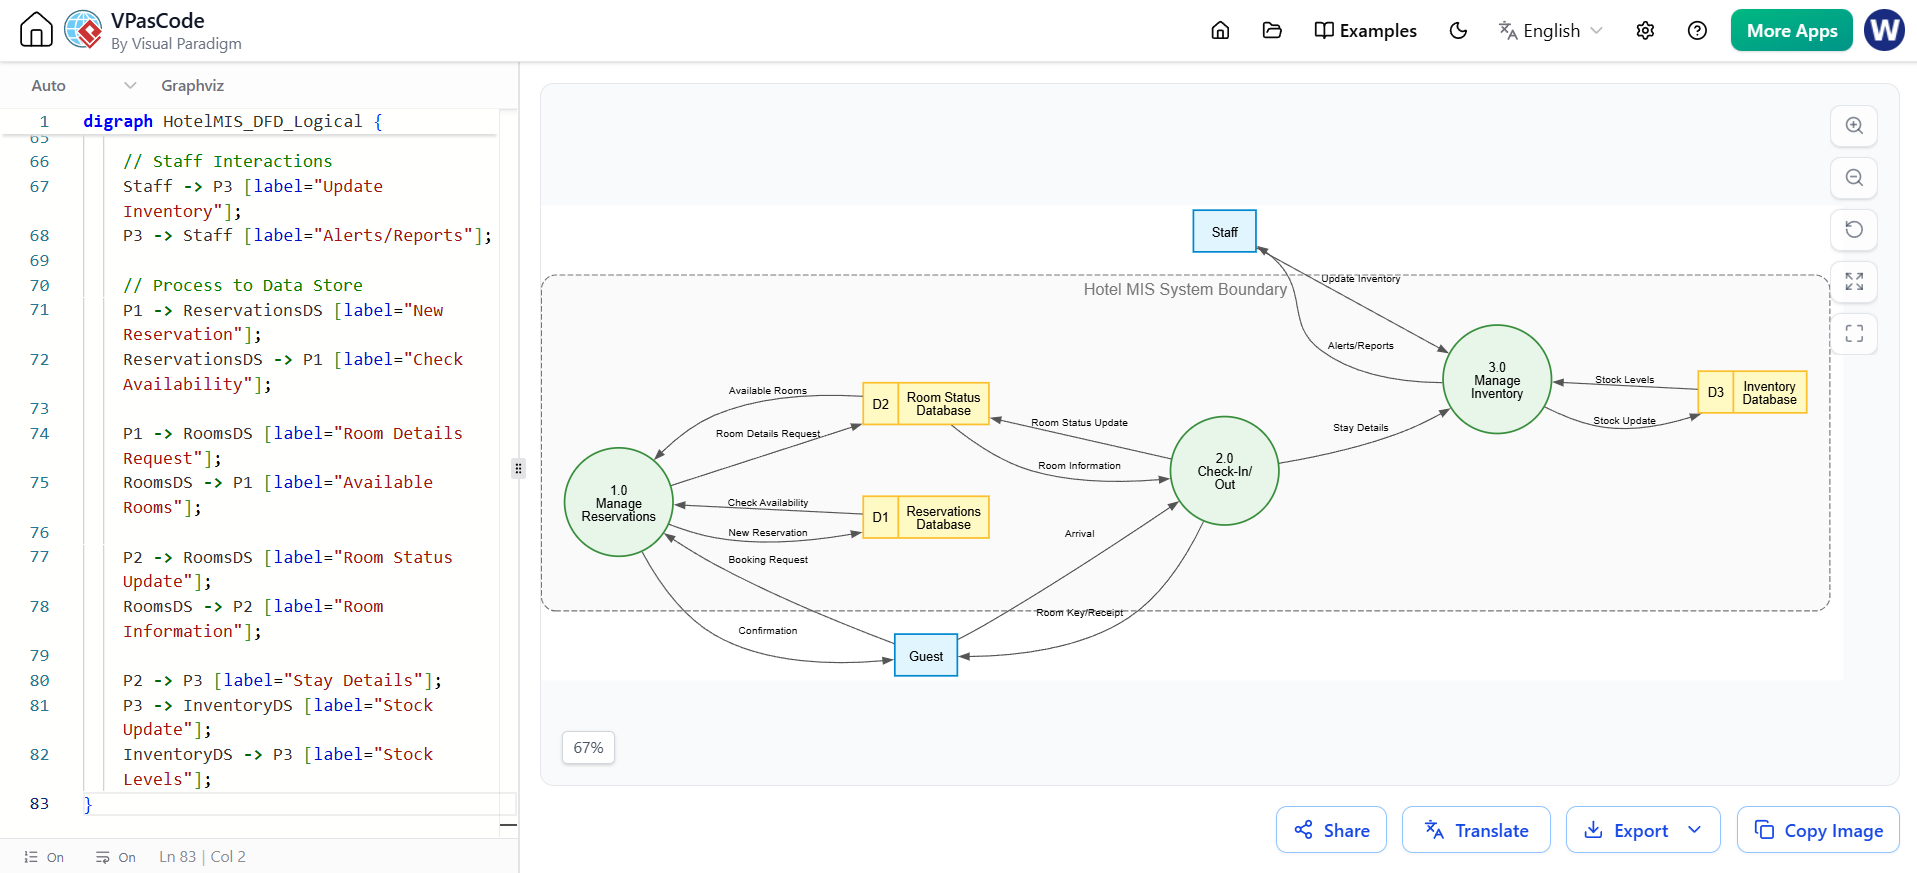
digraph HotelMIS_DFD_Logical {
    // --- GRAPH STYLE ---
    graph [
        rankdir = LR
        splines = true
        overlap = false
        nodesep = 0.6
        ranksep = 1.0
        fontname = "Helvetica,Arial,sans-serif"
        fontsize = 12
    ]

    // --- NODE STYLES ---
    node [
        fontname = "Helvetica,Arial,sans-serif"
        fontsize = 11
        penwidth = 1.5
    ]

    // External Entities
    node [shape = box, style = "filled", fillcolor = "#E1F5FE", color = "#0288D1"]
    Guest;
    Staff;

    // --- SYSTEM BOUNDARY ---
    subgraph cluster_SystemBoundary {
        label = "Hotel MIS System Boundary";
        fontname = "Helvetica,Arial,sans-serif";
        fontcolor = "#757575";
        fontsize = 14;
        color = "#757575";
        style = "dashed,rounded";
        bgcolor = "#FAFAFA";
        margin = 20;

        // Processes
        node [shape = circle, style = "filled", fillcolor = "#E8F5E9", color = "#388E3C", fixedsize = true, width = 1.3]
        P1 [label="1.0\nManage\nReservations"];
        P2 [label="2.0\nCheck-In/\nOut"];
        P3 [label="3.0\nManage\nInventory"];

        // Data Stores
        node [shape = record, style = "filled", fillcolor = "#FFF9C4", color = "#FBC02D", fixedsize = false]
        ReservationsDS [label="{ <id> D1 | Reservations\nDatabase }"];
        RoomsDS        [label="{ <id> D2 | Room Status\nDatabase }"];
        InventoryDS    [label="{ <id> D3 | Inventory\nDatabase }"];
    }

    // --- EDGE STYLES ---
    edge [
        fontname = "Helvetica,Arial,sans-serif"
        fontsize = 9
        color = "#555555"
        arrowsize = 0.8
    ]

    // --- DATA FLOWS ---

    // Guest Interactions
    Guest -> P1 [label="Booking Request"];
    P1 -> Guest [label="Confirmation"];

    Guest -> P2 [label="Arrival"];
    P2 -> Guest [label="Room Key/Receipt"];

    // Staff Interactions
    Staff -> P3 [label="Update Inventory"];
    P3 -> Staff [label="Alerts/Reports"];

    // Process to Data Store
    P1 -> ReservationsDS [label="New Reservation"];
    ReservationsDS -> P1 [label="Check Availability"];

    P1 -> RoomsDS [label="Room Details Request"];
    RoomsDS -> P1 [label="Available Rooms"];

    P2 -> RoomsDS [label="Room Status Update"];
    RoomsDS -> P2 [label="Room Information"];

    P2 -> P3 [label="Stay Details"];
    P3 -> InventoryDS [label="Stock Update"];
    InventoryDS -> P3 [label="Stock Levels"];
}
Example 2: Logical DFD – Library Management System
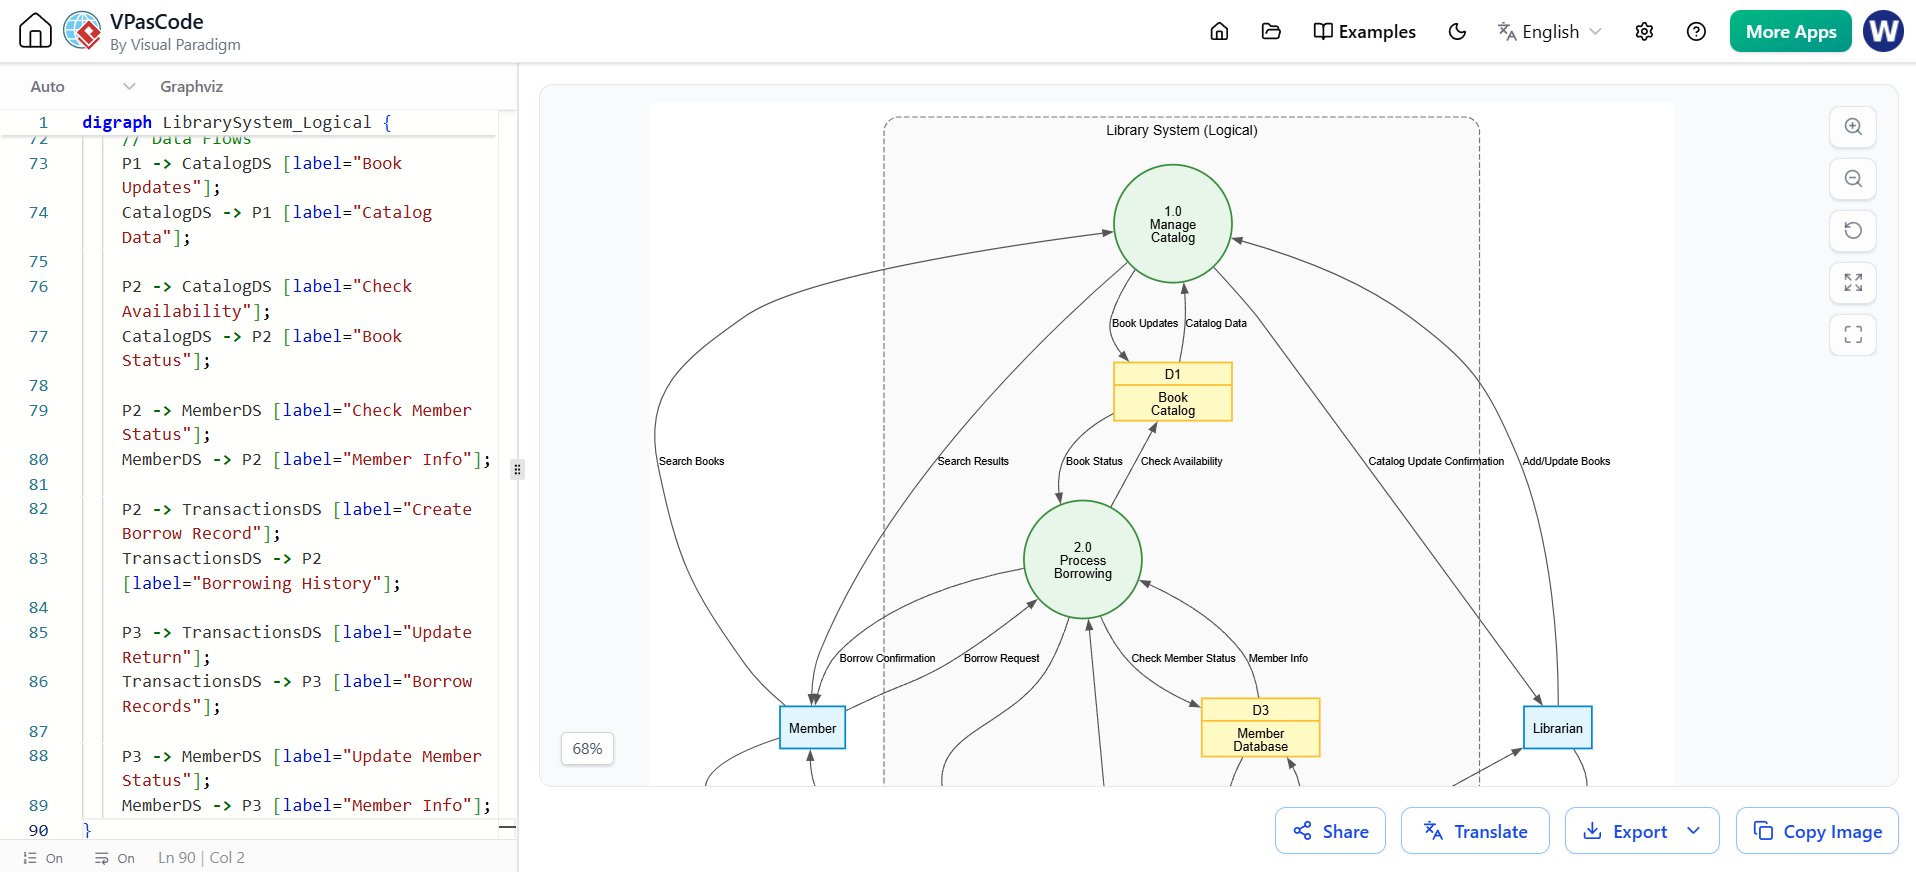
digraph LibrarySystem_Logical {
    // --- GRAPH STYLE ---
    graph [
        rankdir = TB
        splines = true
        nodesep = 0.5
        ranksep = 0.8
        fontname = "Helvetica,Arial,sans-serif"
        fontsize = 12
    ]

    // --- NODE STYLES ---
    node [
        fontname = "Helvetica,Arial,sans-serif"
        fontsize = 11
        penwidth = 1.5
    ]

    // External Entities
    node [shape = box, style = "filled", fillcolor = "#E1F5FE", color = "#0288D1"]
    Member;
    Librarian;

    // --- SYSTEM BOUNDARY ---
    subgraph cluster_LibrarySystem {
        label = "Library System (Logical)";
        style = "dashed,rounded";
        color = "#757575";
        bgcolor = "#FAFAFA";
        margin = 20;

        // Processes
        node [shape = circle, style = "filled", fillcolor = "#E8F5E9", color = "#388E3C", width = 1.4]
        P1 [label="1.0\nManage\nCatalog"];
        P2 [label="2.0\nProcess\nBorrowing"];
        P3 [label="3.0\nHandle\nReturns"];

        // Data Stores
        node [shape = record, style = "filled", fillcolor = "#FFF9C4", color = "#FBC02D"]
        CatalogDS [label="{ <id> D1 | Book\nCatalog }"];
        TransactionsDS [label="{ <id> D2 | Borrowing\nRecords }"];
        MemberDS [label="{ <id> D3 | Member\nDatabase }"];
    }

    // --- EDGE STYLES ---
    edge [
        fontname = "Helvetica,Arial,sans-serif"
        fontsize = 9
        color = "#555555"
        arrowsize = 0.8
    ]

    // --- DATA FLOWS ---

    // Member Interactions
    Member -> P1 [label="Search Books"];
    P1 -> Member [label="Search Results"];

    Member -> P2 [label="Borrow Request"];
    P2 -> Member [label="Borrow Confirmation"];

    Member -> P3 [label="Return Books"];
    P3 -> Member [label="Return Receipt"];

    // Librarian Interactions
    Librarian -> P1 [label="Add/Update Books"];
    P1 -> Librarian [label="Catalog Update Confirmation"];

    Librarian -> P3 [label="Process Overdue"];
    P3 -> Librarian [label="Overdue Report"];

    // Data Flows
    P1 -> CatalogDS [label="Book Updates"];
    CatalogDS -> P1 [label="Catalog Data"];

    P2 -> CatalogDS [label="Check Availability"];
    CatalogDS -> P2 [label="Book Status"];

    P2 -> MemberDS [label="Check Member Status"];
    MemberDS -> P2 [label="Member Info"];

    P2 -> TransactionsDS [label="Create Borrow Record"];
    TransactionsDS -> P2 [label="Borrowing History"];

    P3 -> TransactionsDS [label="Update Return"];
    TransactionsDS -> P3 [label="Borrow Records"];

    P3 -> MemberDS [label="Update Member Status"];
    MemberDS -> P3 [label="Member Info"];
}
Example 3: Physical DFD – Library Management System
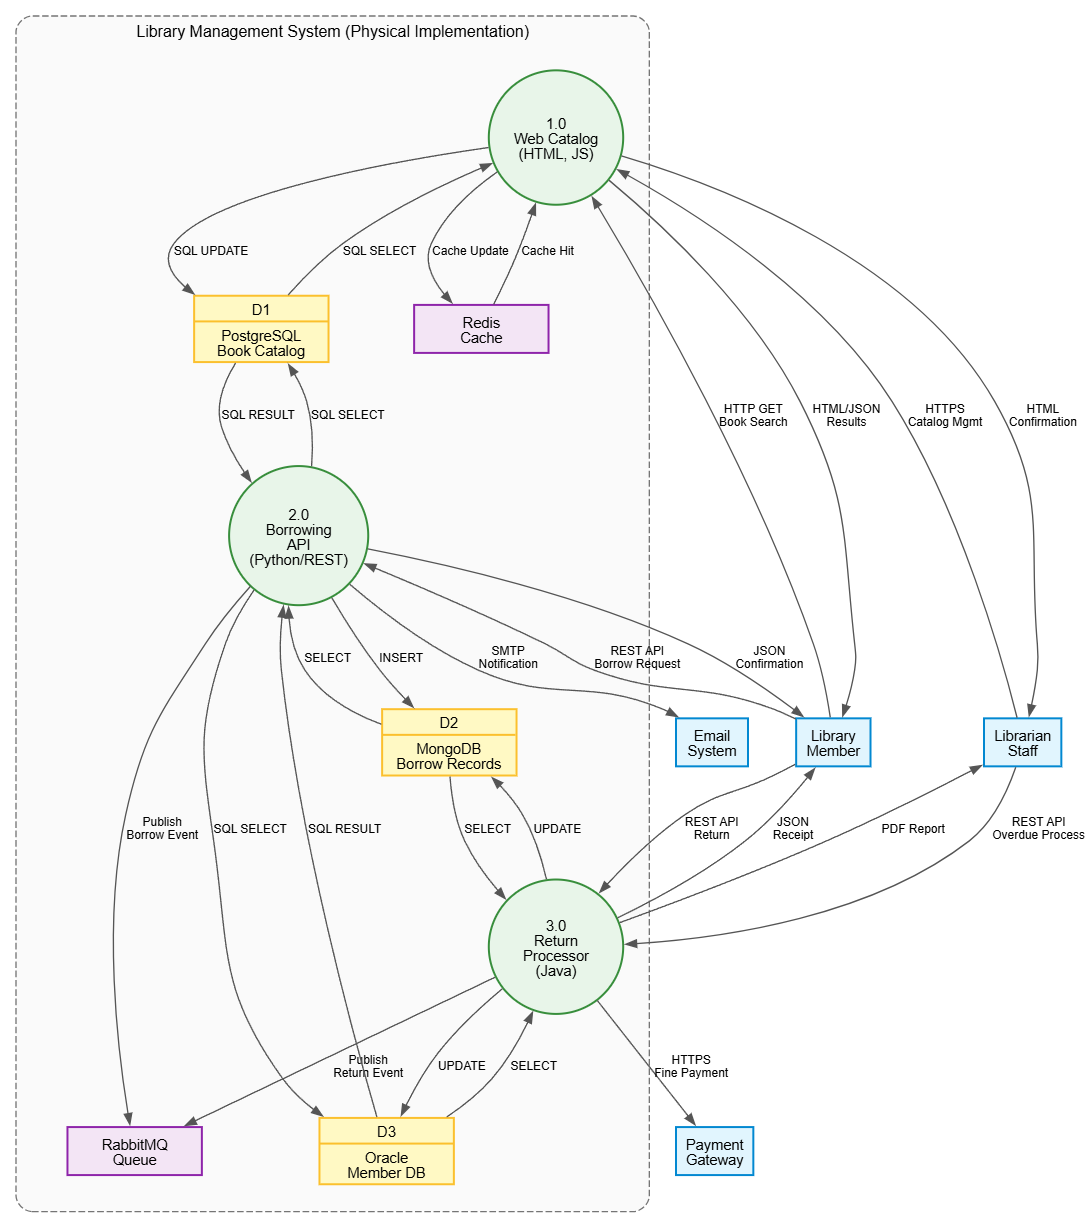
digraph LibrarySystem_Physical {
    // --- GRAPH STYLE ---
    graph [
        rankdir = TB
        splines = true
        nodesep = 0.5
        ranksep = 0.8
        fontname = "Helvetica,Arial,sans-serif"
        fontsize = 12
    ]

    // --- NODE STYLES ---
    node [
        fontname = "Helvetica,Arial,sans-serif"
        fontsize = 11
        penwidth = 1.5
    ]

    // External Entities (Physical)
    node [shape = box, style = "filled", fillcolor = "#E1F5FE", color = "#0288D1"]
    "Library Member" [label="Library\nMember"];
    "Librarian" [label="Librarian\nStaff"];
    "Email System" [label="Email\nSystem"];
    "Payment Gateway" [label="Payment\nGateway"];

    // --- SYSTEM BOUNDARY ---
    subgraph cluster_LibrarySystem_Physical {
        label = "Library Management System (Physical Implementation)";
        style = "dashed,rounded";
        color = "#757575";
        bgcolor = "#FAFAFA";
        margin = 20;

        // Physical Processes (with technology details)
        node [shape = circle, style = "filled", fillcolor = "#E8F5E9", color = "#388E3C", width = 1.4]
        P1 [label="1.0\nWeb Catalog\n(HTML, JS)"];
        P2 [label="2.0\nBorrowing\nAPI\n(Python/REST)"];
        P3 [label="3.0\nReturn\nProcessor\n(Java)"];

        // Physical Data Stores (with technology details)
        node [shape = record, style = "filled", fillcolor = "#FFF9C4", color = "#FBC02D"]
        CatalogDS [label="{ <id> D1 | PostgreSQL\nBook Catalog }"];
        TransactionsDS [label="{ <id> D2 | MongoDB\nBorrow Records }"];
        MemberDS [label="{ <id> D3 | Oracle\nMember DB }"];

        // Additional physical components
        node [shape = box, style = "filled", fillcolor = "#F3E5F5", color = "#8E24AA"]
        "Cache Server" [label="Redis\nCache"];
        "Message Queue" [label="RabbitMQ\nQueue"];
    }

    // --- EDGE STYLES ---
    edge [
        fontname = "Helvetica,Arial,sans-serif"
        fontsize = 9
        color = "#555555"
        arrowsize = 0.8
    ]

    // --- DATA FLOWS (Physical) ---

    // Physical Member Interactions
    "Library Member" -> P1 [label="HTTP GET\nBook Search"];
    P1 -> "Library Member" [label="HTML/JSON\nResults"];

    "Library Member" -> P2 [label="REST API\nBorrow Request"];
    P2 -> "Library Member" [label="JSON\nConfirmation"];

    "Library Member" -> P3 [label="REST API\nReturn"];
    P3 -> "Library Member" [label="JSON\nReceipt"];

    // Physical Librarian Interactions
    "Librarian" -> P1 [label="HTTPS\nCatalog Mgmt"];
    P1 -> "Librarian" [label="HTML\nConfirmation"];

    "Librarian" -> P3 [label="REST API\nOverdue Process"];
    P3 -> "Librarian" [label="PDF Report"];

    // External System Interactions
    P2 -> "Email System" [label="SMTP\nNotification"];
    P3 -> "Payment Gateway" [label="HTTPS\nFine Payment"];

    // Data Flows (Physical)
    P1 -> CatalogDS [label="SQL UPDATE"];
    CatalogDS -> P1 [label="SQL SELECT"];

    P1 -> "Cache Server" [label="Cache Update"];
    "Cache Server" -> P1 [label="Cache Hit"];

    P2 -> CatalogDS [label="SQL SELECT"];
    CatalogDS -> P2 [label="SQL RESULT"];

    P2 -> MemberDS [label="SQL SELECT"];
    MemberDS -> P2 [label="SQL RESULT"];

    P2 -> TransactionsDS [label="INSERT"];
    TransactionsDS -> P2 [label="SELECT"];

    P2 -> "Message Queue" [label="Publish\nBorrow Event"];

    P3 -> TransactionsDS [label="UPDATE"];
    TransactionsDS -> P3 [label="SELECT"];

    P3 -> MemberDS [label="UPDATE"];
    MemberDS -> P3 [label="SELECT"];

    P3 -> "Message Queue" [label="Publish\nReturn Event"];
}
Example 4: E-Commerce Order Processing (Logical DFD)
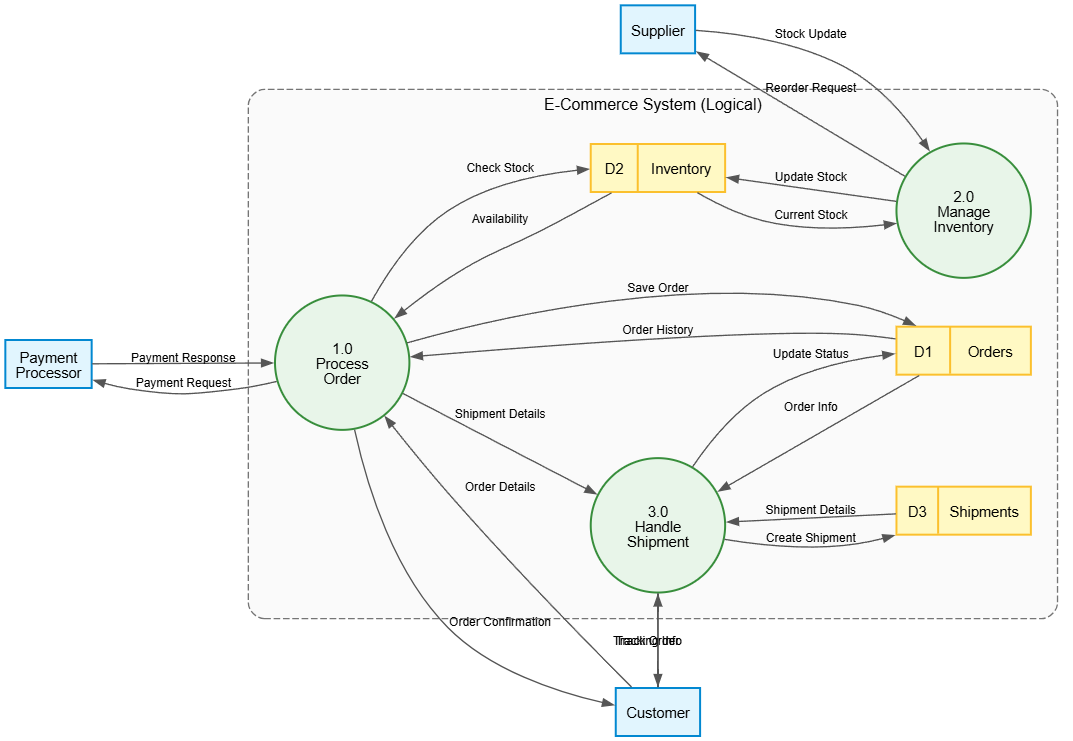
digraph ECommerce_Logical {
    // --- GRAPH STYLE ---
    graph [
        rankdir = LR
        splines = true
        nodesep = 0.5
        ranksep = 0.8
        fontname = "Helvetica,Arial,sans-serif"
        fontsize = 12
    ]

    // --- NODE STYLES ---
    node [
        fontname = "Helvetica,Arial,sans-serif"
        fontsize = 11
        penwidth = 1.5
    ]

    // External Entities
    node [shape = box, style = "filled", fillcolor = "#E1F5FE", color = "#0288D1"]
    Customer;
    Supplier;
    "Payment Processor" [label="Payment\nProcessor"];

    // --- SYSTEM BOUNDARY ---
    subgraph cluster_ECommerce {
        label = "E-Commerce System (Logical)";
        style = "dashed,rounded";
        color = "#757575";
        bgcolor = "#FAFAFA";
        margin = 20;

        // Processes
        node [shape = circle, style = "filled", fillcolor = "#E8F5E9", color = "#388E3C", width = 1.4]
        P1 [label="1.0\nProcess\nOrder"];
        P2 [label="2.0\nManage\nInventory"];
        P3 [label="3.0\nHandle\nShipment"];

        // Data Stores
        node [shape = record, style = "filled", fillcolor = "#FFF9C4", color = "#FBC02D"]
        OrderDS [label="{ <id> D1 | Orders }"];
        InventoryDS [label="{ <id> D2 | Inventory }"];
        ShipmentDS [label="{ <id> D3 | Shipments }"];
    }

    // --- EDGE STYLES ---
    edge [
        fontname = "Helvetica,Arial,sans-serif"
        fontsize = 9
        color = "#555555"
        arrowsize = 0.8
    ]

    // --- DATA FLOWS ---

    // Customer Interactions
    Customer -> P1 [label="Order Details"];
    P1 -> Customer [label="Order Confirmation"];

    Customer -> P3 [label="Track Order"];
    P3 -> Customer [label="Tracking Info"];

    // Payment Processor
    "Payment Processor" -> P1 [label="Payment Response"];
    P1 -> "Payment Processor" [label="Payment Request"];

    // Supplier
    Supplier -> P2 [label="Stock Update"];
    P2 -> Supplier [label="Reorder Request"];

    // Process Data Flows
    P1 -> OrderDS [label="Save Order"];
    OrderDS -> P1 [label="Order History"];

    P1 -> InventoryDS [label="Check Stock"];
    InventoryDS -> P1 [label="Availability"];

    P1 -> P3 [label="Shipment Details"];

    P2 -> InventoryDS [label="Update Stock"];
    InventoryDS -> P2 [label="Current Stock"];

    P3 -> OrderDS [label="Update Status"];
    OrderDS -> P3 [label="Order Info"];

    P3 -> ShipmentDS [label="Create Shipment"];
    ShipmentDS -> P3 [label="Shipment Details"];
}
6. Best Practices
For Logical DFDs
- Focus on business processes, not technology
- Use business terminology that stakeholders understand
- Keep processes at consistent abstraction levels
- Validate with business users for accuracy
- Show all major data flows between components
For Physical DFDs
- Include technology-specific details
- Consider performance and scalability
- Document system interfaces clearly
- Include error handling and recovery processes
- Align with actual system architecture
General Best Practices
- Start with a context diagram
- Number processes hierarchically
- Use meaningful names for all components
- Avoid crossing data flows
- Validate with stakeholders regularly
7. Common Pitfalls
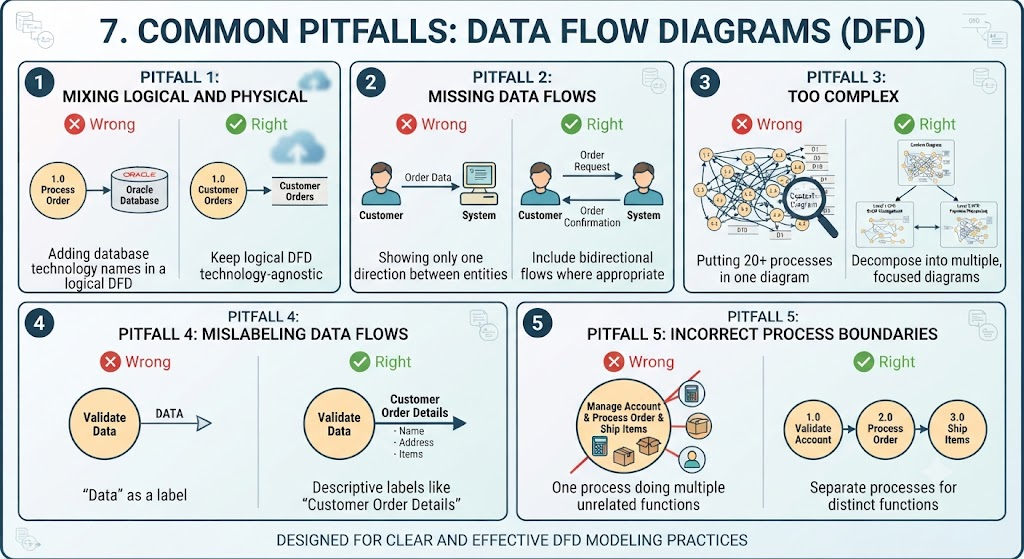
Pitfall 1: Mixing Logical and Physical
❌ Wrong: Adding database technology names in a logical DFD
✅ Right: Keep logical DFD technology-agnostic
Pitfall 2: Missing Data Flows
❌ Wrong: Showing only one direction between entities
✅ Right: Include bidirectional flows where appropriate
Pitfall 3: Too Complex
❌ Wrong: Putting 20+ processes in one diagram
✅ Right: Decompose into multiple, focused diagrams
Pitfall 4: Mislabeling Data Flows
❌ Wrong: “Data” as a label
✅ Right: Descriptive labels like “Customer Order Details”
Pitfall 5: Incorrect Process Boundaries
❌ Wrong: One process doing multiple unrelated functions
✅ Right: Separate processes for distinct functions
Conclusion
Data Flow Diagrams are essential tools for system analysis and design. Understanding the distinction between logical and physical DFDs helps you communicate effectively with different stakeholders at different stages of the software development lifecycle.
- Logical DFDs bridge business requirements and technical solutions
- Physical DFDs guide implementation and deployment decisions
Use the examples provided as templates for your own DFDs, adapting them to your specific system requirements while following the best practices outlined above.
Additional Resources
- AI Gane and Sarson DFD Generator by Visual Paradigm: Explains how Visual Paradigm’s AI tools can generate Gane-Sarson DFDs from text descriptions.
- A Step-by-Step Guide to Creating Data Flow Diagrams with Visual Paradigm: Provides a tutorial for creating DFDs with the Visual Paradigm online tool, from registration to sharing.
- How to Create Data Flow Diagram (DFD)?: A guide covering what a DFD is, its purpose, and the main types (Physical and Logical).
- Beginners Guide to SSADM DFD Diagrams with Visual Paradigm Online: An introductory guide to creating SSADM-style data flow diagrams using Visual Paradigm Online.
- Comprehensive Guide to Data Flow Diagrams (DFD): Demystifying Information Flow: An overview of DFDs, detailing their elements and why Visual Paradigm is a suitable tool for creating them.
- Mastering Data Flow Diagrams with Visual Paradigm: A Step-by-Step Guide: A practical guide that uses examples and templates to teach DFD creation, featuring case studies like online shopping systems.
- Understanding Logical DFD vs. Physical DFD: When and Why We Need Them: Explains the differences, purposes, and appropriate use cases for logical and physical data flow diagrams.
- Beginners Guide to Data Flow Diagrams (DFD) with Visual Paradigm Online: A beginner-friendly tutorial that walks through the steps of creating a DFD with Visual Paradigm Online.
- DFD Archives – Visual Paradigm Guides: A collection of articles on DFD topics including AI generators, validation, balancing, and levels.
- Getting Started Guide to Data Flow Diagrams (DFD) with Visual Paradigm Online: Details the step-by-step process of creating DFDs, including its key components and how to use templates.
- Draw DFD with the Best DFD tool: Discusses the graphic representation of data flow, details the logic vs. physical DFDs, and explores the benefits of each type.
-
Panduan Pemula untuk Diagram Aliran Data (DFD) dengan Visual Paradigm Online: An Indonesian-language beginner’s guide to DFDs, outlining components and the step-by-step creation process in Visual Paradigm Online.
This guide provides a foundation for creating effective DFDs. Remember that good diagrams evolve through iteration and stakeholder feedback.
This post is also available in Deutsch, Español and Français.