Introduction
Software architecture and business processes are often easier to understand visually than through prose or source code alone. However, traditional diagramming tools can make diagrams difficult to maintain: layouts require manual adjustment, changes are hard to review, and collaboration often depends on exchanging image files or proprietary project documents.
VPasCode, short for Visual Paradigm as Code, addresses these problems through a browser-based Diagram-as-Code workflow. Instead of manually placing shapes on a canvas, users describe diagrams with text-based languages such as PlantUML, Mermaid, and Graphviz. VPasCode then renders the source code as a visual diagram in real time. It combines a code editor, diagram renderer, AI assistance, sharing features, and export tools in one workspace.
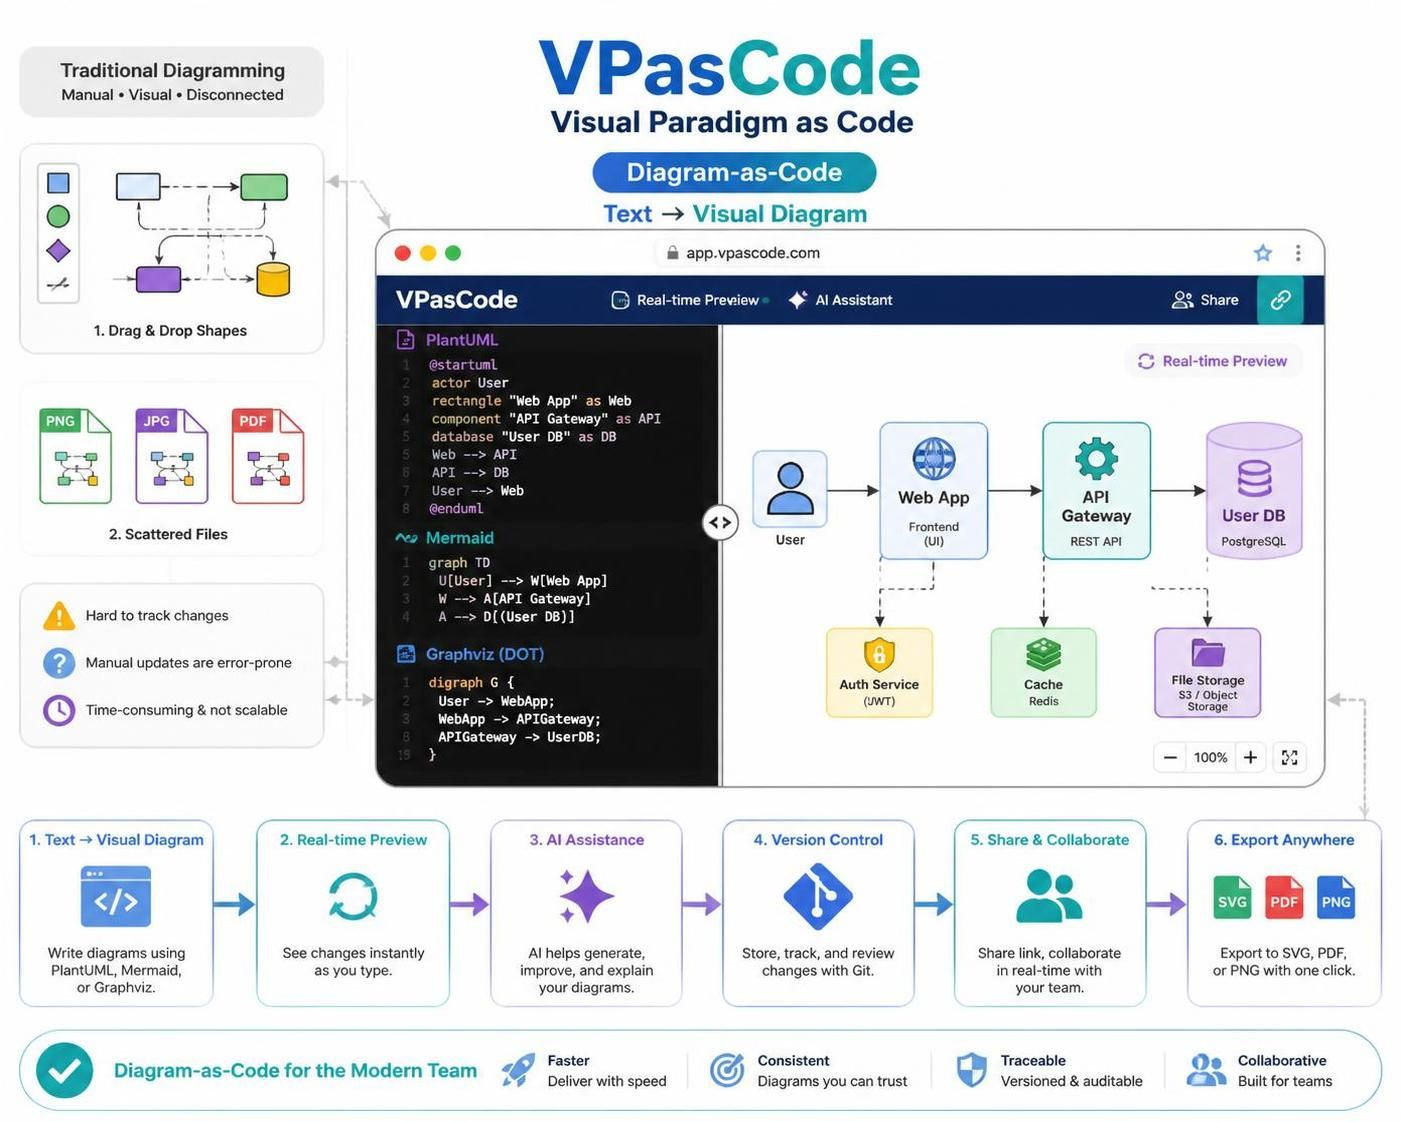
The result is a workflow that is closer to software development: diagrams can be authored as text, reviewed through code changes, stored in version control, regenerated when systems evolve, and reused across documentation.
What Is Diagram-as-Code?
Diagram-as-Code, or DaC, is the practice of defining a diagram with a textual language rather than drawing it manually.
A traditional workflow might involve:
-
Opening a diagramming application.
-
Dragging shapes onto a canvas.
-
Connecting the shapes manually.
-
Repositioning objects when the structure changes.
-
Exporting an image for documentation.
A Diagram-as-Code workflow replaces these steps with source code:
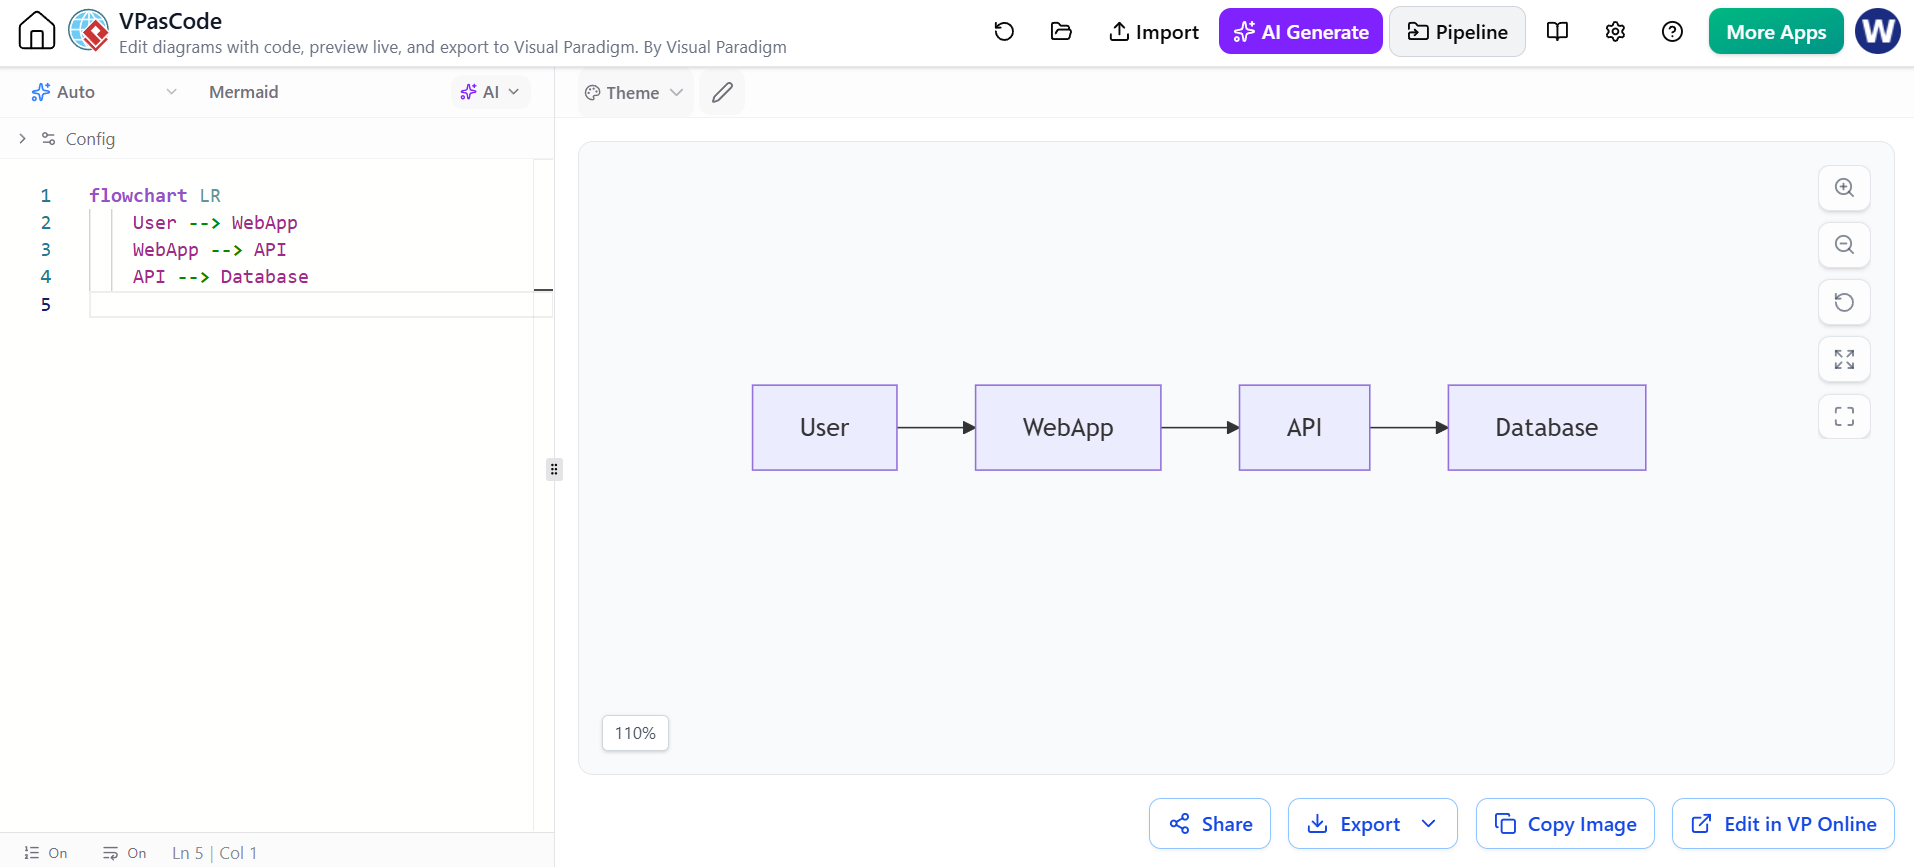
flowchart LR
    User --> WebApp
    WebApp --> API
    API --> Database
The renderer converts this definition into a visual flowchart. If the architecture changes, the author edits the text instead of manually rearranging every object.
This approach provides several practical benefits:
-
Version control: Diagram definitions can be stored in Git alongside application code and documentation.
-
Readable changes: Reviewers can inspect additions, removals, and relationship changes through normal diffs.
-
Repeatability: The same source can regenerate the diagram consistently.
-
Automation: Diagrams can become part of documentation or build pipelines.
-
Faster iteration: Structural changes usually require editing a few lines rather than manipulating many shapes.
VPasCode packages this workflow into a unified browser-based environment with live rendering and support for multiple diagramming standards.
The Role of VPasCode in Visual Paradigm
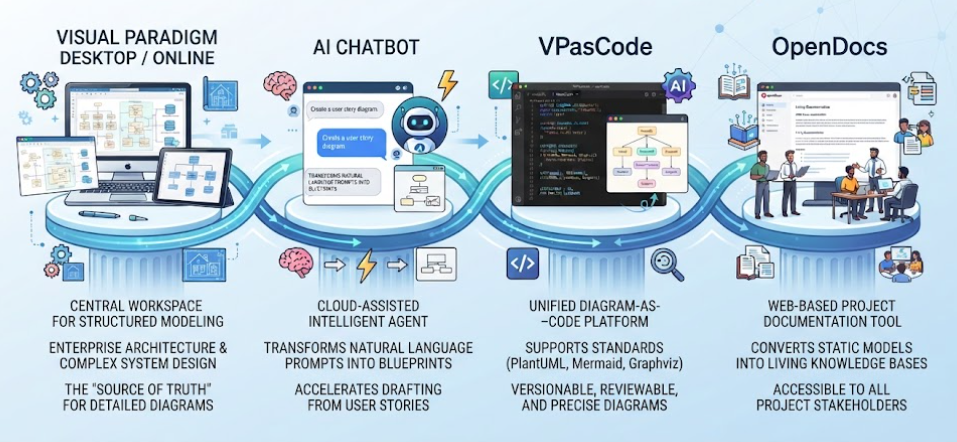
Visual Paradigm provides a broader ecosystem for software modeling, enterprise architecture, documentation, and visual analysis. VPasCode complements those tools by offering a lightweight, text-first entry point.
It is particularly useful when a team wants to:
-
Quickly sketch an architecture from a written description.
-
Keep diagrams close to source code and technical documentation.
-
Prototype a system before investing in a fully customized visual model.
-
Generate diagrams through AI and then refine the result manually.
-
Share a live diagram without sending large project files.
-
Export diagrams for reports, presentations, and wikis.
-
Move from a text-based diagram into Visual Paradigm’s wider modeling and documentation workflow.
The central idea is not that Diagram-as-Code replaces every visual modeling task. Rather, it gives teams a fast and maintainable way to create diagrams, while Visual Paradigm remains available for more detailed modeling, documentation, and presentation work.
Main Components of VPasCode
Browser-Based Code Editor
VPasCode runs in a web browser, removing the need for local installation or complex setup. Its editor is designed for diagram source code and includes features such as syntax highlighting, line numbers, indentation support, and real-time status feedback.
A typical workflow is:
-
Open the VPasCode editor.
-
Select or detect the diagram language.
-
Enter or paste diagram code.
-
Review the live-rendered result.
-
Correct syntax or refine the structure.
-
Share or export the finished diagram.
Live Preview Canvas
The preview panel displays the rendered diagram as the source is edited. This side-by-side workflow reduces the need to switch between an editor and a separate rendering tool.
A useful authoring pattern is to work in two passes:
-
Structural pass: Define nodes, actors, components, and relationships.
-
Presentation pass: Adjust direction, labels, grouping, themes, and visual styling.
This separation helps users focus first on correctness and then on readability.
Multiple Diagram Engines
VPasCode brings several text-to-diagram engines into one environment. Its primary supported formats include PlantUML, Mermaid, and Graphviz, with additional formats and capabilities available in the wider platform.
| Engine | Best suited for | Typical diagrams |
|---|---|---|
| PlantUML | Formal software and enterprise modeling | Class, sequence, component, deployment, use-case, C4, and ArchiMate diagrams |
| Mermaid | Lightweight documentation and developer workflows | Flowcharts, sequence diagrams, state diagrams, timelines, ER diagrams, and architecture diagrams |
| Graphviz | Graph relationships and hierarchical structures | Dependency graphs, network maps, organization charts, and directed or undirected graphs |
| D2 and other supported formats | Modern text-based visual modeling | Architecture, system relationships, and specialized visualizations where supported |
The best engine depends on the audience and the diagram’s purpose. PlantUML is often appropriate when formal UML or architecture notation matters. Mermaid is convenient for Markdown-based documentation. Graphviz is effective when the key problem is representing relationships and graph structure.
Key Concepts
Declarative Diagram Definition
In a declarative workflow, the author describes what the diagram contains and how its elements relate. The rendering engine determines much of the layout.
For example:
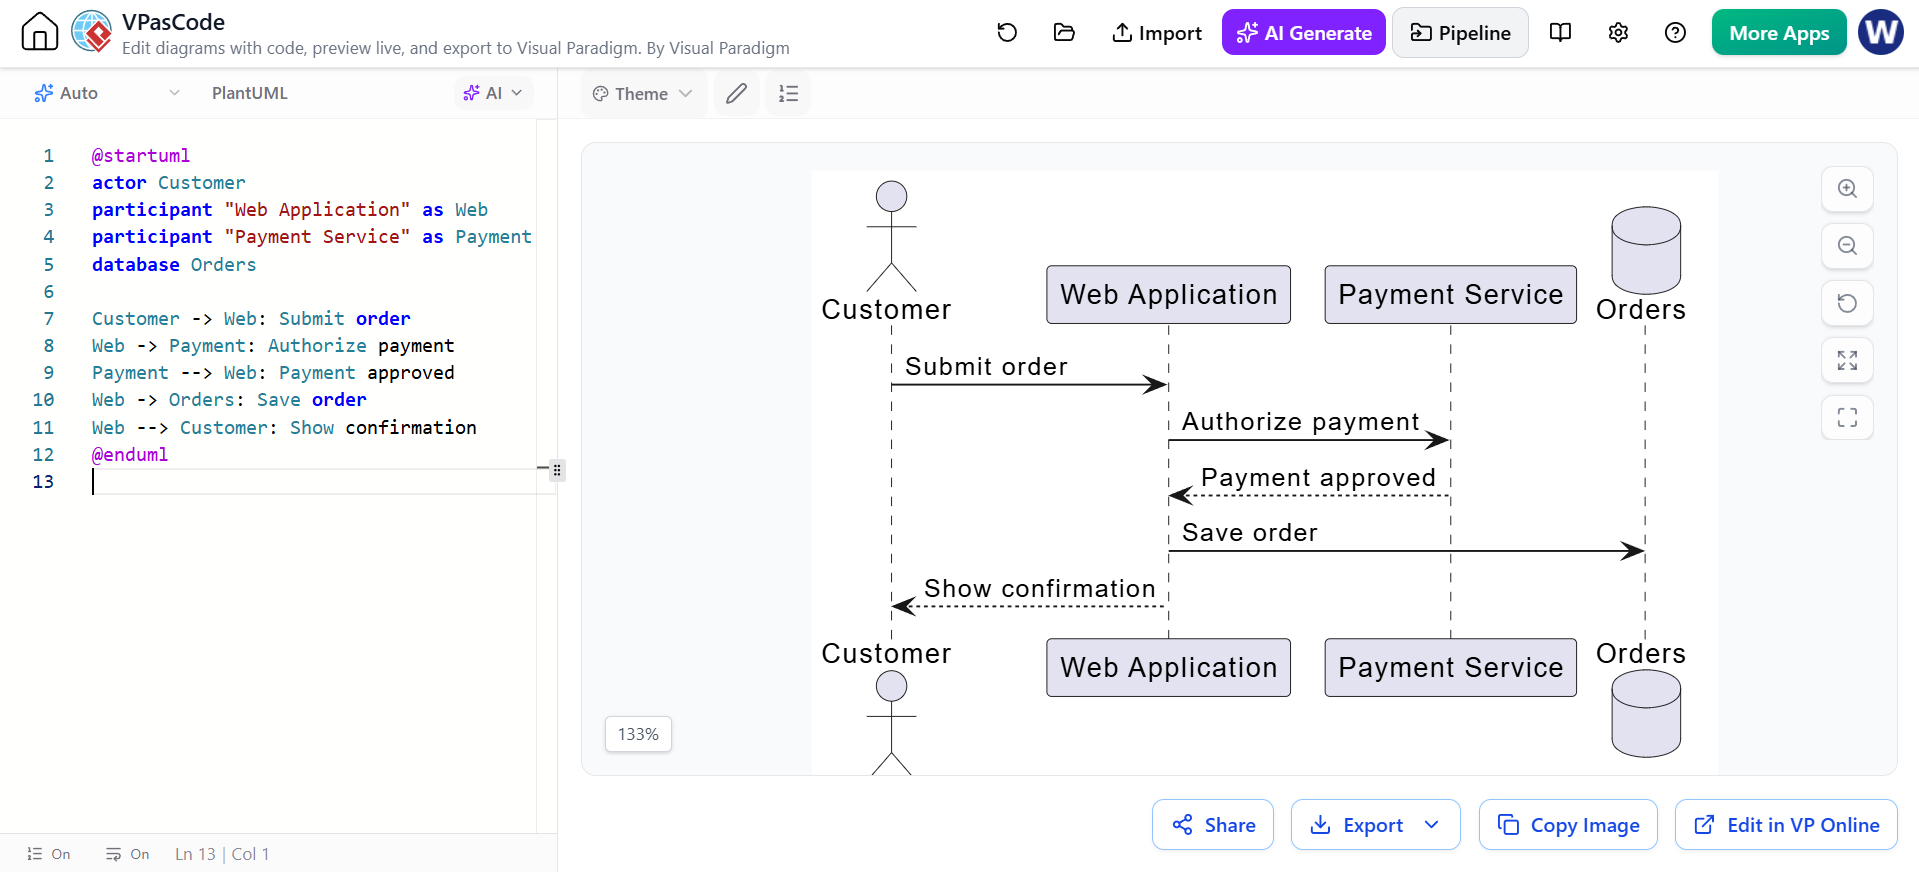
@startuml
actor Customer
participant "Web Application" as Web
participant "Payment Service" as Payment
database Orders

Customer -> Web: Submit order
Web -> Payment: Authorize payment
Payment --> Web: Payment approved
Web -> Orders: Save order
Web --> Customer: Show confirmation
@enduml
The code expresses participants and interactions without requiring the author to manually draw lifelines and arrows.
Source as the Single Source of Truth
The diagram source should be treated as the authoritative representation of the model. Exported PNG or PDF files are useful outputs, but they should not be the only copy of the diagram.
A recommended project structure might look like this:
architecture/
├── context/
│   └── system-context.puml
├── containers/
│   └── application-containers.mmd
├── deployment/
│   └── production-topology.dot
└── README.md
This makes it easier to update diagrams when the system changes.
Live Rendering
Live rendering means that the visual output updates as the source changes. This supports rapid feedback: missing relationships, malformed syntax, and unclear layouts become visible during authoring rather than after export.
Engine Selection
Different languages have different syntax, layout algorithms, and supported diagram types. Choosing an engine early prevents unnecessary rewriting later.
For example:
-
Use Mermaid for a concise service flow in a Markdown document.
-
Use PlantUML for a detailed C4 or UML model.
-
Use Graphviz for a large dependency network.
-
Use a specialized supported format when the diagram is primarily a mind map, data visualization, or other non-UML representation.
AI-Assisted Authoring
VPasCode includes AI-oriented features for generating diagram code from natural-language prompts, modifying existing diagrams, diagnosing syntax problems, and translating labels. Some advanced AI capabilities may depend on the Visual Paradigm edition or subscription being used.
AI is most effective when the prompt specifies:
-
The diagram type.
-
The intended notation or engine.
-
The system components.
-
The relationships between components.
-
The desired level of detail.
-
Any audience or formatting requirements.
For example:
Create a PlantUML C4 container diagram for an online bookstore. Include a customer, web application, catalog service, order service, payment provider, and PostgreSQL database. Show the main data flows and use clear system boundaries.
AI-generated code should still be reviewed for:
-
Incorrect relationships.
-
Missing components.
-
Ambiguous labels.
-
Unsupported syntax.
-
Security or architecture assumptions that were not stated in the prompt.
Versionable Visual Documentation
A text-based diagram can be reviewed similarly to source code. A change from:
to:
clearly communicates that a caching layer was introduced.
This makes diagrams more suitable for:
-
Pull requests.
-
Architecture decision records.
-
Release documentation.
-
Design reviews.
-
Compliance evidence.
-
Onboarding materials.
Examples with Visual Paradigm VPasCode
Example 1: Three-Tier Web Application
Mermaid is a practical choice for a straightforward architecture flow:
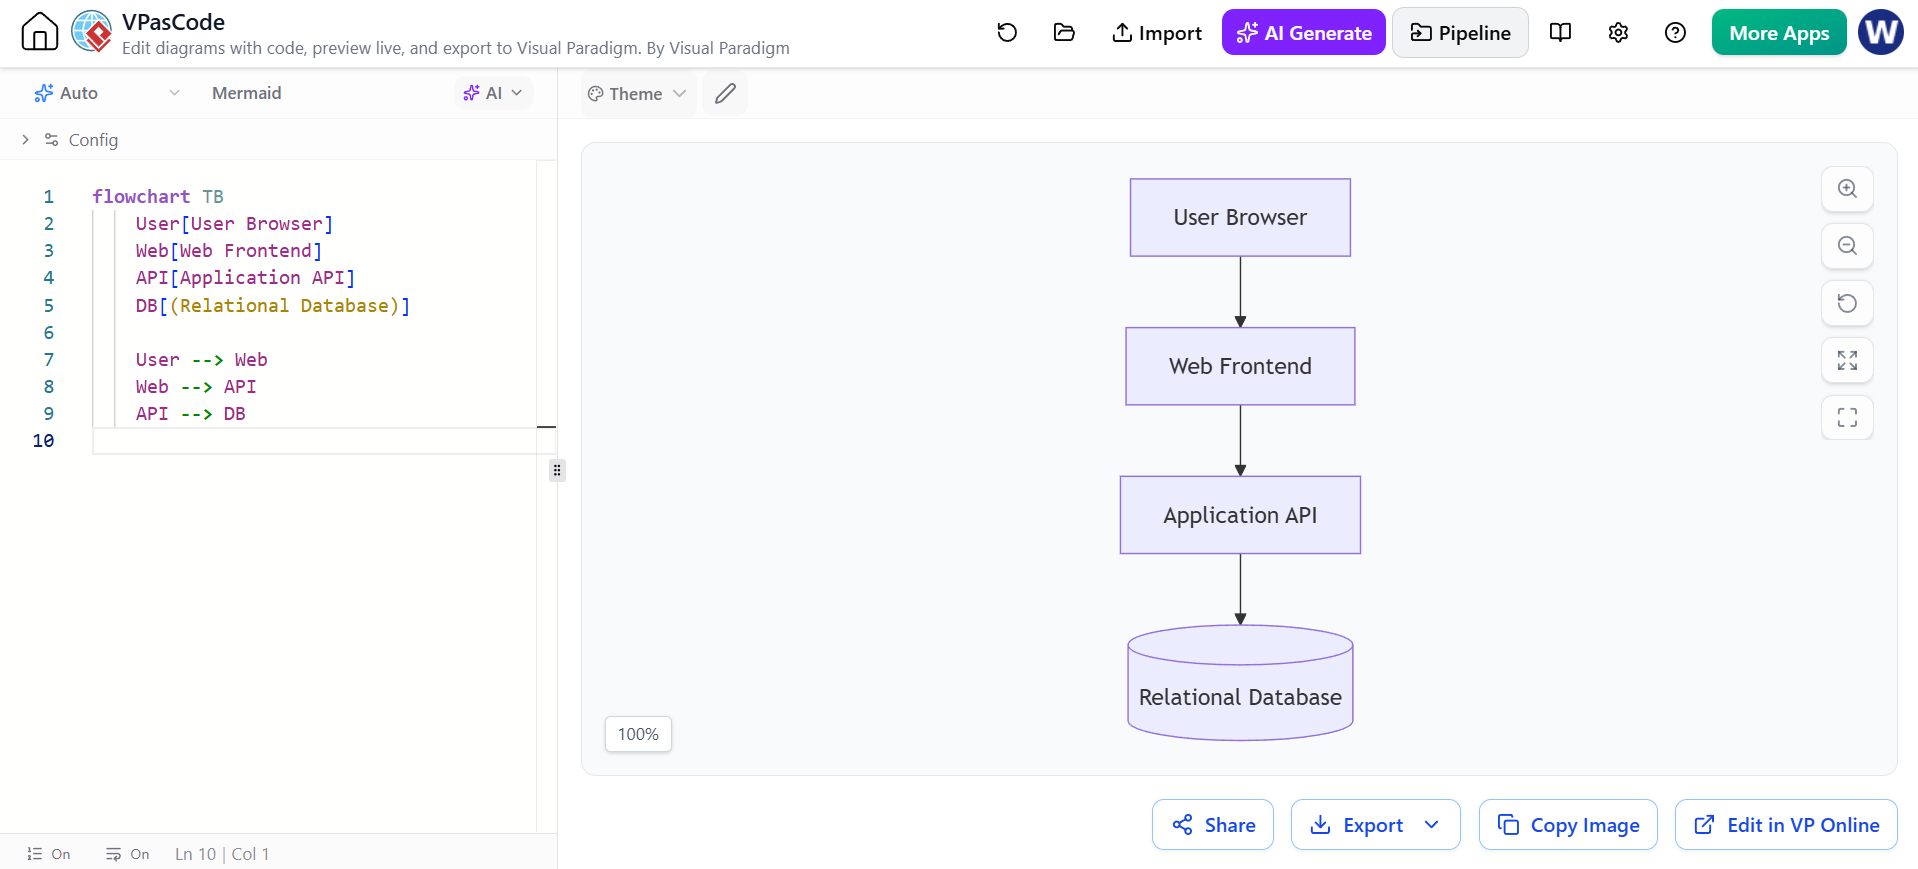
flowchart TB
    User[User Browser]
    Web[Web Frontend]
    API[Application API]
    DB[(Relational Database)]

    User --> Web
    Web --> API
    API --> DB
This diagram communicates the main layers without requiring detailed UML notation. It can be expanded later with authentication, caching, queues, or external services.
Example 2: Microservice Request Flow
A sequence diagram is useful when timing and interactions matter:
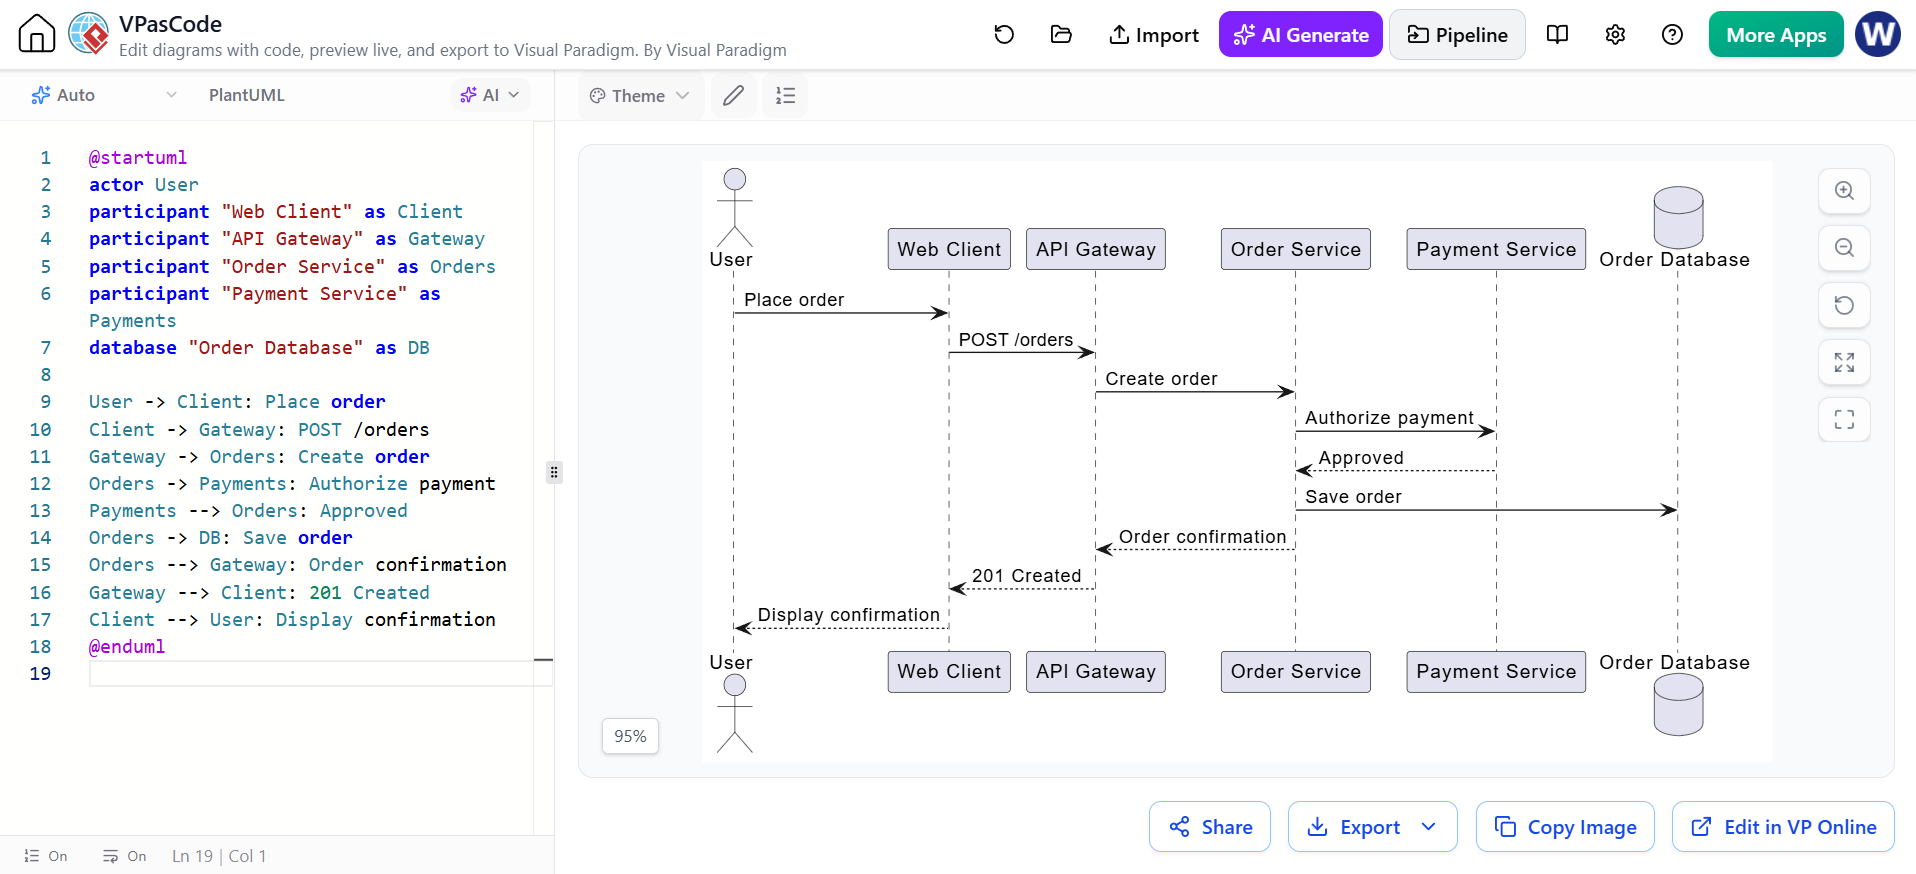
@startuml
actor User
participant "Web Client" as Client
participant "API Gateway" as Gateway
participant "Order Service" as Orders
participant "Payment Service" as Payments
database "Order Database" as DB

User -> Client: Place order
Client -> Gateway: POST /orders
Gateway -> Orders: Create order
Orders -> Payments: Authorize payment
Payments --> Orders: Approved
Orders -> DB: Save order
Orders --> Gateway: Order confirmation
Gateway --> Client: 201 Created
Client --> User: Display confirmation
@enduml
This example can help teams discuss API boundaries, synchronous calls, payment behavior, and persistence.
Example 3: System Context with PlantUML
PlantUML is well suited to high-level architecture and C4-style diagrams:
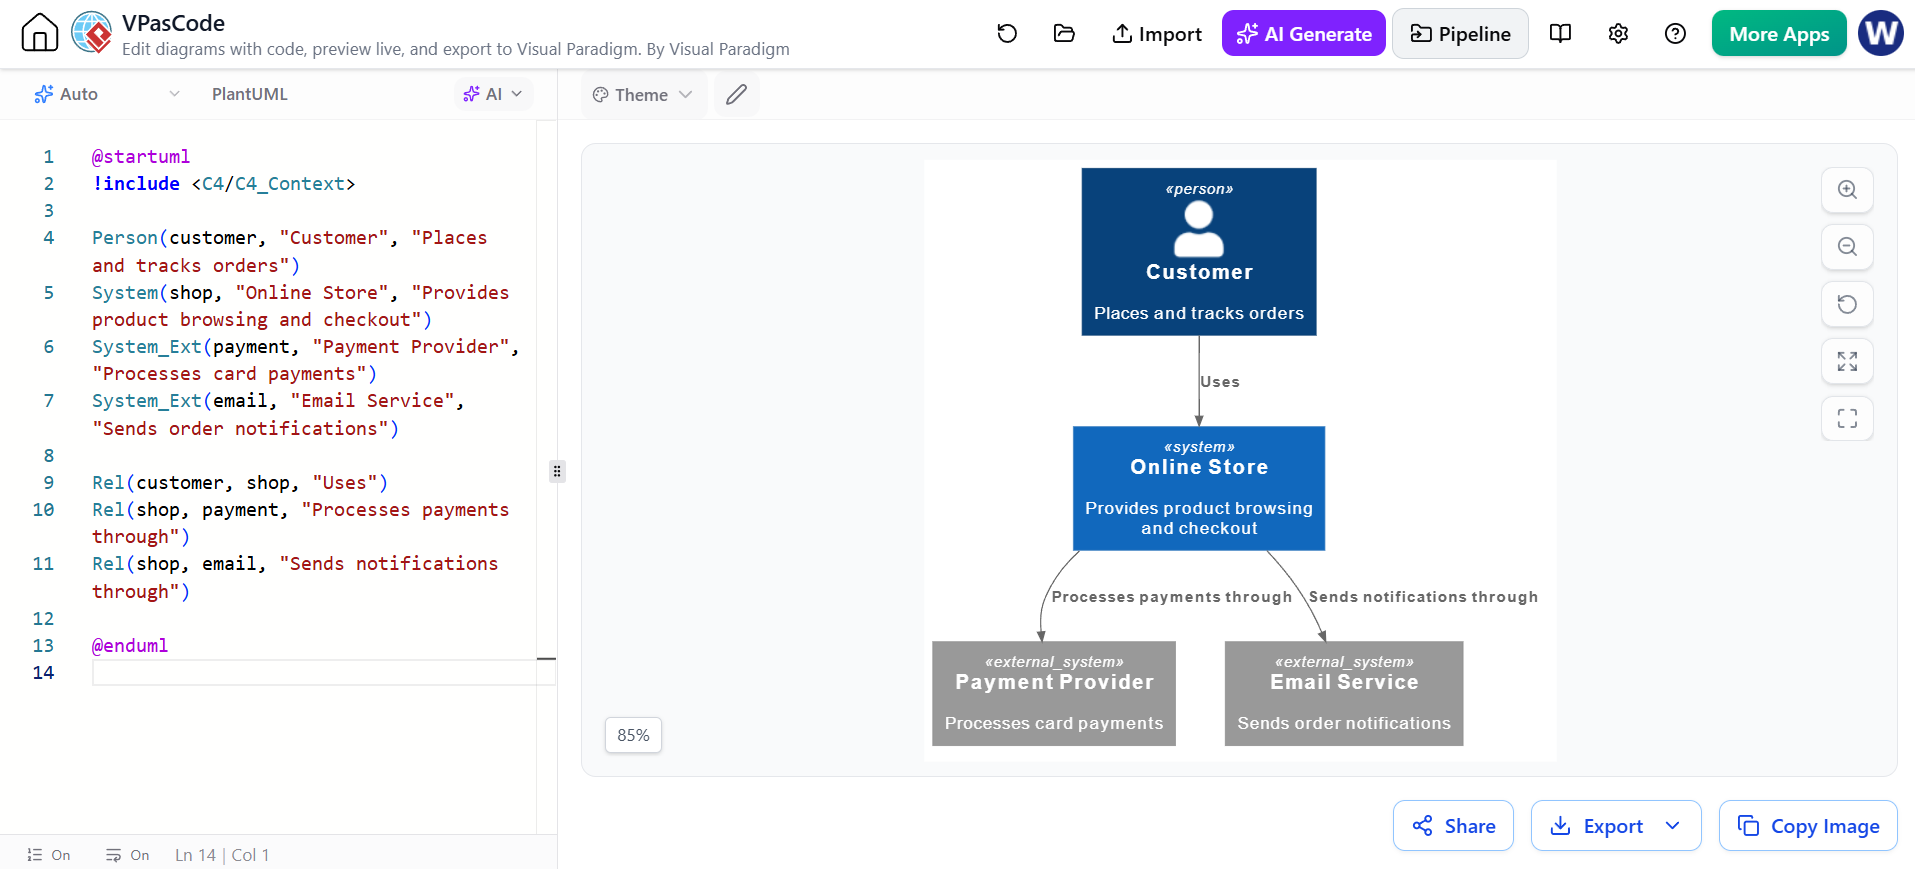
@startuml
!include <C4/C4_Context>

Person(customer, "Customer", "Places and tracks orders")
System(shop, "Online Store", "Provides product browsing and checkout")
System_Ext(payment, "Payment Provider", "Processes card payments")
System_Ext(email, "Email Service", "Sends order notifications")

Rel(customer, shop, "Uses")
Rel(shop, payment, "Processes payments through")
Rel(shop, email, "Sends notifications through")

@enduml
This diagram focuses on system boundaries and external relationships rather than implementation details.
Example 4: Dependency Graph with Graphviz
Graphviz is useful for showing dependencies:
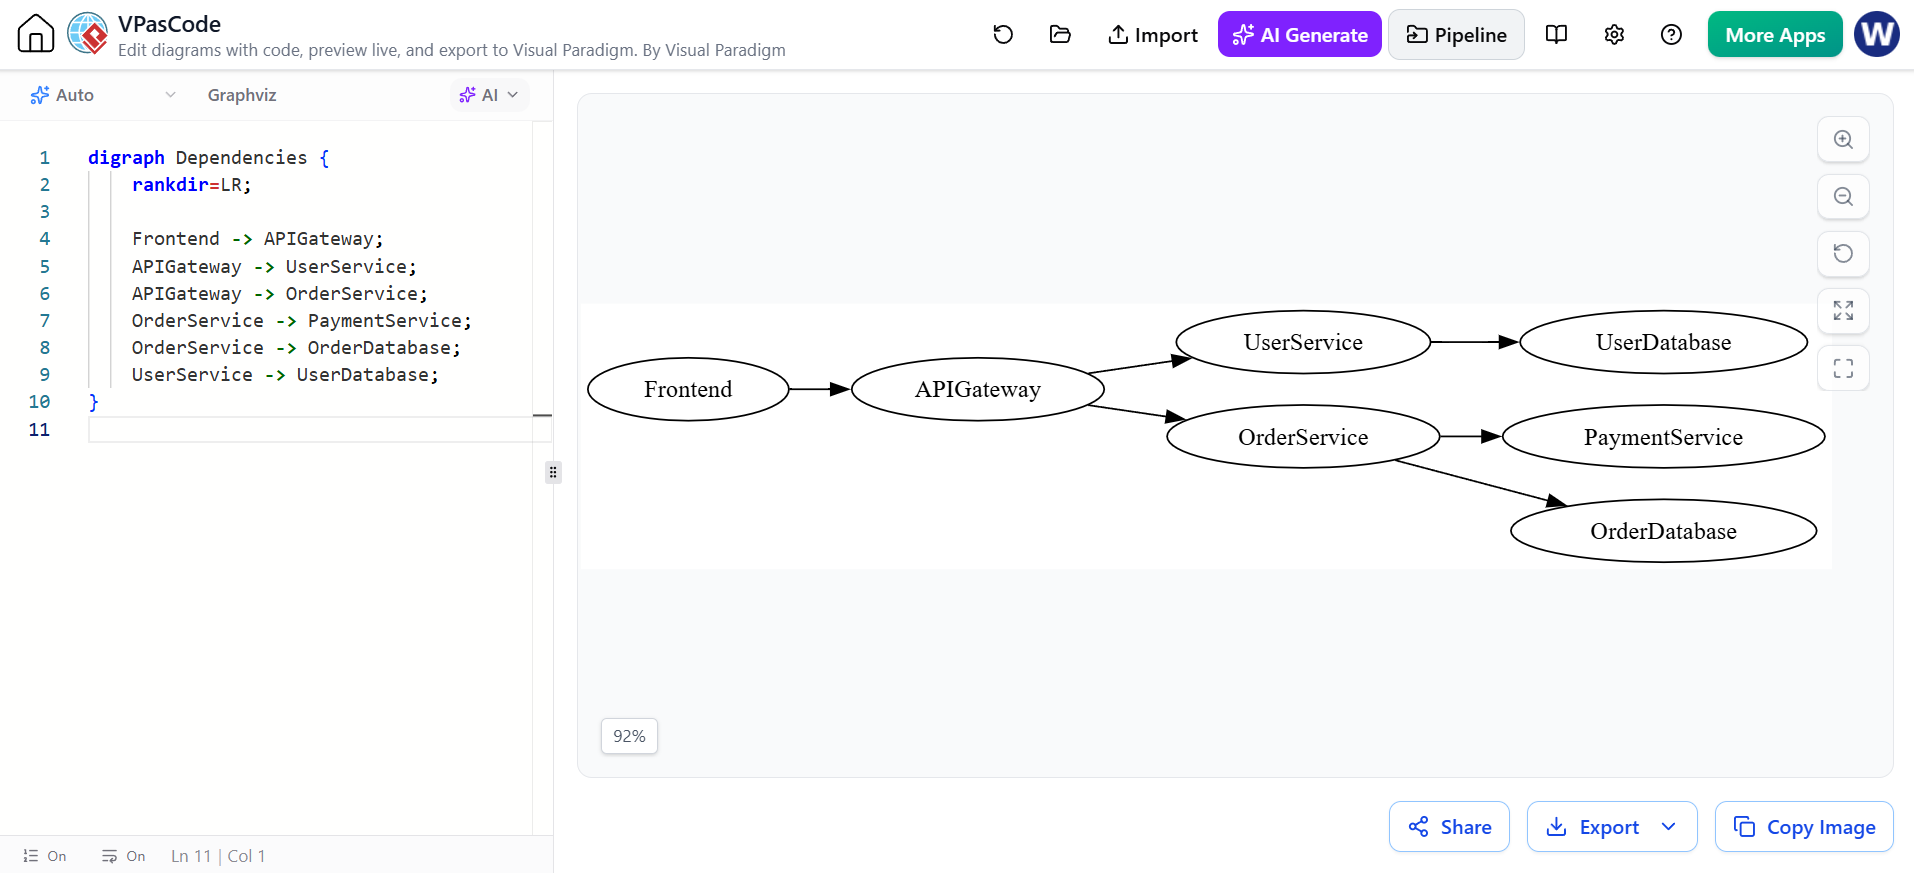
digraph Dependencies {
    rankdir=LR;

    Frontend -> APIGateway;
    APIGateway -> UserService;
    APIGateway -> OrderService;
    OrderService -> PaymentService;
    OrderService -> OrderDatabase;
    UserService -> UserDatabase;
}
For a large software system, this type of graph can reveal central services, dependency chains, and potential coupling problems.
Example 5: AI-Assisted Refinement
A team could begin with a natural-language request:
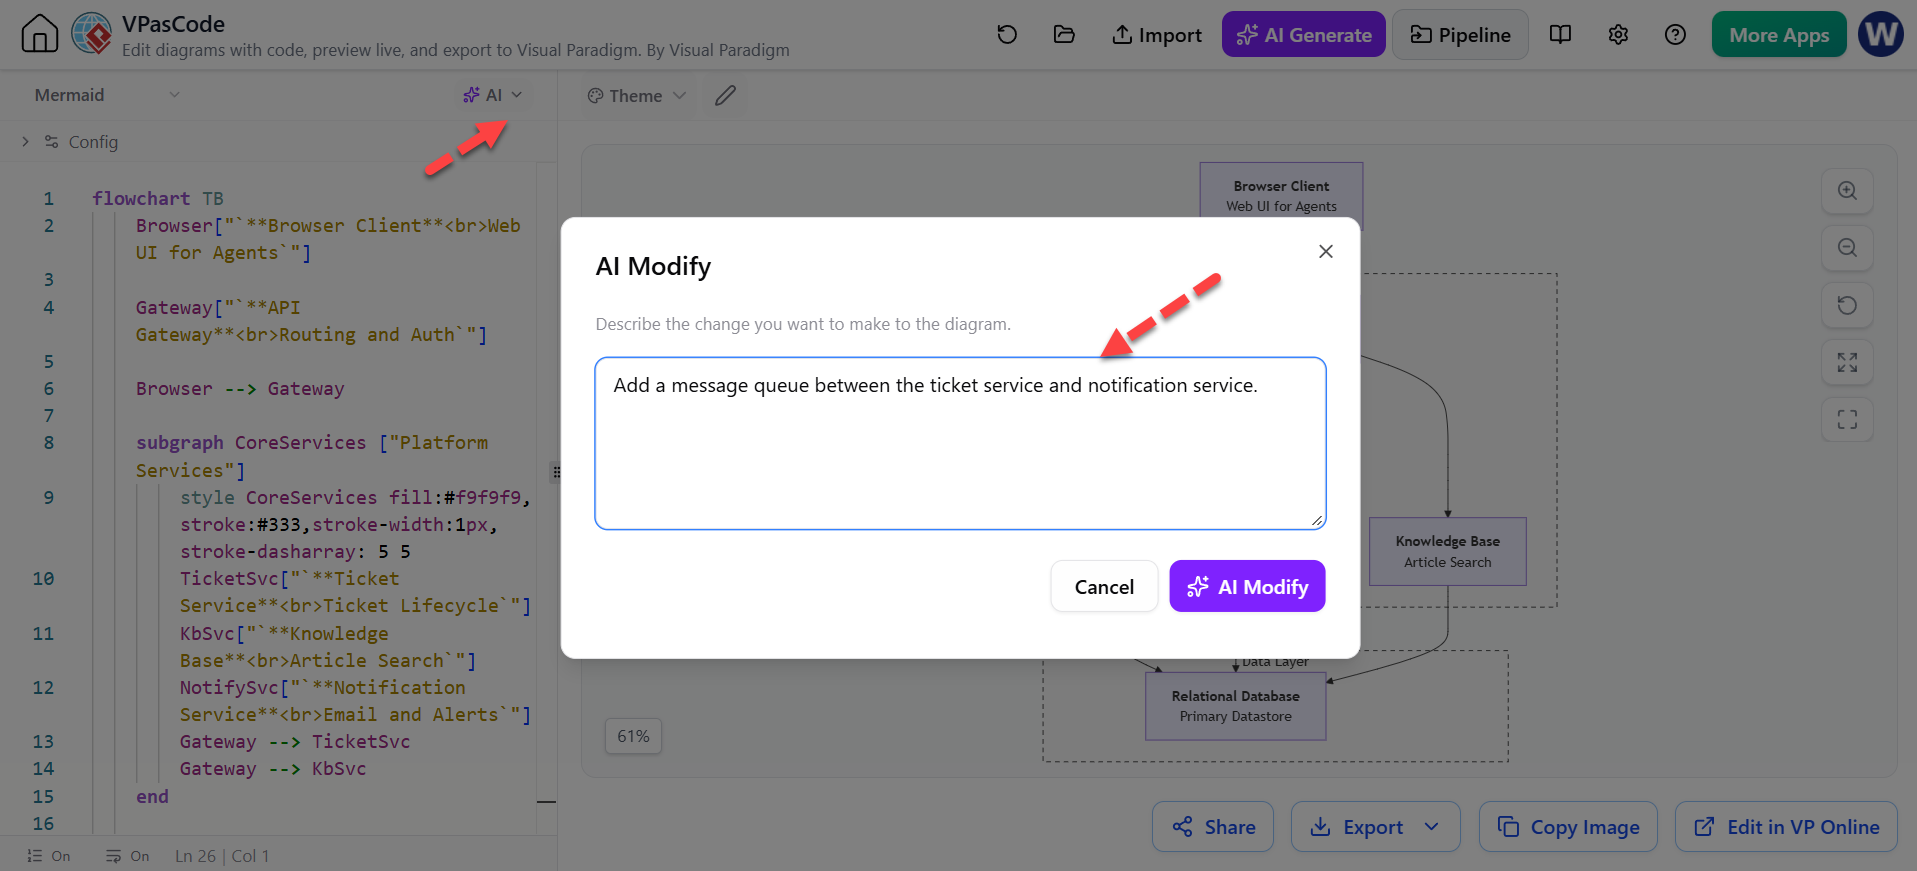
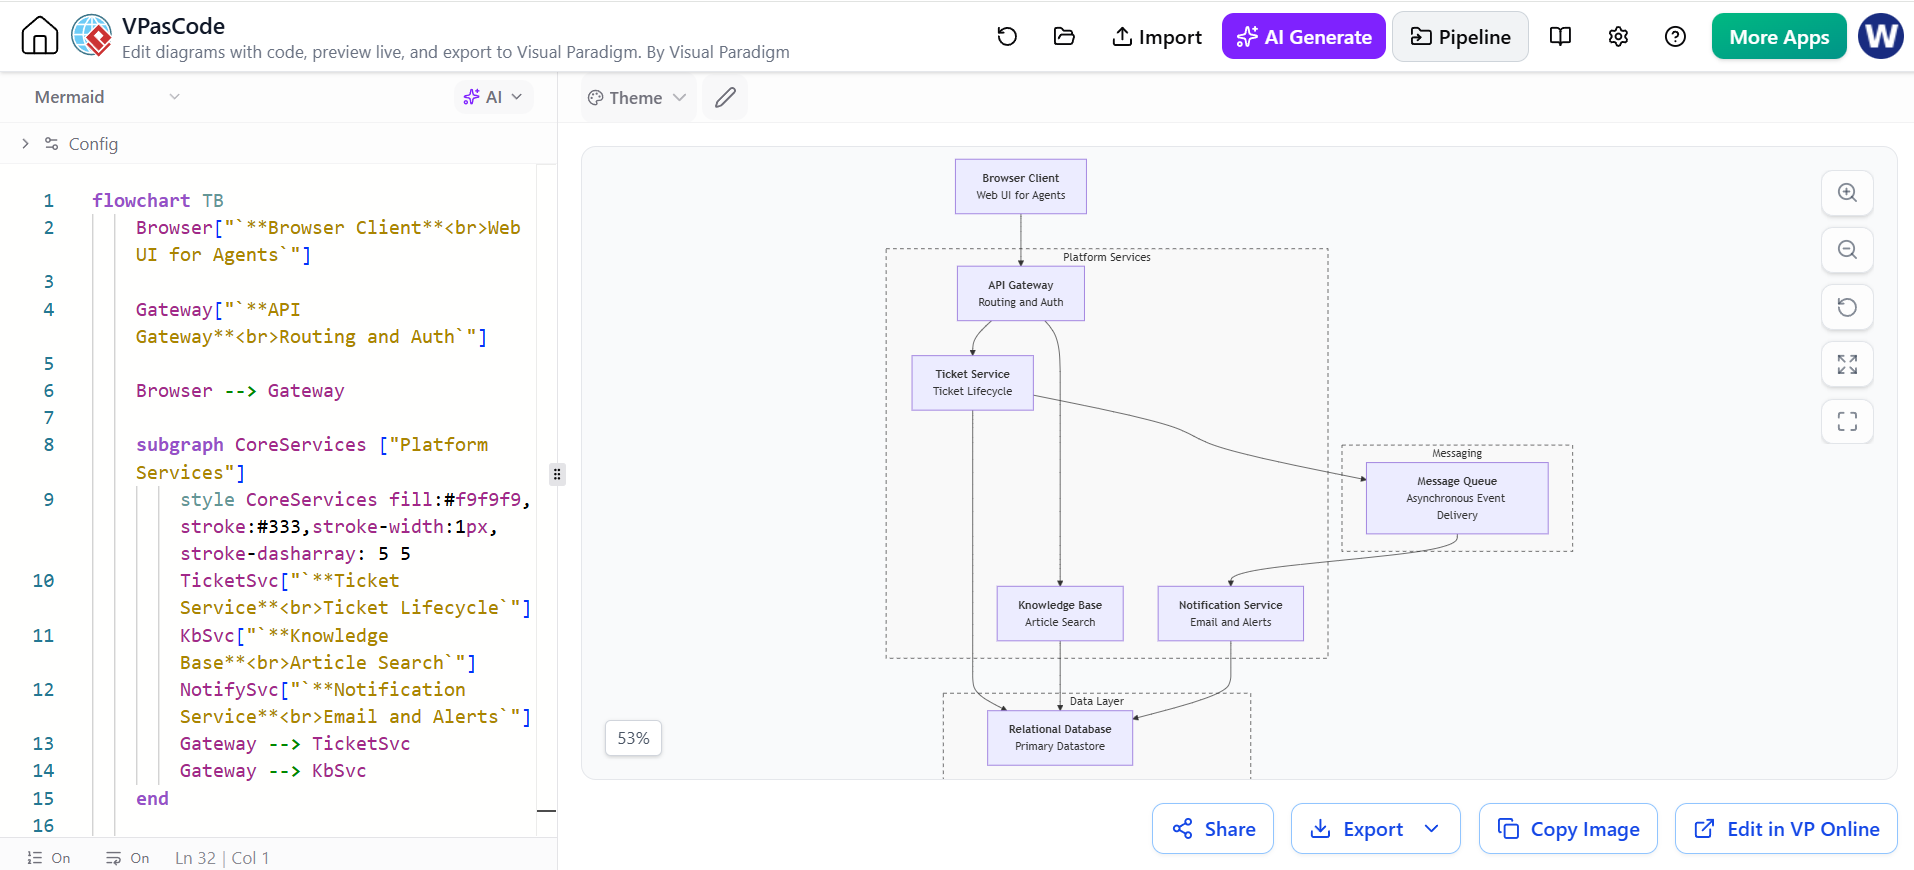
Generate a Mermaid architecture diagram for a customer support platform with a browser client, API gateway, ticket service, knowledge base, notification service, and relational database.
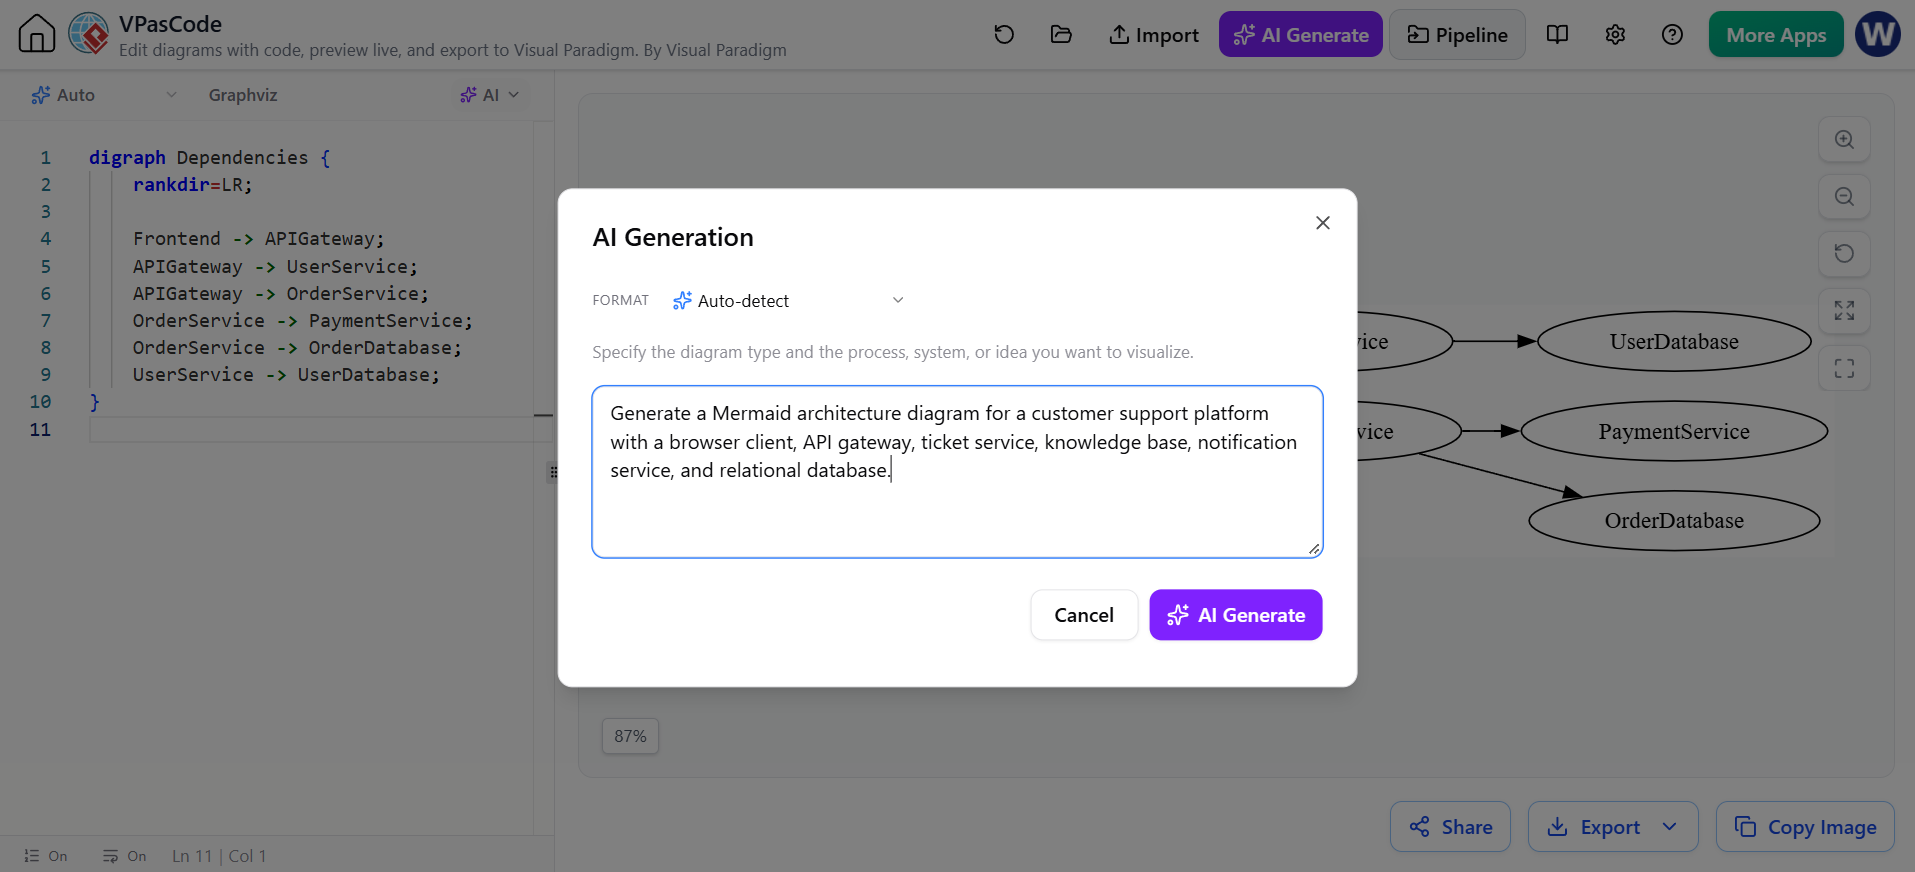
After generation, the author might ask the AI to:
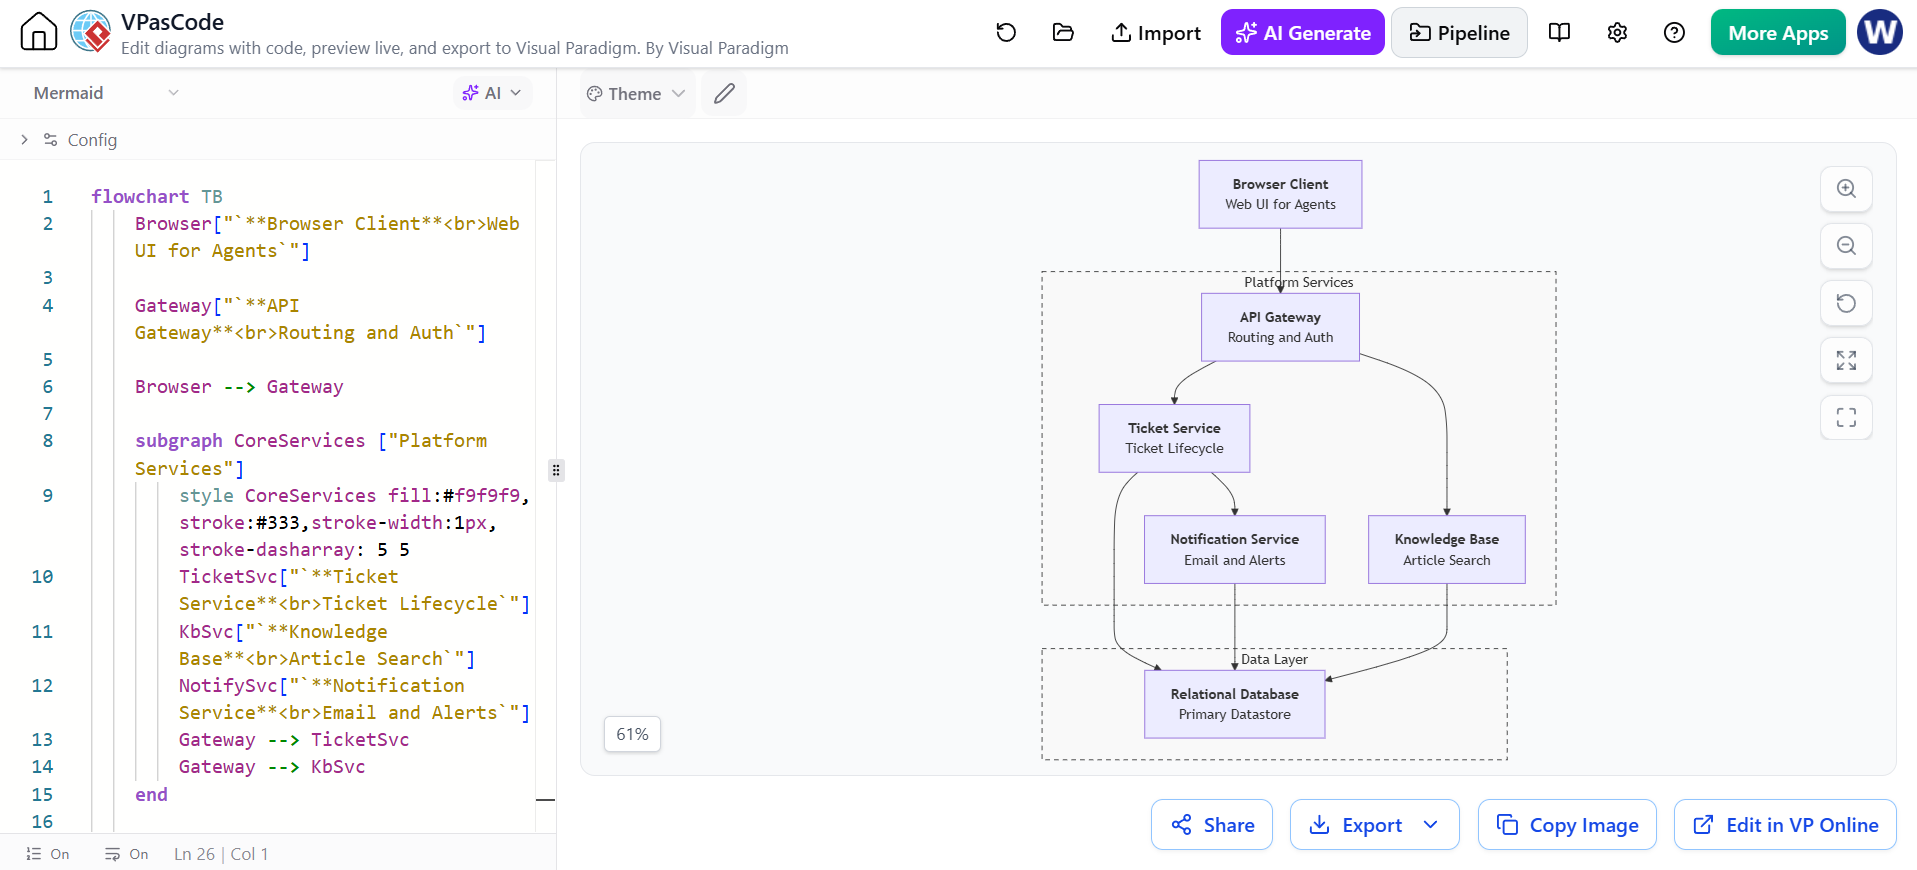
-
Add a message queue between the ticket service and notification service.
-
Group backend services inside a system boundary.
-
Rename labels for a nontechnical audience.
-
Convert the diagram from Mermaid to PlantUML.
-
Fix an error reported by the renderer.
The important principle is to treat AI as an accelerator for modeling, not as a substitute for architectural review.
A Recommended VPasCode Workflow
1. Define the Diagram’s Purpose
Before writing code, decide what question the diagram should answer.
Examples:
-
What systems interact with our product?
-
How does a user request move through the backend?
-
Which services depend on the database?
-
How is the application deployed?
-
What business steps are involved in approving an order?
A diagram with one clear purpose is usually easier to understand than a diagram that attempts to show the entire organization or system.
2. Choose the Diagram Engine
Select PlantUML, Mermaid, Graphviz, or another supported format based on the diagram’s purpose and audience.
For example:
-
Choose Mermaid for a diagram embedded in a Markdown repository.
-
Choose PlantUML for a formal UML or C4 model.
-
Choose Graphviz for dependency analysis.
-
Choose a specialized format when its notation better matches the subject.
3. Build the Smallest Useful Version
Start with the main actors, systems, and relationships. Avoid adding every implementation detail immediately.
For an architecture diagram, begin with:
-
Users.
-
Major applications.
-
Important external systems.
-
Primary databases.
-
Main communication paths.
Then add details only when they help answer the diagram’s intended question.
4. Render and Validate
Use the live preview to check:
-
Whether the syntax is valid.
-
Whether the diagram is readable.
-
Whether arrows point in the correct direction.
-
Whether labels are understandable.
-
Whether boundaries and groupings are accurate.
-
Whether the layout remains usable at normal zoom.
VPasCode provides syntax feedback and AI-assisted correction features for supported workflows.
5. Refine the Visual Language
Once the content is correct, improve presentation:
-
Use consistent names.
-
Group related elements.
-
Reduce crossing lines.
-
Use clear relationship labels.
-
Apply suitable themes or styling.
-
Keep the level of detail consistent.
The goal is not to add decoration. The goal is to reduce the reader’s effort.
6. Review the Diagram as a Team
Share the diagram with developers, architects, analysts, or stakeholders. Ask focused questions:
-
Is any major component missing?
-
Does the flow reflect actual behavior?
-
Are system boundaries correct?
-
Are any relationships misleading?
-
Can a new team member understand the diagram?
Because the source is text-based, proposed changes can be incorporated and reviewed more systematically.
7. Export or Connect to Documentation
When the diagram is ready, export it for use in reports, presentations, technical documents, or internal wikis. VPasCode supports image and vector-oriented outputs such as PNG, SVG, and PDF in its documented workflows. It also connects with Visual Paradigm documentation capabilities, including OpenDocs.
For long-term maintenance, preserve the original source code alongside the exported image.
Collaboration and Documentation Practices
Keep Diagrams Near the Systems They Describe
Store architecture diagrams with the relevant codebase or documentation repository. This increases the chance that diagrams will be updated when implementation changes.
Use Meaningful File Names
Prefer names such as:
checkout-sequence.puml
production-deployment.mmd
service-dependencies.dot
Avoid generic names such as diagram1 or final-version.
Separate Views by Audience
A single diagram rarely serves everyone equally well. Consider maintaining separate views:
-
Executive context view: Major systems and business capabilities.
-
Architecture view: Services, databases, and external dependencies.
-
Developer sequence view: Runtime interactions and API calls.
-
Operations view: Hosts, clusters, networks, and deployment targets.
-
Business-process view: Activities, decisions, and handoffs.
Each view can be generated from text while serving a different communication purpose.
Treat Labels as Documentation
Diagram labels should be concise but meaningful. “Service A” may be technically valid, but “Order Service” provides more useful context to reviewers and stakeholders.
Review Diagrams During Architecture Changes
A diagram should be updated when:
-
A major service is added or removed.
-
A database or external provider changes.
-
Communication becomes asynchronous.
-
A deployment topology changes.
-
A public API or business process changes.
This prevents the diagram from becoming an outdated illustration.
Benefits and Limitations
VPasCode is especially valuable for teams that already use Git, Markdown, continuous documentation, or infrastructure-as-code practices. Its text-first workflow makes diagrams easier to reproduce, review, and update.
It also reduces tool fragmentation by bringing multiple diagramming syntaxes into one browser-based editor. The ability to combine live previews, AI assistance, exports, and Visual Paradigm documentation workflows makes it useful across software engineering, enterprise architecture, and business analysis.
However, Diagram-as-Code is not automatically the best option for every situation. Text-based formats can have a learning curve, and some highly customized diagrams may require more manual visual control than a declarative engine provides. Large diagrams can also become difficult to maintain if the source is not organized into clear, focused views.
A practical strategy is to use VPasCode for rapid, maintainable, and version-controlled diagram creation, then use other Visual Paradigm capabilities when deeper modeling, customization, or documentation management is required.
Conclusion
VPasCode brings software development principles to visual modeling. By defining diagrams with text, teams can create architecture views, process models, sequence diagrams, dependency graphs, and documentation visuals that are easier to version, review, regenerate, and share.
Its support for PlantUML, Mermaid, Graphviz, and other formats allows users to select the notation that best fits each problem. Live rendering shortens the feedback loop, while AI features can accelerate initial generation, syntax correction, modification, and translation. Integration with the wider Visual Paradigm ecosystem provides a path from quick text-based sketches to richer modeling and documentation workflows.
The most effective way to use VPasCode is to treat diagrams as maintained project assets rather than disposable images: define a clear purpose, choose the appropriate engine, keep the source under version control, review changes with the team, and regenerate exports whenever the system evolves.
In that role, VPasCode is more than a diagram editor. It is a bridge between source code, AI-assisted design, collaborative architecture review, and professional visual modeling.