
Introduction
In the high-stakes world of software engineering, critical incidents are inevitable. Whether it’s a sudden spike in server latency, a broken build pipeline, or an API timeout affecting thousands of users, the immediate response often devolves into frantic firefighting. While quick fixes restore service temporarily, they rarely address the underlying issues. To prevent recurrence, teams must transition from reactive troubleshooting to structured Root Cause Analysis (RCA).
Traditionally, creating visual aids for RCA—such as Ishikawa (Fishbone) diagrams—has been a manual, time-consuming process. Engineers waste precious minutes during post-mortems wrestling with canvas alignment, drawing lines, and formatting text boxes. This friction slows down the analytical process when speed and clarity are most needed.
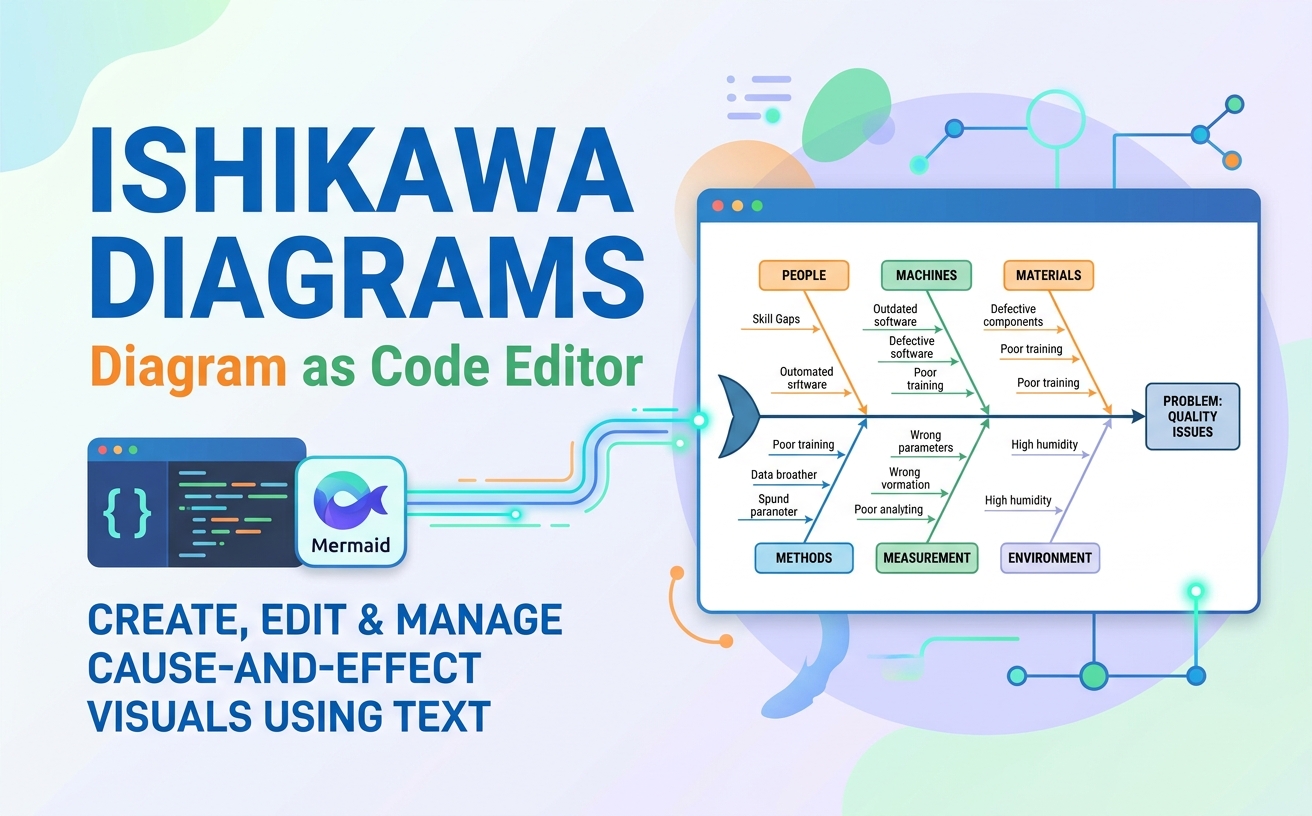
Enter VPasCode, Visual Paradigm’s diagram-as-code environment, now enhanced with an AI-driven Ishikawa Diagram Generator. By combining the precision of Mermaid.js syntax with the intuitive power of natural language prompts, VPasCode allows teams to generate, refine, and export comprehensive cause-and-effect models instantly. This guide explores how to leverage this new capability to streamline your incident reviews and improve system reliability.
Key Concepts: The Ishikawa Diagram in Modern Engineering
What is an Ishikawa Diagram?
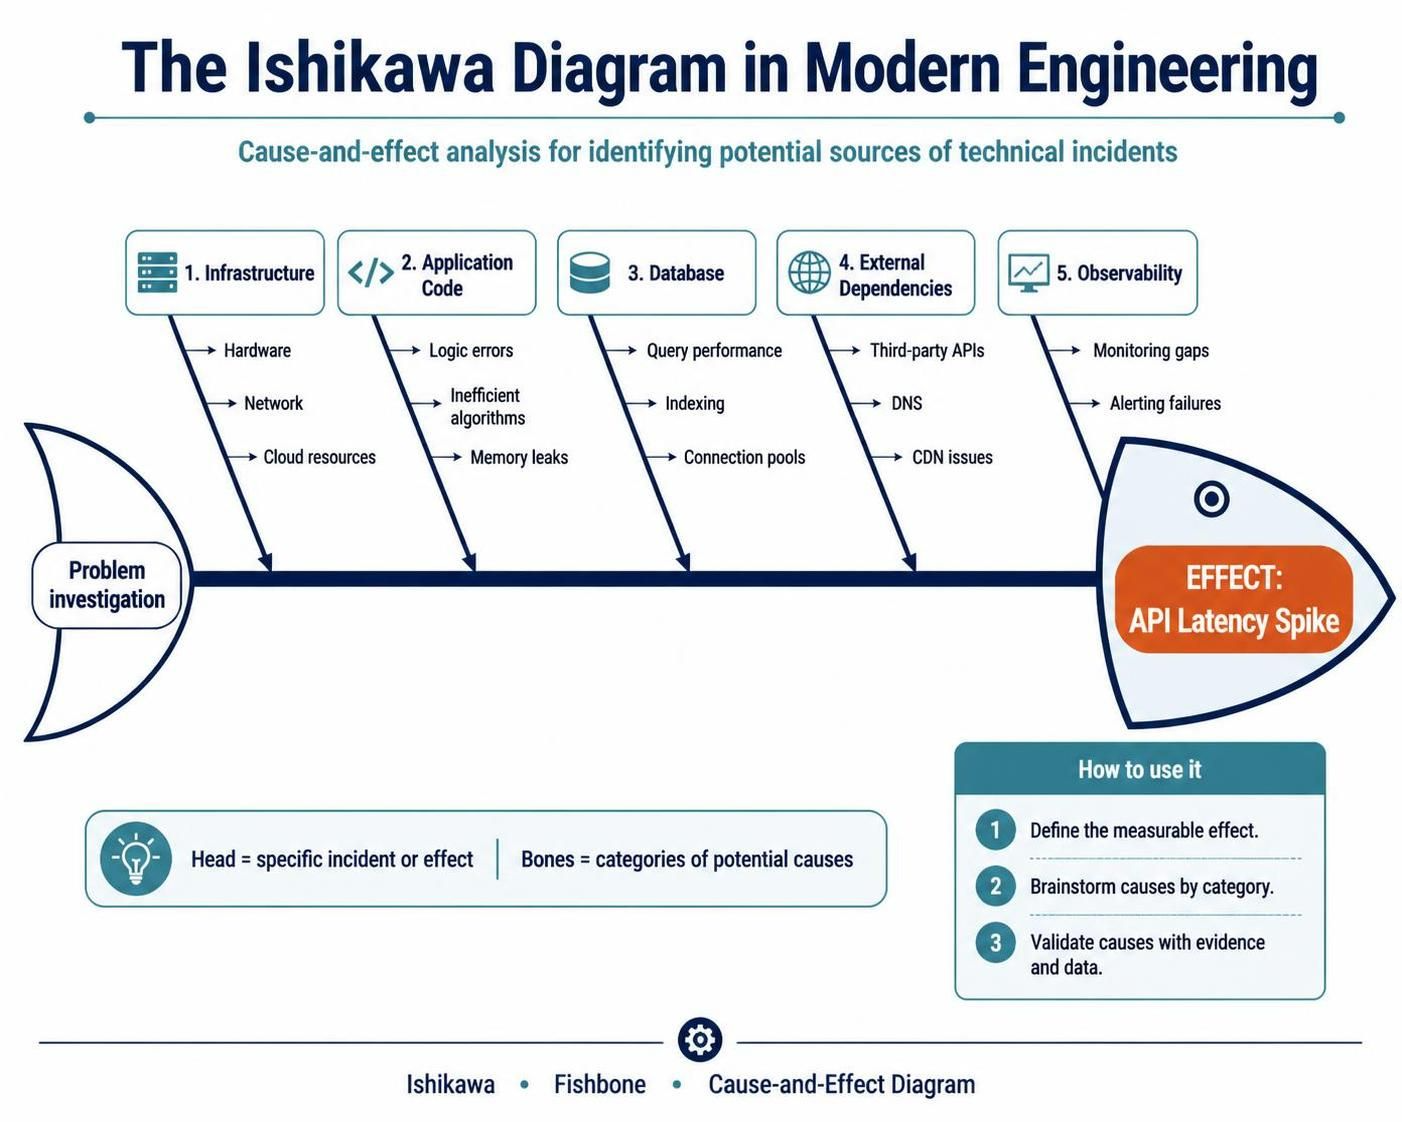
Also known as a Fishbone Diagram or Cause-and-Effect Diagram, the Ishikawa model was developed by Kaoru Ishikawa to help identify potential causes of a problem. In software engineering, the “head” of the fish represents the specific incident or effect (e.g., “API Latency Spike”), while the “bones” represent major categories of causes, such as:
-
Infrastructure: Hardware, network, cloud resources.
-
Application Code: Logic errors, inefficient algorithms, memory leaks.
-
Database: Query performance, indexing, connection pools.
-
External Dependencies: Third-party APIs, DNS, CDN issues.
-
Observability: Monitoring gaps, alerting failures.
Why Diagram-as-Code?
Traditional drag-and-drop diagramming tools create static images that are difficult to version control or update. Diagram-as-Code treats diagrams as source code. Using lightweight syntax like Mermaid.js, you can:
-
Version Control: Store diagrams in Git alongside your application code.
-
Collaborate: Review diagram changes via pull requests.
-
Automate: Generate diagrams dynamically from logs or metrics.
VPasCode bridges the gap between raw syntax and visual output, allowing you to write simple text that renders into professional-grade diagrams.
Getting Started: From Prompt to Diagram
The core innovation in VPasCode is the ability to bypass complex syntax learning curves. Instead of manually defining every node and edge, you can use plain English to describe your problem.
Step 1: Define the Problem
Start by identifying the central issue. This becomes the head of your fishbone.
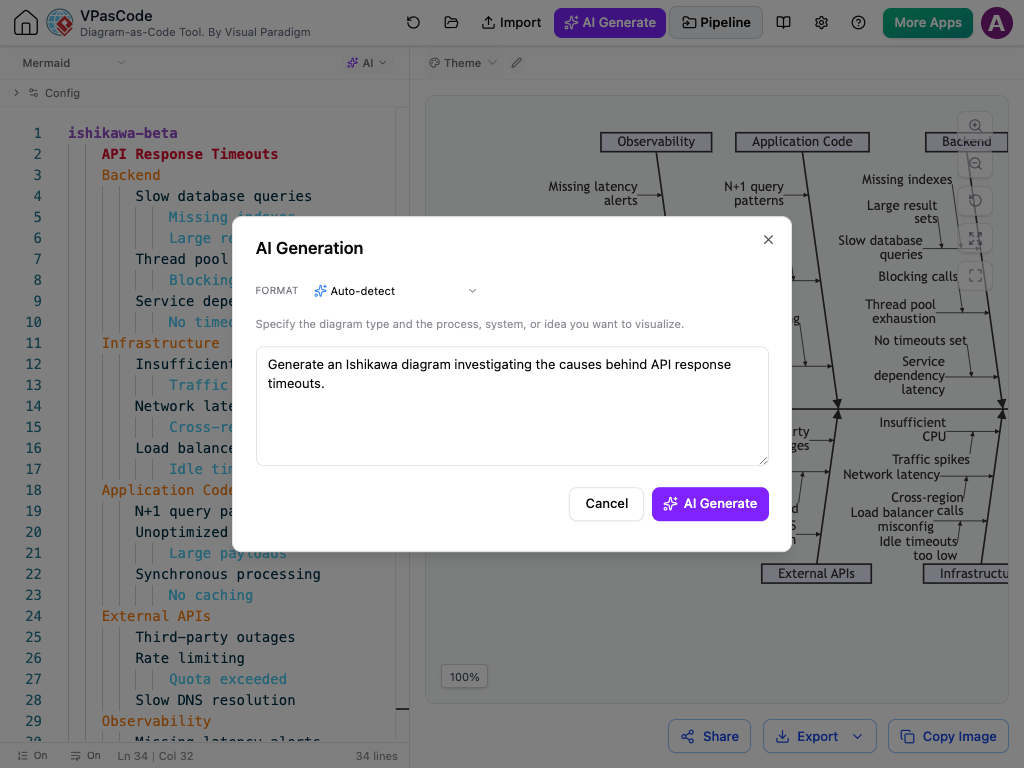
Prompt: "Generate an Ishikawa diagram investigating the causes behind API response timeouts."
Step 2: AI Generation
VPasCode’s AI engine analyzes the prompt, identifies relevant operational vectors, and structures them into primary categories and sub-causes. Within seconds, you receive a complete Mermaid script.
Step 3: Review and Refine
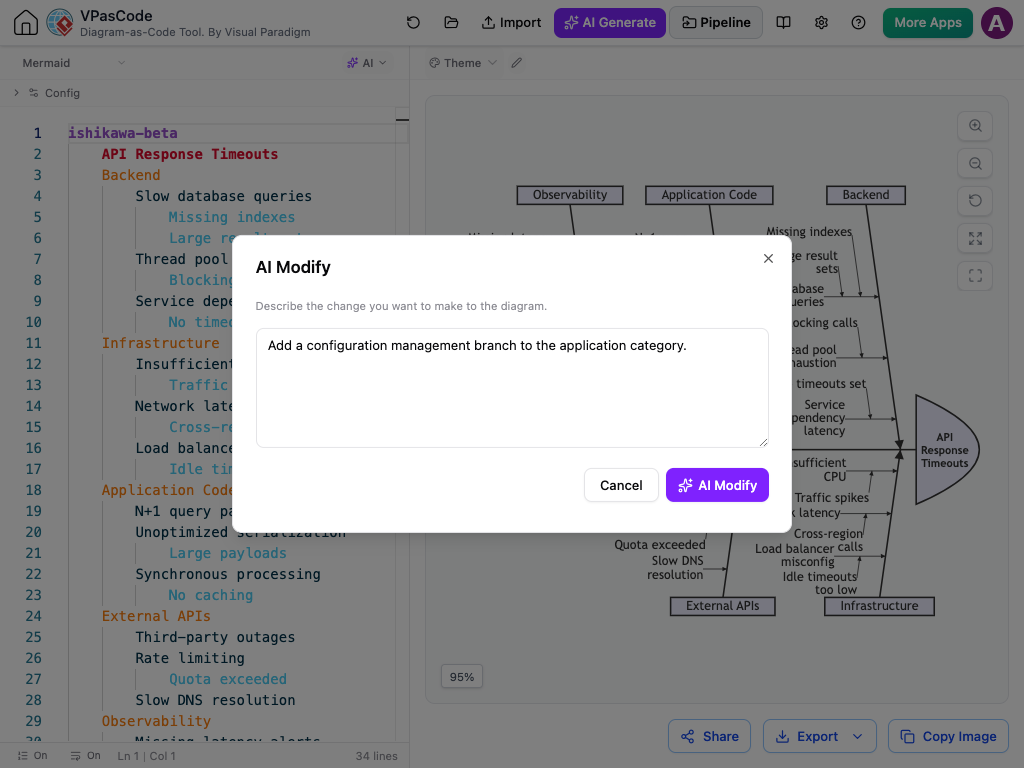
The initial output provides a solid foundation, but real-world incidents are nuanced. You can refine the diagram through conversational prompts.
-
Expand Categories: “Add a configuration management branch to the application category.”
-
Drill Into Sub-causes: “Break down the database category into connection pool limits and slow query locks.”
-
Reorganize Factors: “Move memory leak checks from infrastructure to application code.”
The AI updates the underlying Mermaid structure and re-renders the diagram instantly, allowing your team to analyze root causes at the speed of conversation.
Practical Example: Analyzing API Response Timeouts
Below is a real-world example of an Ishikawa diagram generated for API latency issues. Notice how the causes are categorized logically, making it easier for cross-functional teams (DevOps, Backend, DBA) to identify their respective areas of ownership.
The Mermaid Syntax
VPasCode uses specialized Mermaid script structures for Ishikawa diagrams. Here is the code generated for our example:
ishikawa-beta
    API Response Timeouts
    Backend
        Slow database queries
            Missing indexes
            Large result sets
        Thread pool exhaustion
            Blocking calls
        Service dependency latency
            No timeouts set
    Infrastructure
        Insufficient CPU
            Traffic spikes
        Network latency
            Cross-region calls
        Load balancer misconfig
            Idle timeouts too low
    Application Code
        N+1 query patterns
        Unoptimized serialization
            Large payloads
        Synchronous processing
            No caching
    External APIs
        Third-party outages
        Rate limiting
            Quota exceeded
        Slow DNS resolution
    Observability
        Missing latency alerts
        Incomplete tracing
            No span metrics
        Unclear timeout config
            Inconsistent values
The Visual Output
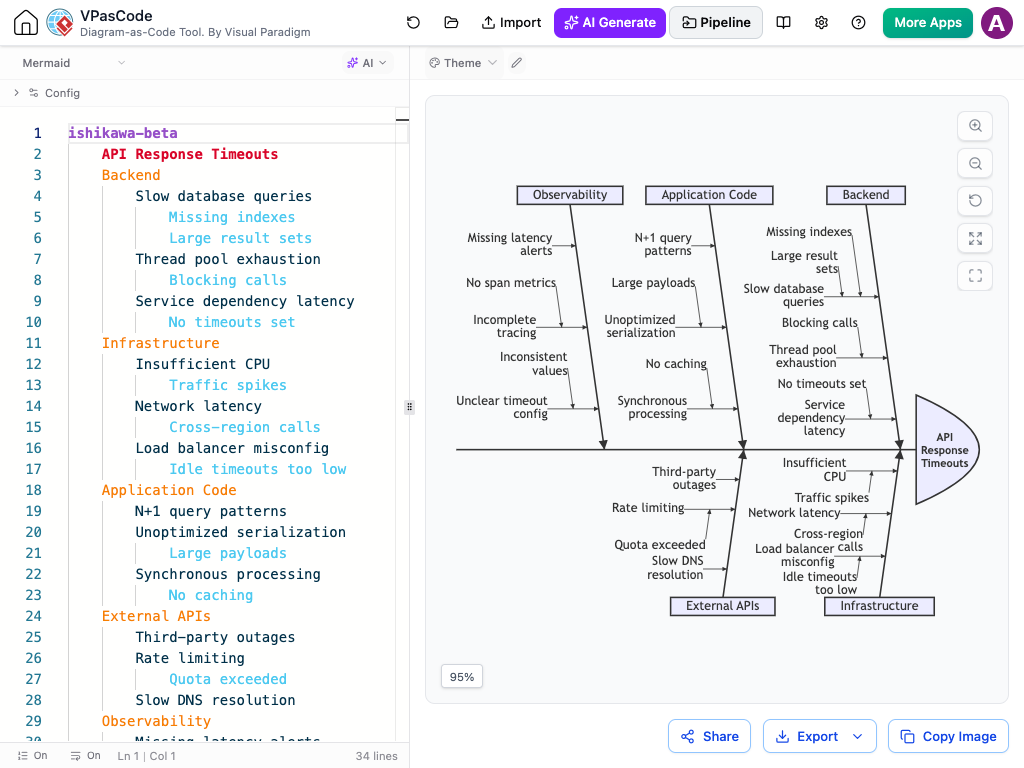
This visual clarity helps teams quickly spot patterns. For instance, if multiple branches point to “No timeouts set,” it indicates a systemic governance issue rather than a one-off bug.
Enterprise Integration: Closing the Loop
Generating the diagram is only half the battle. To drive real improvement, the insights must be integrated into your engineering lifecycle. VPasCode offers seamless exports and integrations:
-
OpenDocs: Embed live Ishikawa diagrams directly into incident post-mortems, SLA reports, and root-cause documentation. This ensures that your RCA artifacts remain dynamic and up-to-date.
-
NotesKeep: Preserve diagnostic steps and AI rationales as reference notes. This creates a knowledge base for future incident reviews, helping new team members understand historical context.
-
Vector Export: Download high-resolution SVG or PNG visual assets for engineering reviews, retrospectives, and stakeholder presentations.
Conclusion
The shift from manual diagramming to AI-powered, diagram-as-code workflows represents a significant leap forward in operational excellence. By using VPasCode’s AI Ishikawa Diagram Generator, teams can eliminate the friction of tooling during critical incident reviews. Instead of focusing on how to draw the diagram, engineers can focus on what caused the problem.
Whether you are conducting a post-mortem for a major outage or brainstorming potential risks for a new feature launch, VPasCode provides the speed, structure, and clarity needed to drive meaningful root cause analysis.
👉 Learn more about the Ishikawa Diagram Generator
👉 Try Ishikawa Diagram in VPasCode
Reading: Visual Paradigm Resources
-
Visual Paradigm Updates: AI Fishbone Diagram Generator: Official release notes detailing the new AI capabilities for Ishikawa diagrams in VPasCode.
-
VPasCode Editor: Diagram-as-Code Platform: Explore the main platform for creating, editing, and managing diagrams using code and AI prompts.
Related posts:
 VPasCode: The Ultimate Guide to AI Chart Generation and Code-Driven Data Visualization
 Best Diagram-as-Code Tools in 2026: Comprehensive Guide & Comparison
 Architecting Systems with AI: Generating PlantUML & C4 Models in VPasCode
 From Prompt to Architecture: The Complete Guide to Visual Paradigm’s AI-Powered VPasCode Update