


Unified Modeling Language (UML) is a standardized modeling language consisting of an integrated set of diagrams, developed to help system and software developers for specifying, visualizing, constructing, and documenting the artifacts of software systems, as well as for business modeling and other non-software systems.
")
🚀 Learn UML Faster, Better and Easier
Are you looking for a Free UML tool for learning UML faster, easier and quicker? Visual Paradigm Community Edition is a UML software that supports all UML diagram types. It is an international award-winning UML modeler, and yet it is easy-to-use, intuitive & completely free.
📜 The Origin of UML
The goal of UML is to provide a standard notation that can be used by all object-oriented methods and to select and integrate the best elements of precursor notations. UML has been designed for a broad range of applications, providing constructs for distributed systems, analysis, system design, and deployment.
The Three Foundational Methods
UML resulted from the unification of three pioneering object-oriented methodologies:
-
Object Modeling Technique (OMT) [James Rumbaugh 1991]
-
Best for analysis and data-intensive information systems
-
-
Booch Method [Grady Booch 1994]
-
Excellent for design and implementation
-
Grady Booch worked extensively with the Ada programming language
-
Known for strong methodology, though notation used many “cloud shapes”
-
-
OOSE (Object-Oriented Software Engineering) [Ivar Jacobson 1992]
-
Featured the powerful Use Cases technique
-
Use Cases help understand the behavior of entire systems—an area where OO traditionally struggled
-
The “Three Amigos” Unite
-
1994: Jim Rumbaugh left General Electric to join Grady Booch at Rational Corp., aiming to merge their ideas into a single “Unified Method”
-
1995: Ivar Jacobson joined Rational, contributing Use Cases to what became the Unified Modeling Language
-
The trio—Rumbaugh, Booch, and Jacobson—are affectionately known as the “Three Amigos”
Additional Influences
UML also incorporated concepts from other notable object-oriented notations:
-
Mellor and Shlaer (1998)
-
Coad and Yourdon (1995)
-
Wirfs-Brock (1990)
-
Martin and Odell (1992)
UML introduced new concepts not present in earlier methods, such as extension mechanisms and a constraint language.
📅 History of UML
| Year | Milestone |
|---|---|
| 1996 | First Request for Proposal (RFP) issued by the Object Management Group (OMG) catalyzed industry collaboration |
| 1996-1997 | Rational established the UML Partners consortium with major contributors including Digital Equipment Corp, HP, IBM, Microsoft, Oracle, and others |
| January 1997 | UML 1.0 submitted to OMG as initial RFP response |
| Fall 1997 | UML 1.1 adopted by OMG after incorporating feedback from additional partners (IBM, ObjecTime, Platinum Technology, etc.) |
| 1997-2006 | Iterative enhancements: UML 1.1 → 1.5 → UML 2.0 → 2.1 |
| Current | UML 2.5 is the latest standardized version |
❓ Why UML?
As software’s strategic value grows, organizations seek techniques to:
-
Automate software production
-
Improve quality while reducing cost and time-to-market
-
Manage increasing system complexity and scale
-
Solve recurring architectural problems: distribution, concurrency, security, fault tolerance, and more
The Unified Modeling Language was designed to respond to these needs. Its primary design goals, as summarized by Page-Jones in Fundamental Object-Oriented Design in UML, include:
-
Provide users with a ready-to-use, expressive visual modeling language for developing and exchanging meaningful models
-
Offer extensibility and specialization mechanisms to extend core concepts
-
Remain independent of particular programming languages and development processes
-
Provide a formal basis for understanding the modeling language
-
Encourage growth of the OO tools market
-
Support higher-level development concepts: collaborations, frameworks, patterns, and components
-
Integrate industry best practices
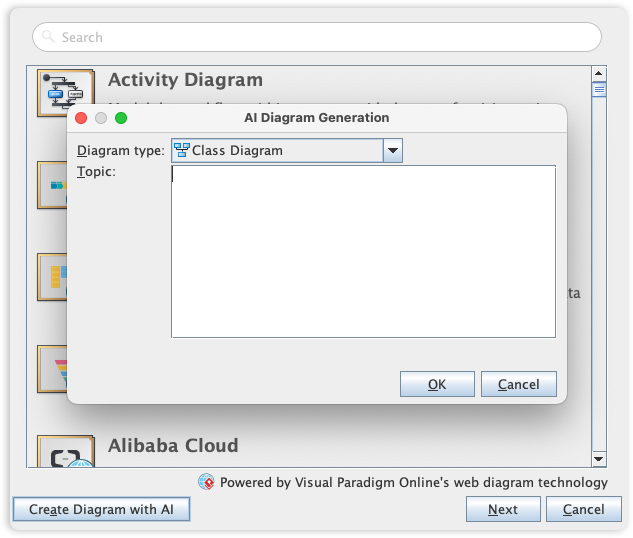
🤖 The Next Evolution: AI-Powered UML Modeling
While UML provides the standard notation for system design, the way we build these models is changing. Visual Paradigm has integrated cutting-edge AI Diagram Generation to help you move from concept to complex architecture in seconds.
Streamline Your Design Workflow:
-
AI Diagram Chatbot: Simply describe your system requirements in plain English and watch your UML diagrams generate instantly. You can even ask follow-up questions to refine the logic.
-
Desktop AI Generator: Access powerful UML generation capabilities directly within the Visual Paradigm Desktop environment for professional-grade modeling.
-
OpenDocs Knowledge Management: Seamlessly embed AI-generated diagrams into your documentation to keep your technical knowledge base and visual models in perfect sync.
View AI Diagram Generation Guide →
🗂️ UML – An Overview
The UML offers multiple diagram types because systems can be viewed from many different viewpoints. A software development project involves diverse stakeholders, each requiring different levels of detail:
| Stakeholder | Primary Interest |
|---|---|
| Analysts | Requirements, use cases, business processes |
| Designers | System architecture, class structures, interactions |
| Coders | Detailed class designs, method logic, interfaces |
| Testers | Behavior flows, state transitions, test scenarios |
| QA | Process compliance, traceability, validation paths |
| Customers | High-level functionality, user interactions |
| Technical Authors | System behavior, component relationships, documentation structure |
UML provides expressive diagrams so all stakeholders can benefit from at least one model type.
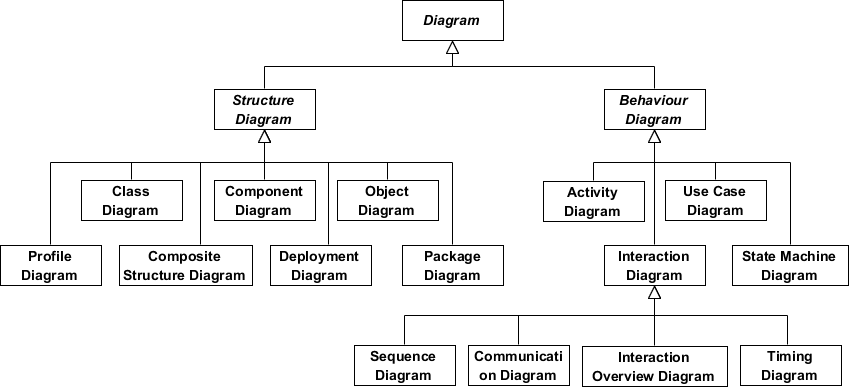
UML 2 Diagram Structure
UML diagrams are categorized into two main groups:
🔷 Structure Diagrams (Static View)
Show the static structure of the system and its parts across different abstraction and implementation levels.
🔶 Behavior Diagrams (Dynamic View)
Show the dynamic behavior of objects in a system—changes to the system over time.
🔷 Structure Diagrams
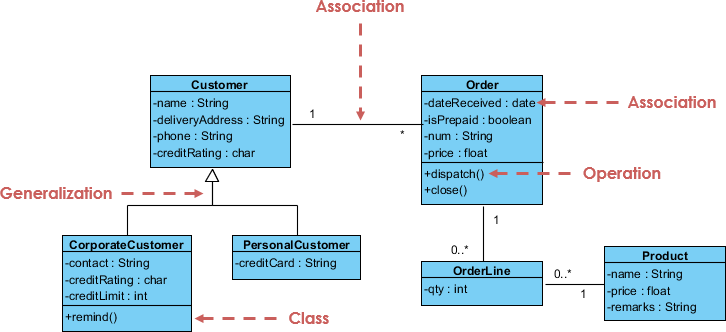
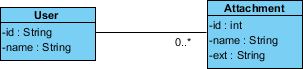
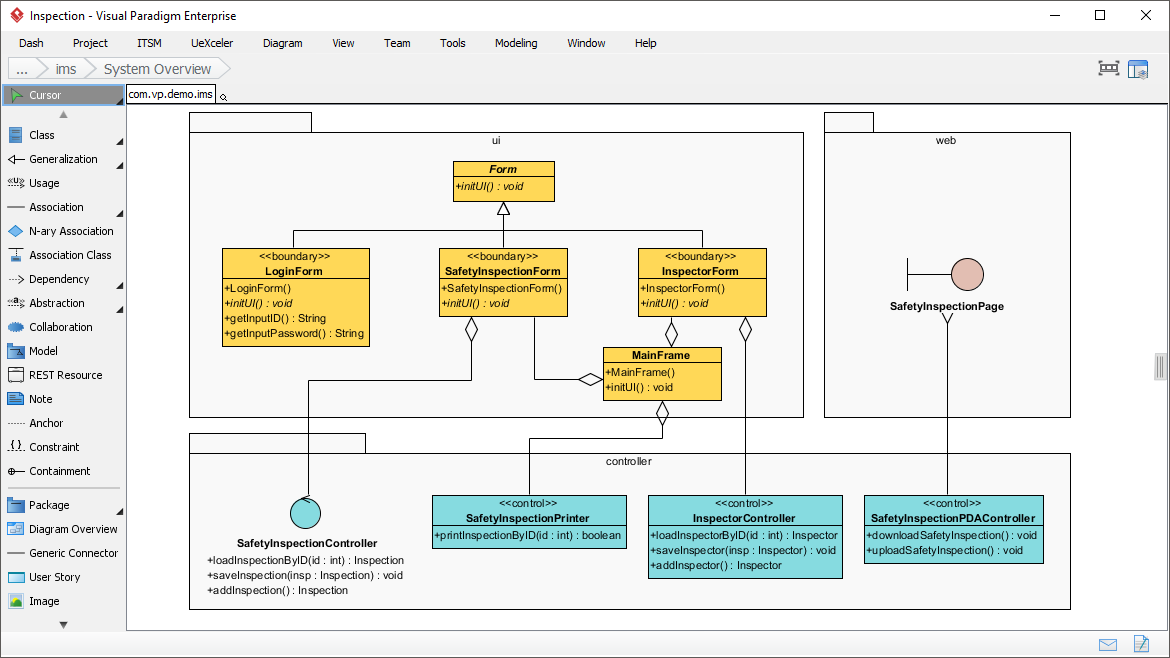
What is a Class Diagram?
The class diagram is a central modeling technique that runs through nearly all object-oriented methods. This diagram describes the types of objects in the system and various kinds of static relationships which exist between them.
Key Relationships
| Relationship | Description | Example |
|---|---|---|
| Association | Represents relationships between instances of types | A person works for a company; a company has offices |
| Inheritance | Represents “is-a” relationships; corresponds to OO inheritance | Manager is a Employee |
| Aggregation | A form of object composition representing “has-a” relationships | Department has Employees |
Class Diagram Example
For more details about Class Diagram, please read the article What is Class Diagram?
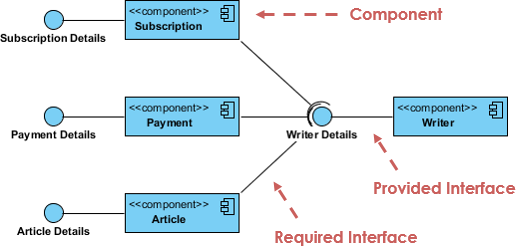
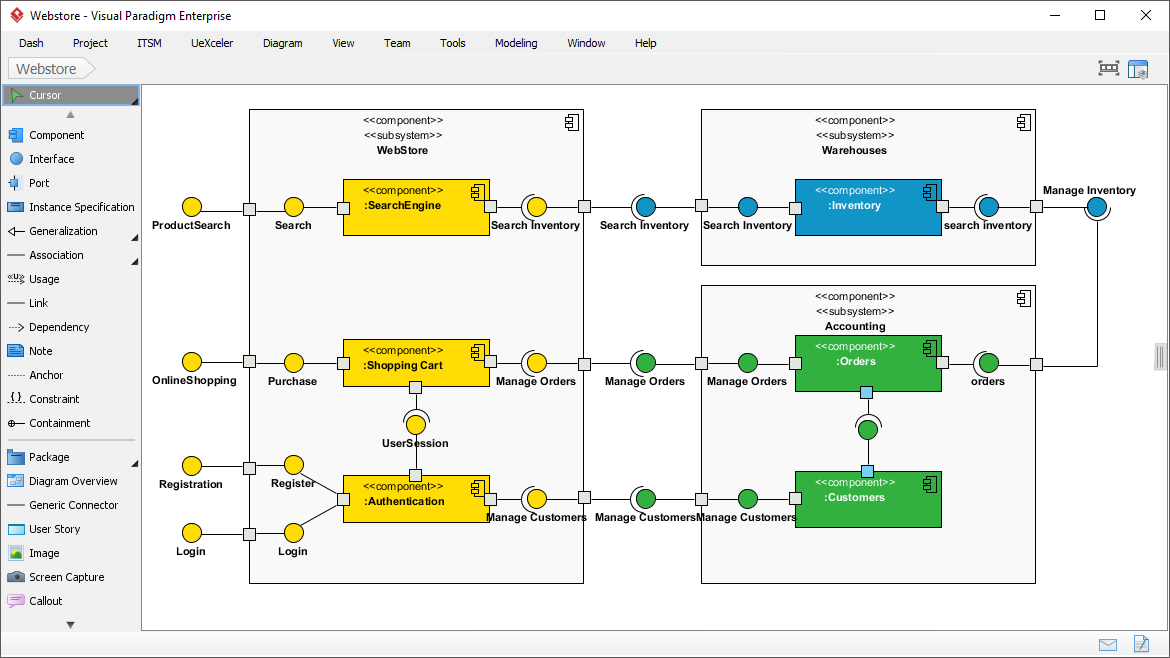
What is a Component Diagram?
In the Unified Modeling Language, a component diagram depicts how components are wired together to form larger components or software systems. It illustrates the architectures of the software components and the dependencies between them—including run-time components, executable components, and source code components.
Component Diagram Example
For more details about Component Diagram, please read the article What is Component Diagram?
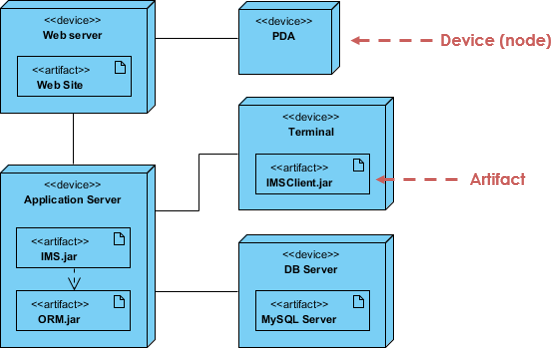
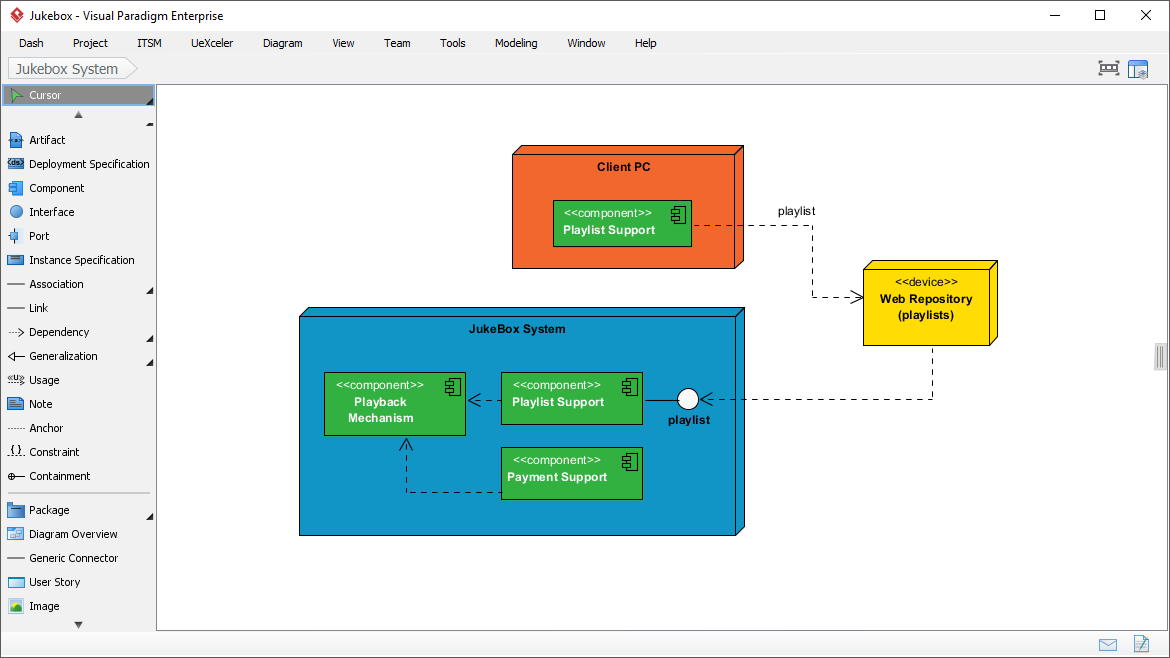
What is a Deployment Diagram?
The Deployment Diagram helps to model the physical aspect of an Object-Oriented software system. It is a structure diagram which shows architecture of the system as deployment (distribution) of software artifacts to deployment targets.
Key Concepts:
-
Artifacts: Concrete elements in the physical world resulting from development (e.g., executables, libraries, configuration files)
-
Nodes: Hardware or execution environments where artifacts are deployed
-
Connections: Communication paths between nodes
Deployment Diagram Example
For more details about Deployment Diagram, please read the article What is Deployment Diagram?
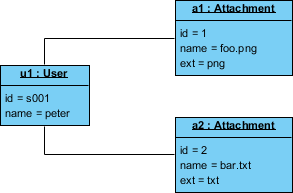
What is an Object Diagram?
An object diagram is a graph of instances, including objects and data values. A static object diagram is an instance of a class diagram; it shows a snapshot of the detailed state of a system at a point in time.
Class Diagram vs Object Diagram
| Aspect | Class Diagram | Object Diagram |
|---|---|---|
| Represents | Abstract model of classes | Concrete instances at a moment in time |
| Purpose | Blueprint for implementation | Example of runtime data structure |
| Elements | Classes, attributes, operations, relationships | Objects, attribute values, links |
| Usage | Design phase, code generation | Testing, debugging, documentation examples |
Class Diagram Example
Object Diagram Example
For more details about Object Diagram, please read the article What is Object Diagram?
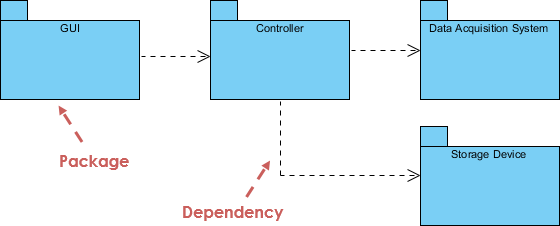
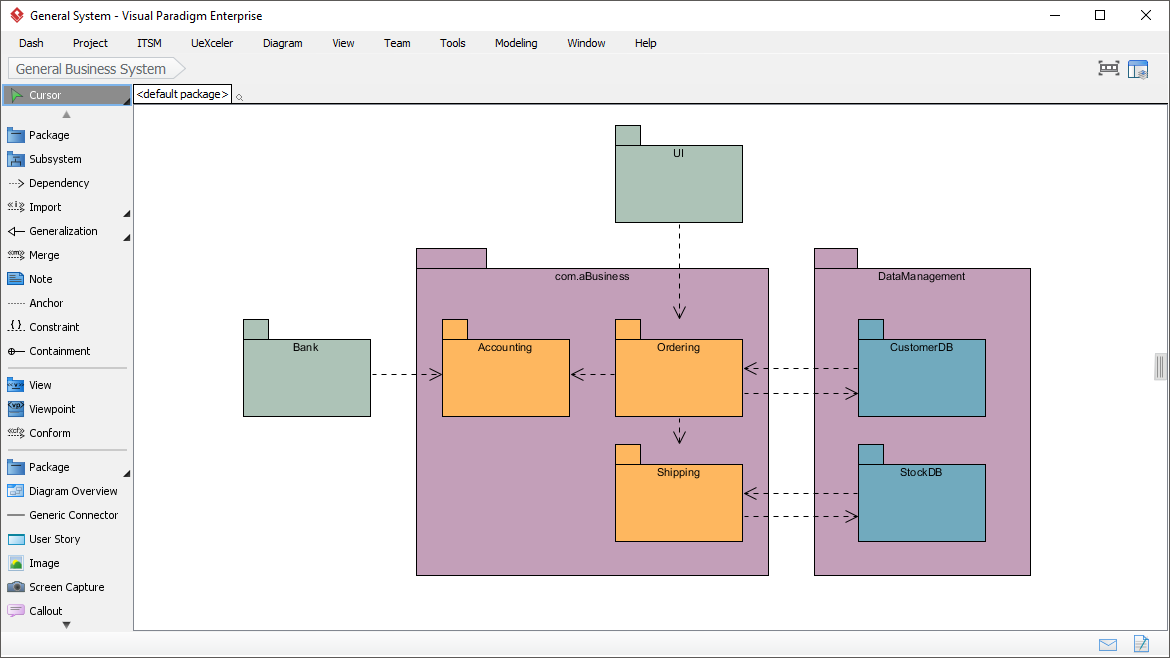
What is a Package Diagram?
Package diagram is a UML structure diagram which shows packages and dependencies between the packages. Model diagrams allow to show different views of a system, for example, as multi-layered (aka multi-tiered) application.
Common Uses:
-
Organizing large models into manageable modules
-
Visualizing architectural layers (presentation, business, data)
-
Managing dependencies between subsystems
Package Diagram Example
For more details about Package Diagram, please read the article What is Package Diagram?
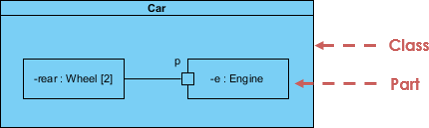
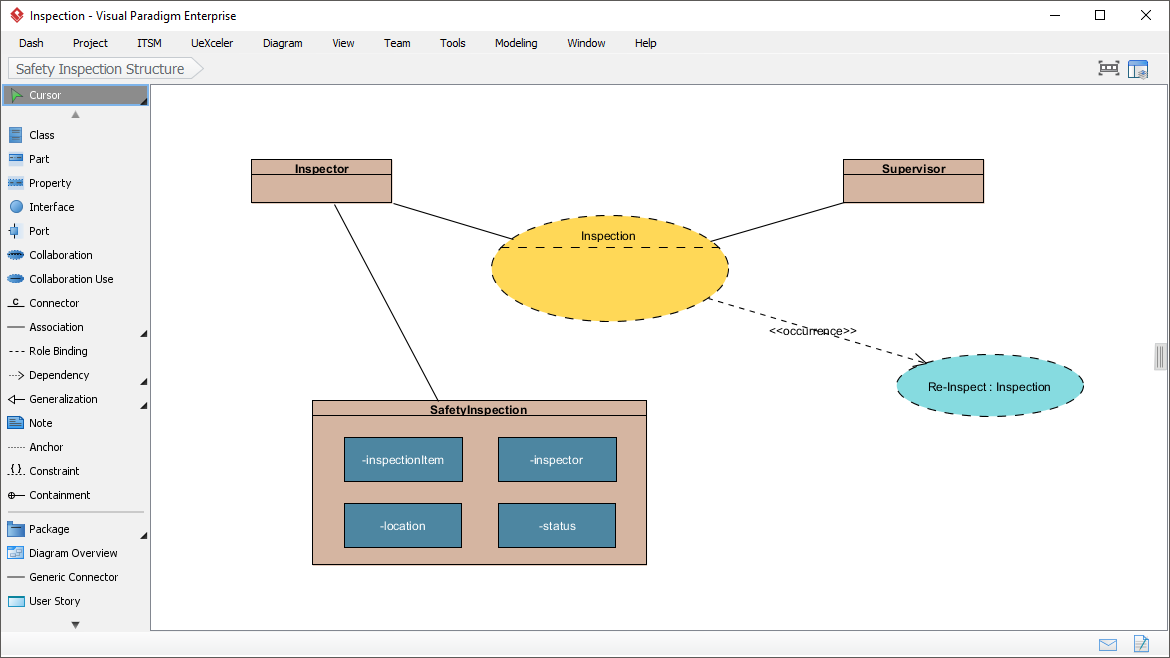
What is a Composite Structure Diagram?
Composite Structure Diagram is one of the new artifacts added to UML 2.0. It is a kind of component diagram mainly used in modeling a system at micro point-of-view, depicting individual parts instead of whole classes.
Key Elements:
-
Internal Parts: Components that make up the classifier
-
Ports: Interaction points between parts or with the external environment
-
Connectors: Links enabling collaboration between parts at runtime
Composite Structure Diagram Example
For more details about Composite Structure Diagram, please read the article What is Composite Structure Diagram?
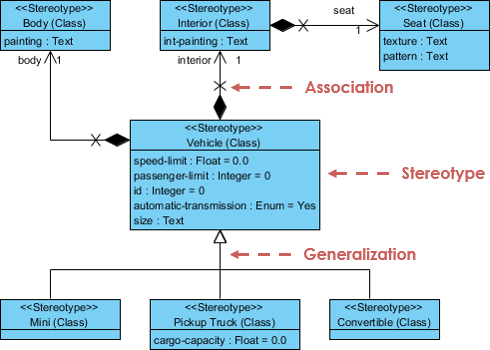
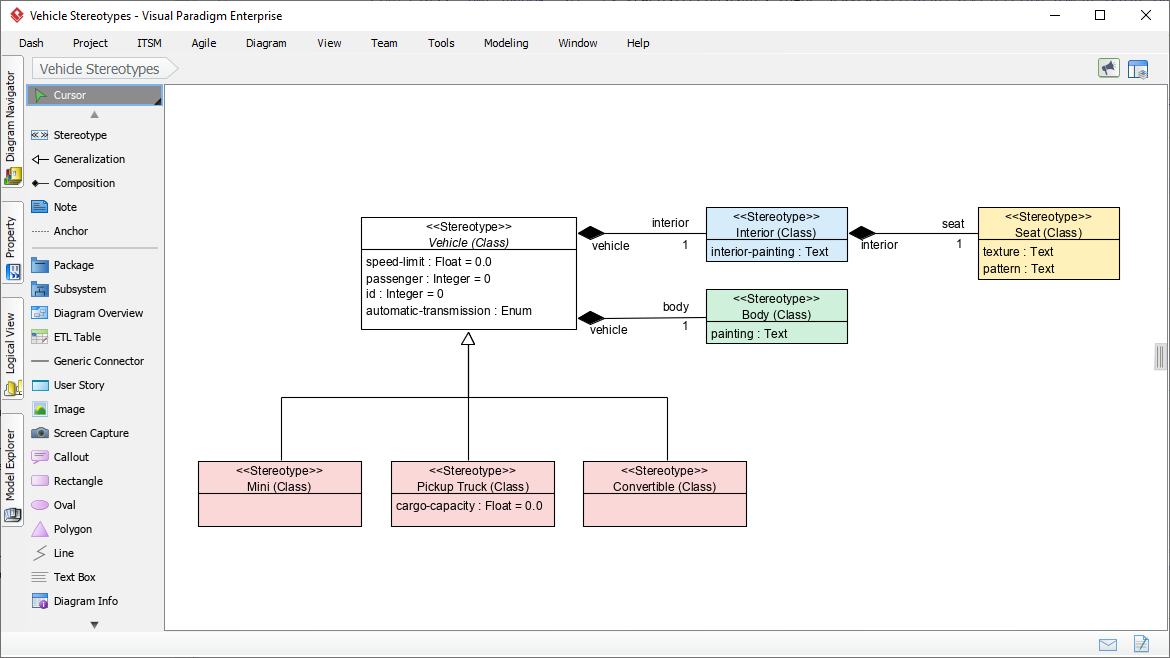
What is a Profile Diagram?
A profile diagram enables you to create domain and platform specific stereotypes and define the relationships between them. You can create stereotypes by drawing stereotype shapes and relate them with composition or generalization.
Common Applications:
-
Defining domain-specific extensions to UML
-
Creating platform-specific modeling conventions (e.g., JEE, .NET profiles)
-
Standardizing tagged values and constraints across projects
Profile Diagram Example
For more details about Profile Diagram, please read the article What is Profile Diagram in UML?
🔶 Behavior Diagrams
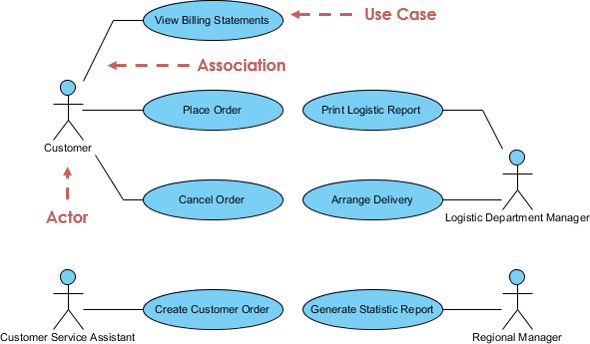
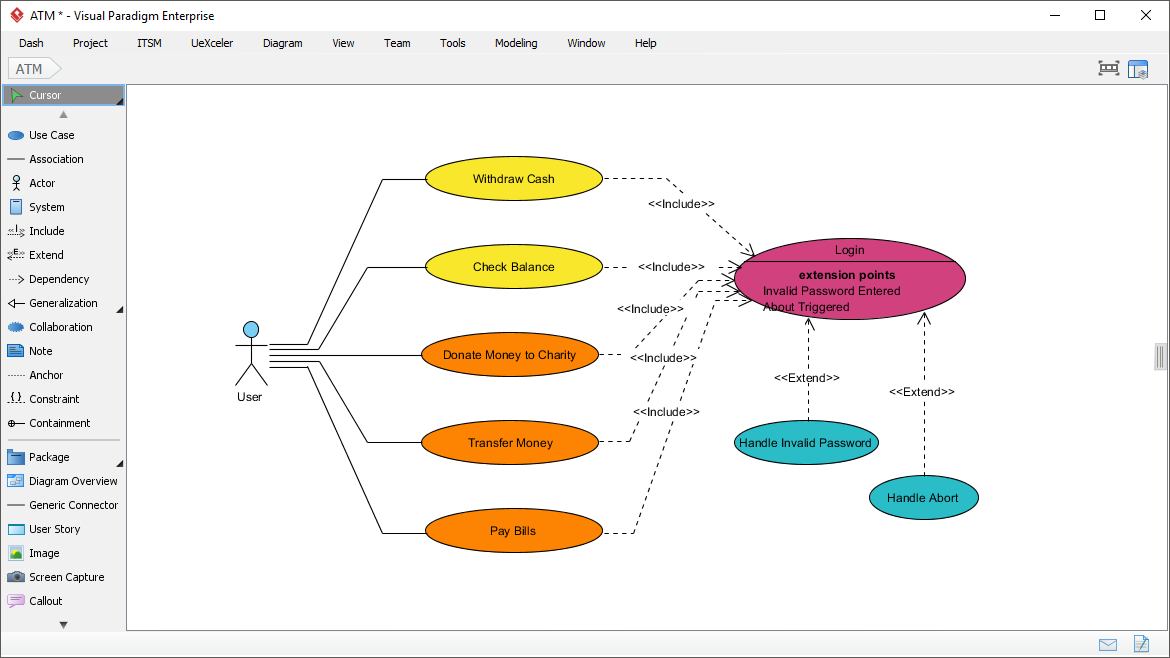
What is a Use Case Diagram?
A use-case model describes a system’s functional requirements in terms of use cases. It is a model of the system’s intended functionality (use cases) and its environment (actors).
Think of it like a restaurant menu: By looking at the menu, you know what’s available, the individual dishes, their prices, and the cuisine type. The menu “models” the restaurant’s behavior.
Key Elements:
-
Actors: Roles that interact with the system (users, external systems)
-
Use Cases: High-level business goals yielding measurable value
-
Relationships: Include, extend, generalization between use cases
Use Case Diagram Example
For more details about Use Case Diagram, please read the article What is Use Case Diagram?
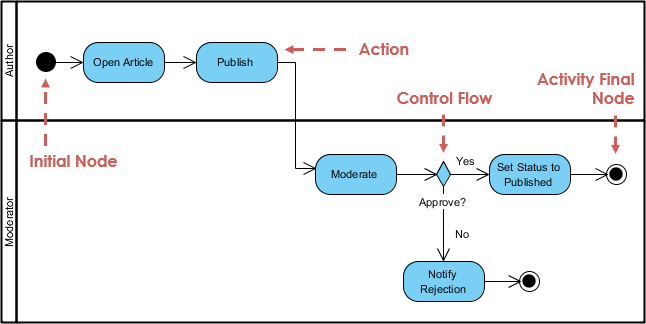
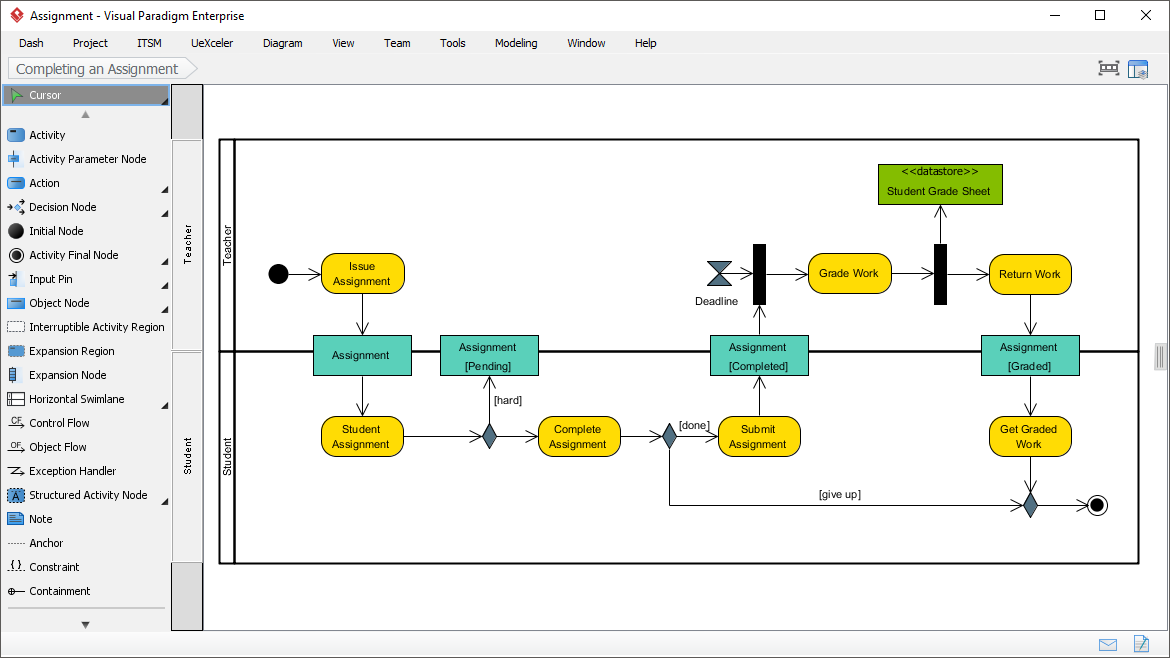
What is an Activity Diagram?
Activity diagrams are graphical representations of workflows of stepwise activities and actions with support for choice, iteration and concurrency. It describes the flow of control of the target system.
Common Applications:
-
Modeling business processes and workflows
-
Describing complex business rules and operations
-
Visualizing use case scenarios and algorithm logic
-
Representing concurrent and parallel processes
Activity Diagram Example
For more details about Activity Diagram, please read the article What is Activity Diagram?
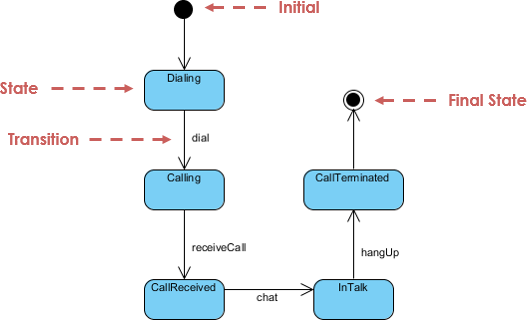
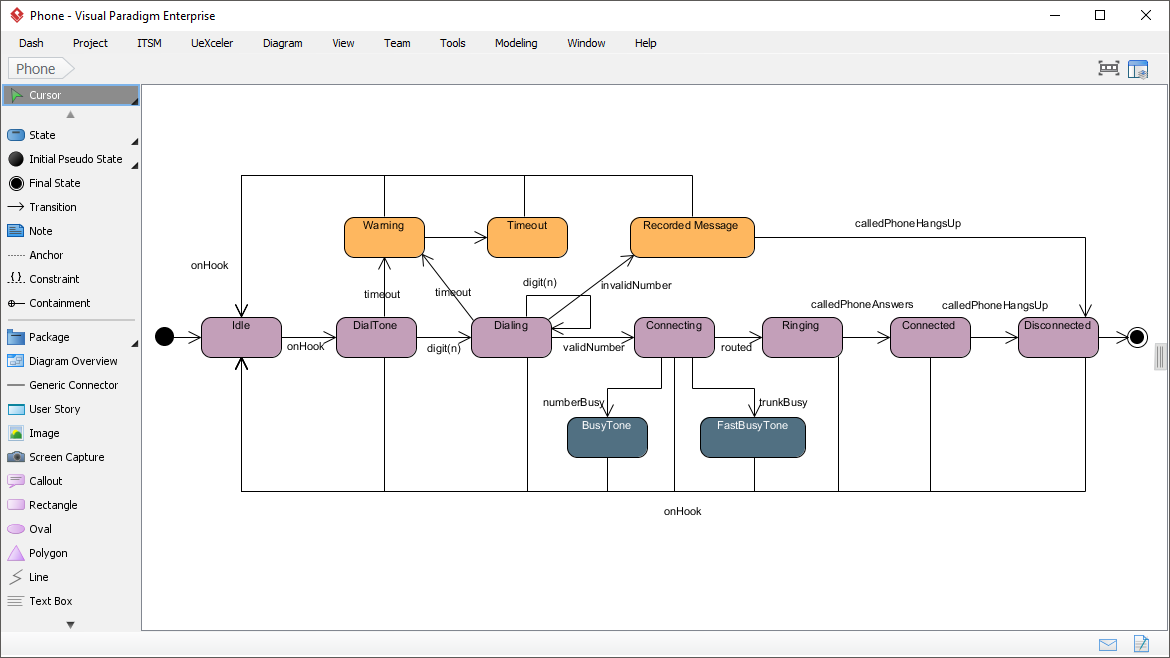
What is a State Machine Diagram?
A state diagram is a type of diagram used in UML to describe the behavior of systems based on the concept of state diagrams by David Harel. State diagrams depict the permitted states and transitions as well as the events that effect these transitions.
Key Components:
-
States: Conditions during an object’s lifecycle
-
Transitions: Changes between states triggered by events
-
Events: Occurrences that trigger transitions
-
Actions: Operations performed during transitions or within states
State Machine Diagram Example
For more details about State Machine Diagram, please read the article What is State Machine Diagram?
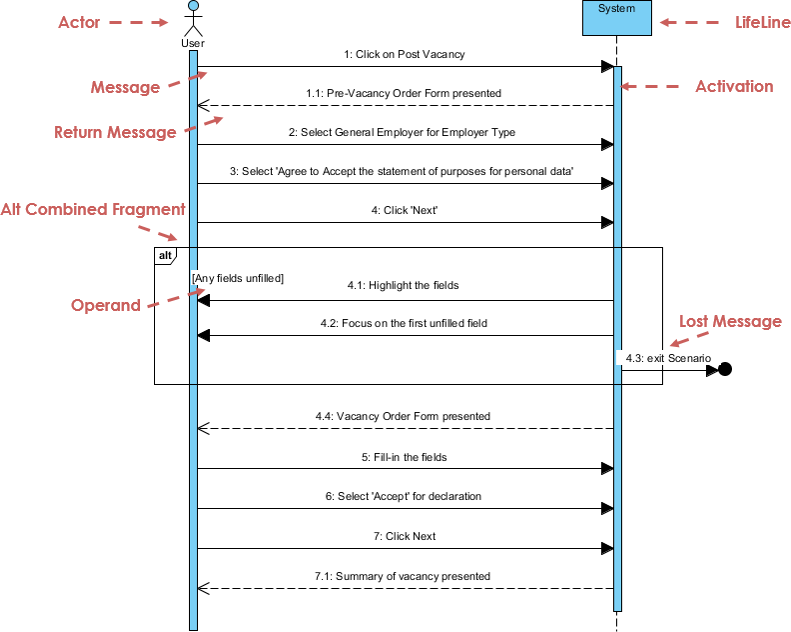
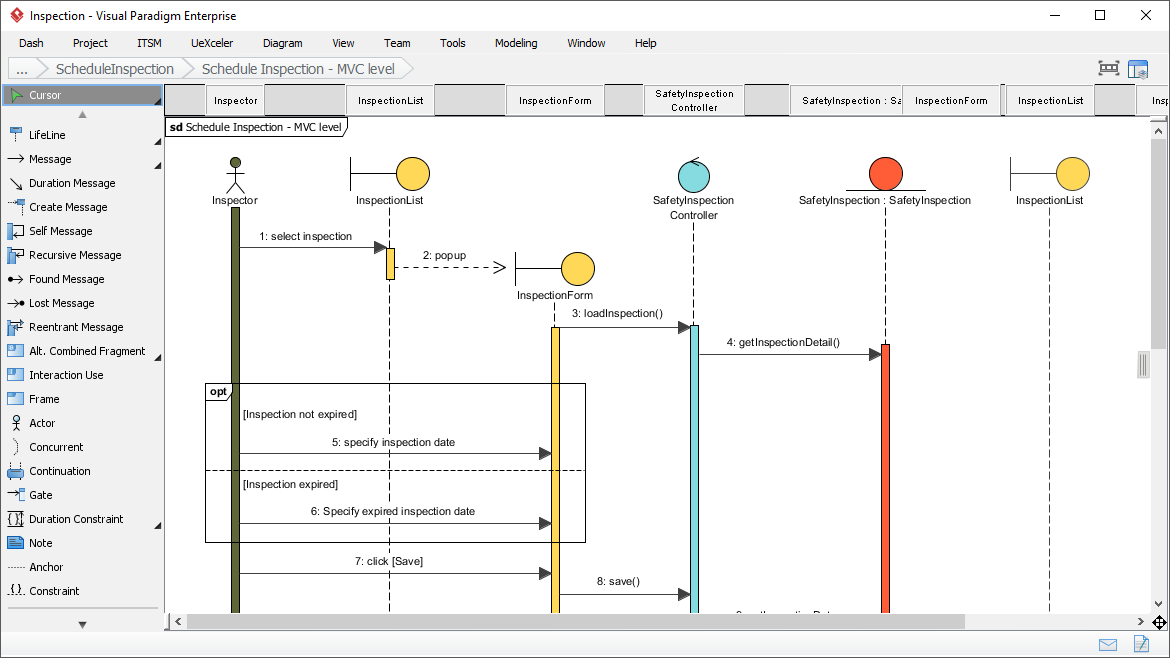
What is a Sequence Diagram?
The Sequence Diagram models the collaboration of objects based on a time sequence. It shows how the objects interact with others in a particular scenario of a use case.
Key Elements:
-
Lifelines: Vertical dashed lines representing objects/participants over time
-
Messages: Horizontal arrows showing communication between lifelines
-
Activation Bars: Rectangles indicating when an object is performing an action
-
Combined Fragments: Boxes for loops, alternatives, parallel execution
Sequence Diagram Example
For more details about Sequence Diagram, please read the article What is Sequence Diagram?
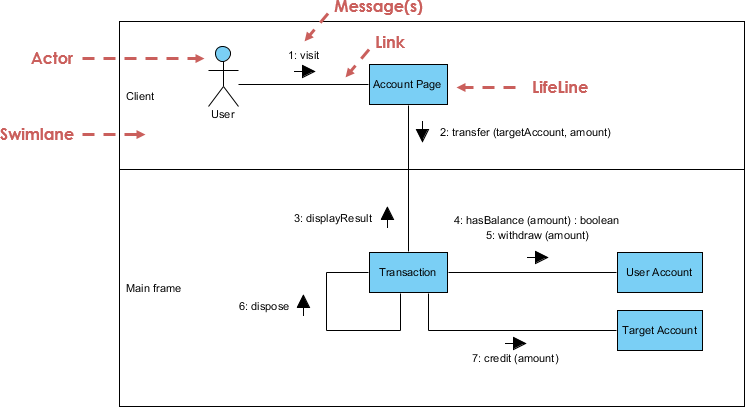
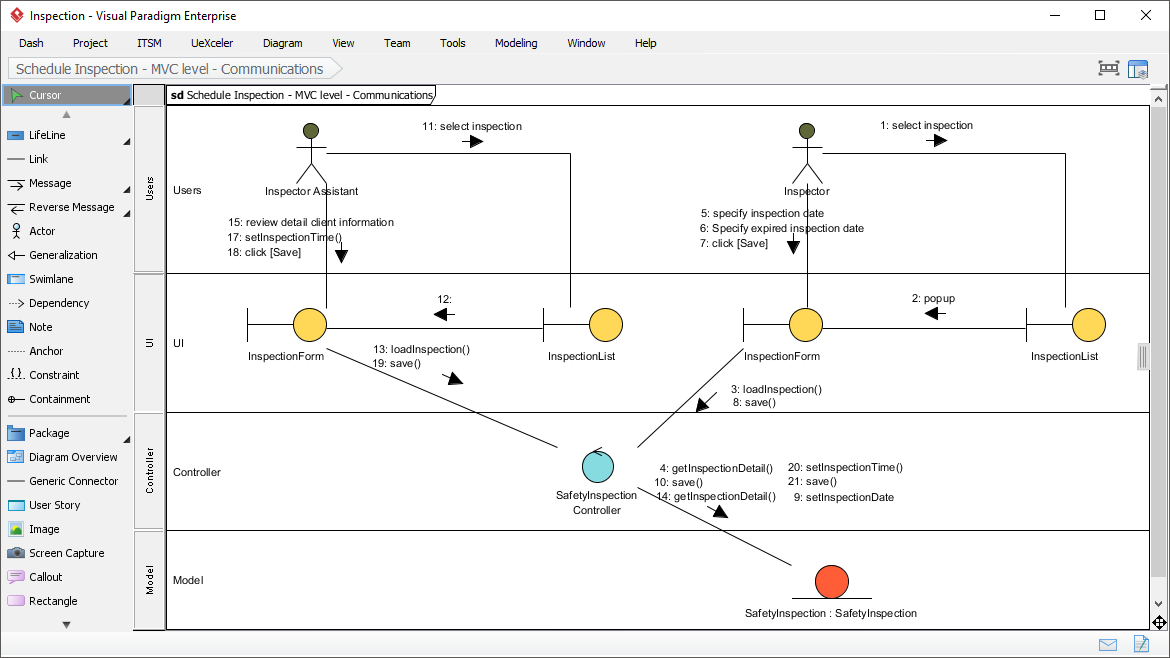
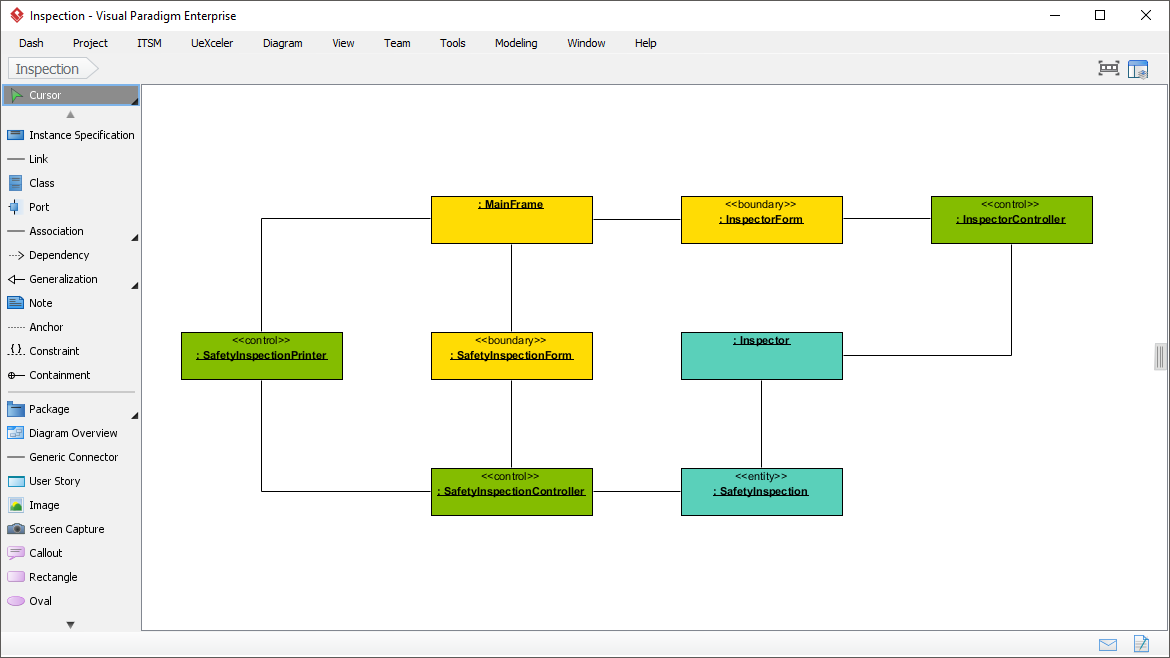
What is a Communication Diagram?
Similar to Sequence Diagram, the Communication Diagram is also used to model the dynamic behavior of the use case. When compared to Sequence Diagram, the Communication Diagram is more focused on showing the collaboration of objects rather than the time sequence.
Key Differences from Sequence Diagrams:
| Feature | Sequence Diagram | Communication Diagram |
|---|---|---|
| Primary Focus | Time ordering of messages | Structural organization of objects |
| Layout | Vertical timeline | Free-form network |
| Message Numbering | Implicit by position | Explicit numbering required |
| Best For | Detailed interaction flows | Object collaboration overview |
💡 They are semantically equivalent—many tools (including Visual Paradigm) allow conversion between them.
Communication Diagram Example
For more details about Communication Diagram, please read the article What is Communication Diagram?
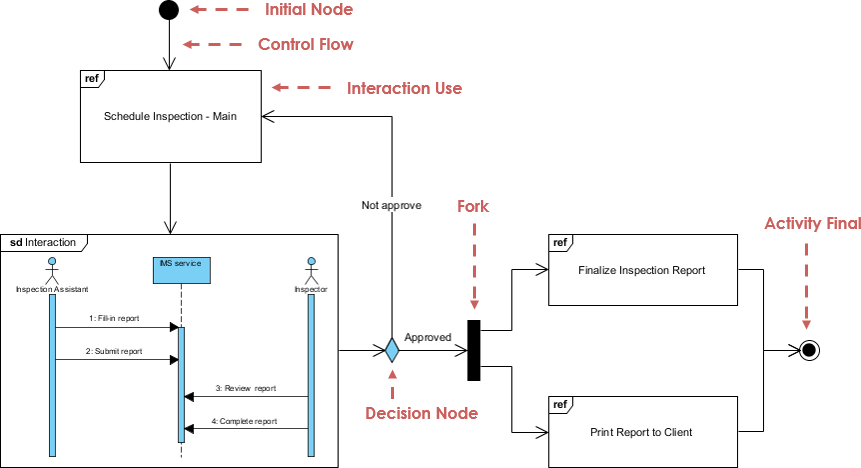
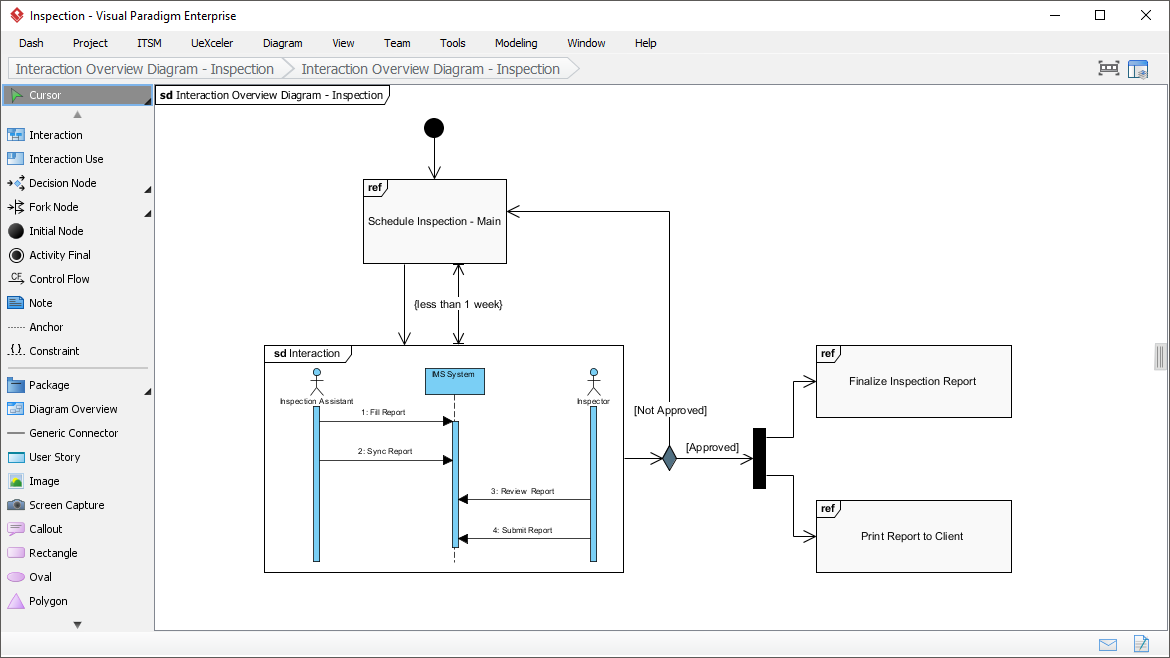
What is an Interaction Overview Diagram?
The Interaction Overview Diagram focuses on the overview of the flow of control of the interactions. It is a variant of the Activity Diagram where the nodes are the interactions or interaction occurrences.
Key Features:
-
Combines aspects of Activity and Sequence diagrams
-
Nodes represent interactions (which can link to detailed Sequence diagrams)
-
Messages and lifelines are hidden for high-level overview
-
Enables navigability between complex interaction scenarios
Interaction Overview Diagram Example
For more details about Interaction Overview Diagram, please read the article What is Interaction Overview Diagram?
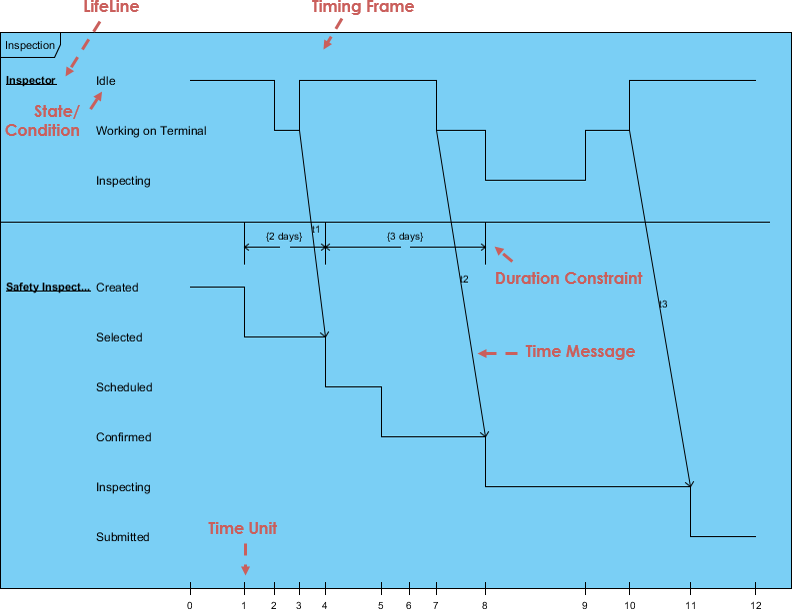
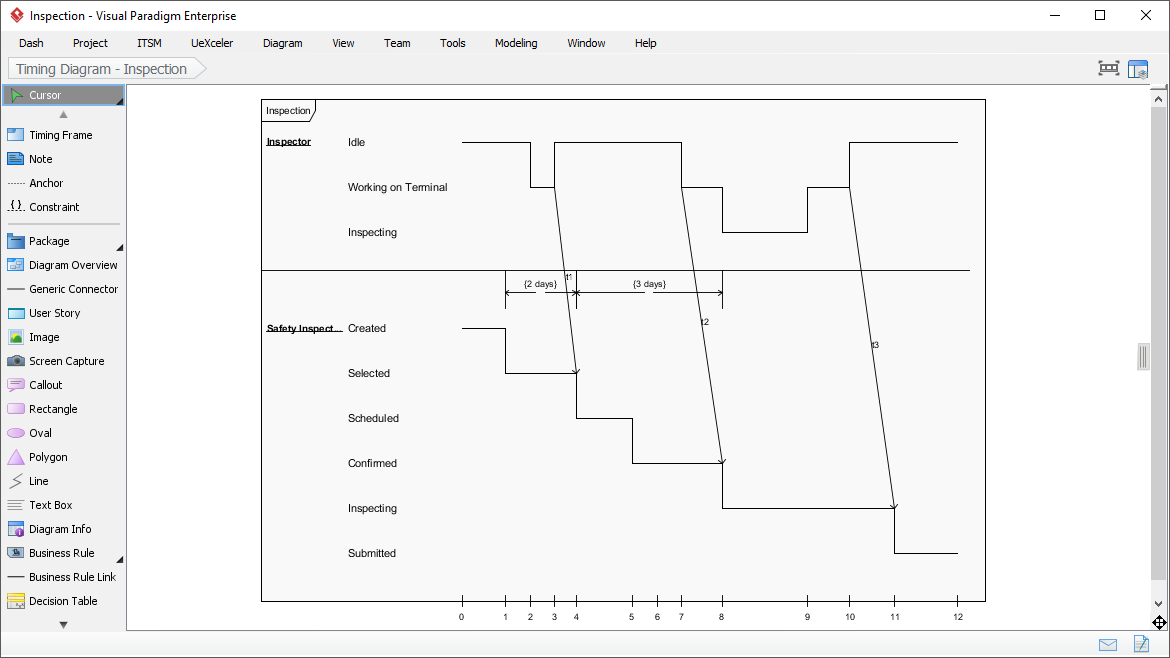
What is a Timing Diagram?
Timing Diagram shows the behavior of the object(s) in a given period of time. Timing diagram is a special form of a sequence diagram with reversed axes: time increases from left to right, and lifelines are shown in separate compartments arranged vertically.
Common Applications:
-
Real-time and embedded systems design
-
Protocol specification and verification
-
Performance analysis of time-critical operations
-
Hardware-software interface modeling
Timing Diagram Example
For more details about Timing Diagram, please read the article What is Timing Diagram?
🛠️ UML Tool Features
Create UML models in a snap with an award-winning UML software.
Diagram-Specific Capabilities
Use Case Diagram
Capture functional requirements with UML use case diagram tool. Each use case represents a high-level business goal that yields measurable business value. Actors are connected with use cases to represent roles that interact with system functions.
Class Diagram
Model the structure of system by modeling its classes, their attributes and operations. UML class diagram is a blueprint of the classes (code level) required to build a software system.
Sequence Diagram
Visualize the interactions between users, systems and sub-systems over time through message passing between objects or roles.
Communication Diagram
Model collaboration between objects in runtime. Objects (lifelines) are connected to represent communication needs during interaction execution.
Activity Diagram
Use UML activity diagram, a flowchart-based diagram to model the flow of control. Partition actions according to the type of participant involved.
State Machine Diagram
Critical design model for event-driven systems. Well-designed state machines show essential states and triggers of state change for error-free development.
Component Diagram
Model system structure by showing how smaller parts gear up to form bigger components or entire software systems.
Deployment Diagram
Model physical deployment of software components. Hardware components are presented as nodes, with software components shown as artifacts running inside them.
Package Diagram
Arrange and organize models for large-scale projects. Excellent for visualizing structure and dependency between sub-systems or modules.
Object Diagram
View a snapshot of instances of classifiers in UML class diagrams. Shows static design from a prototypical perspective.
Composite Structure Diagram
Visualize the internal structure of a class or collaboration. Model systems from a micro point-of-view.
Timing Diagram
Model behavior of objects throughout a given period of time. Commonly used for real-time and distributed systems design.
Interaction Overview Diagram
View the sequence of interactions. Helps represent complex scenarios involving multiple interactions presented as multiple UML sequence diagrams.
Profile Diagram
Define stereotypes to use in your project. Draw stereotypes, define their tags and inter-relationships like generalizations and associations.
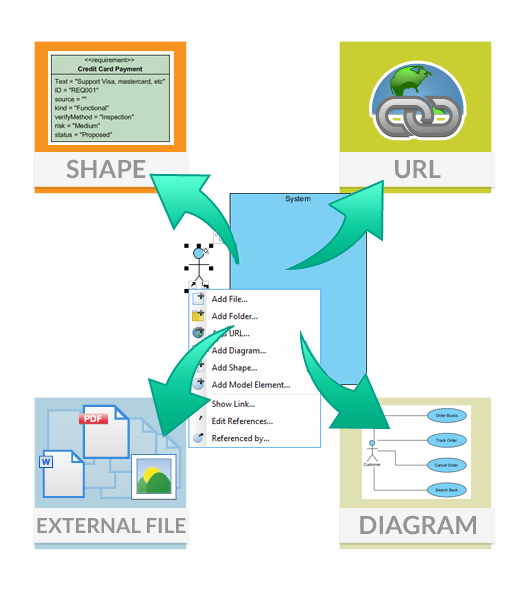
🔗 Model Element Referencing
Add diagrams, shapes, model elements as internal references
Make internal links between different kinds of project artifacts. Those references work both in Visual Paradigm and in any document and Web contents generated from your design.
Add business documents as external references
Maintain reference between software design and business documents to help find out why a design decision was made.
Mark in shape body when reference added
Glance over a design. The tiny marker that appears in shapes’ body indicates that the shapes have references added.
Reference model element in description
Insert model element references to rich text description. The referenced model elements will be linked and highlighted.
🤖 Architecture Meets Intelligence: AI-Powered UML Modeling
Visual Paradigm’s UML toolset is the industry standard for software modeling, offering the full range of diagrams needed to bridge the gap between requirements and implementation. We are now elevating the entire modeling experience by integrating comprehensive UML support into our AI Diagram Generator, enabling you to visualize system behavior and structure with unprecedented speed.
This capability allows you to instantly generate a wide array of UML diagrams—including Use Case, Class, Sequence, State Machine, Requirement, and Object Diagrams—from a simple textual description. By leveraging AI to interpret your system requirements, the tool automatically maps out the necessary entities, relationships, and interactions, allowing you to move directly to design validation and architectural refinement instead of starting from a blank canvas.
✨ Core UML Features
Visual Paradigm supports the full range of industry-standard UML diagrams for software architecture and system design:
Structural Diagrams
-
Class, Object, Component, Composite Structure, Package, and Deployment diagrams
Behavioral Diagrams
-
Use Case, Sequence, Communication, State Machine, Activity, and Interaction Overview diagrams
Code Engineering
-
Generate source code from diagrams (Java, C++, PHP, etc.)
-
Reverse-engineer existing code back into UML models
Advanced Modeling
-
Model-level synchronization and traceability
-
Architectural pattern support for large-scale system consistency
🧠 AI-Powered Support for UML
The AI Diagram Generator and AI Chatbot streamline the modeling process through several key automated functions:
✨ Instant Text-to-Diagram Generation
Generate complete, standards-compliant UML diagrams (such as Use Case, Class, Sequence, and Activity diagrams) simply by describing your system’s requirements in plain English.
💬 Conversational Iterative Refinement
After initial generation, use the AI Chatbot to modify the model with commands like:
-
“Add a PaymentGateway class”
-
“Rename Customer to Buyer”
-
“Show error handling flow”
The AI interprets these requests and updates the visual diagram instantly.
🔍 Intelligent Analysis and Critique
The AI can perform a “quality check” on your models, identifying potential design issues like:
-
Inconsistent multiplicities
-
Missing relationships
-
Violated design patterns
And offering recommendations for improvement.
❓ “Ask Your Diagram”
Query your diagram as a knowledge base to:
-
Extract summaries
-
Identify main use cases
-
Generate project documentation and proposals based on the visual model
🖥️ Seamless Desktop Integration
AI-generated drafts from the web-based chatbot can be imported directly into the Visual Paradigm Desktop application (Professional Edition and above) for advanced engineering tasks like code generation and team collaboration.
- 📚 Reference
- Visual Paradigm Official Website: Comprehensive platform for visual modeling, business analysis, and AI-powered diagram generation supporting UML, SysML, BPMN, and more.
- Comprehensive Review: Visual Paradigm’s AI Diagram Generation Features: In-depth analysis of Visual Paradigm’s AI capabilities for automated UML diagram creation and refinement.
- Visual Paradigm UML Tool Features: Official documentation detailing UML modeling capabilities, diagram types, and professional-grade tooling features.
- Architecture Meets Intelligence: AI-Powered UML Modeling: Overview of how AI integration enhances traditional UML modeling workflows.
- AI Diagram Generation Features: Detailed guide to text-to-diagram generation, conversational refinement, and AI-assisted modeling capabilities.
- Generate UML Class Diagrams with AI: Tutorial on using AI to automatically generate standards-compliant class diagrams from natural language descriptions.
- Visual Paradigm Desktop vs VP Online: A Comprehensive Guide: Comparative analysis of deployment options, feature sets, and use cases for Visual Paradigm editions.
- AI-Assisted UML Class Diagram Generator: Specialized tool documentation for AI-powered class diagram creation and refinement.
- Visual Paradigm UML Guides: Collection of tutorials and best practices for UML modeling with AI assistance.
- AI-Powered UML Component Diagram Generation: Interactive chatbot interface for generating component diagrams via natural language prompts.
- AI Chatbot for Diagramming: Documentation for the conversational AI assistant that helps create, modify, and analyze UML diagrams.
- Guide to Powered UML Diagram Generation: Step-by-step instructions for leveraging AI to accelerate UML modeling workflows.
- AI-Generated UML Class Diagrams Tutorial: Practical examples and use cases for AI-assisted class diagram creation.
- Visual Paradigm AI Demo Video: Video demonstration of AI-powered diagram generation features and workflows.
- AI-Assisted Class Diagram Generator Details: Technical specifications and usage guidelines for AI class diagram tooling.
- Visual Paradigm AI Features Review: Third-party evaluation of AI diagram generation accuracy, usability, and integration capabilities.
- Advanced UML Generation Guide: Expert-level techniques for complex diagram generation and iterative refinement using AI.
- AI Chatbot Feature Documentation: Complete reference for conversational commands, supported diagram types, and integration options.
💡 Pro Tip: Whether you’re learning UML for the first time or refining enterprise-scale architectures, combining standardized notation with AI-powered tooling dramatically accelerates design validation, team collaboration, and documentation accuracy. Start with free tools like Visual Paradigm Community Edition, then scale to professional features as your modeling needs grow.
This post is also available in Deutsch, Español, Français, English, Bahasa Indonesia, 日本語, Polski, Ру́сский, Việt Nam and 简体中文.