


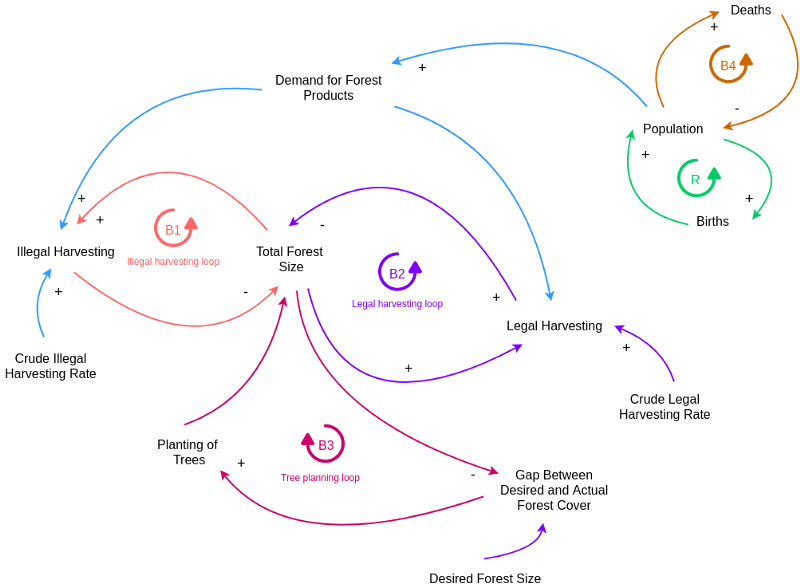
Causal loops diagrams (also known as system thinking diagrams) are used to display the behavior of cause and effect from a system’s standpoint. A causal loop diagram (CLD) is a causal diagram that aids in visualizing how different variables in a system are interrelated.
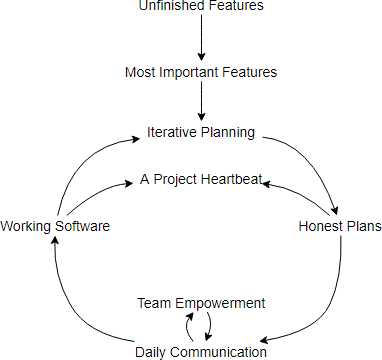
Edit the Cause Loop Diagram Example Online
- It is a causal diagram that aids in visualizing how different variables in a system are interrelated.
- It consists of a set of nodes and edges.
- It’s nodes represent the variables and edges are the links that represent a connection or a relation between the two variables.
- It’s link marked positive indicates a positive relation and a link marked negative indicates a negative relation.
- A positive causal link means the two nodes change in the same direction, i.e. if the node in which the link starts decreases, the other node also decreases.
- A negative causal link means the two nodes change in opposite directions, i.e. if the node in which the link starts increases, the other node decreases, and vice versa.
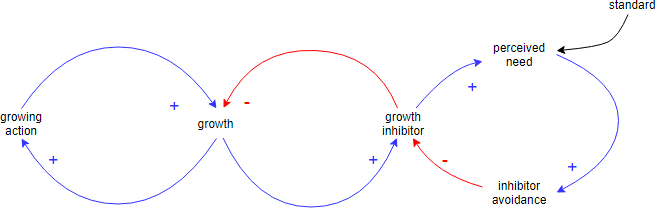
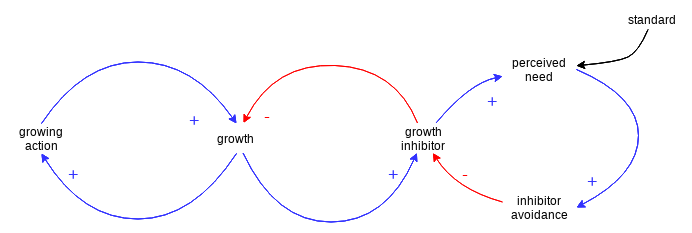
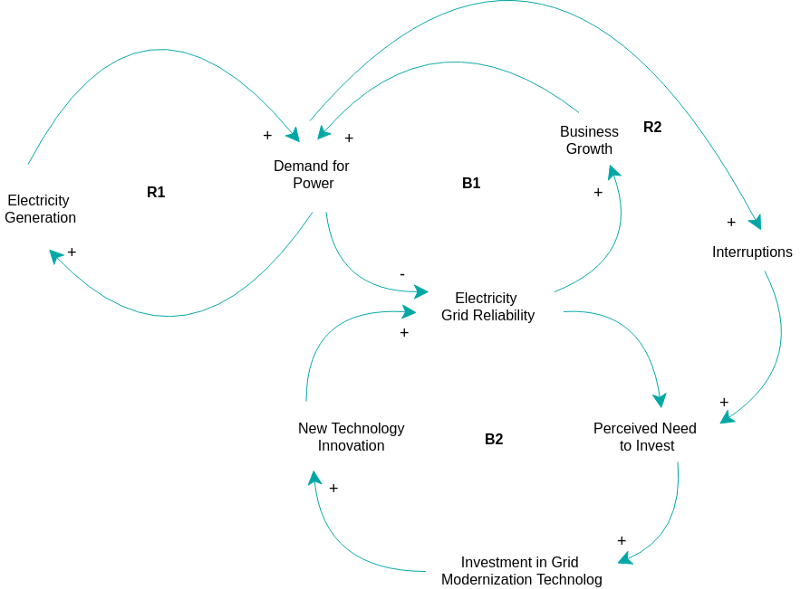
Cause Loop Diagram Example — Growth and Investment
A Growth and Under investment structure is simply an elaborated Limits to Growth structure where the growth inhibitor is part of another Balancing Loop with an external standard and some delay. The nasty thing about this structure is that the two balancing loops form a single reinforcing loop that inhibits growth.
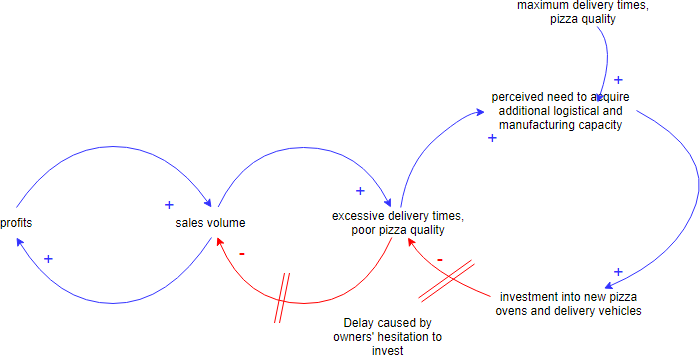
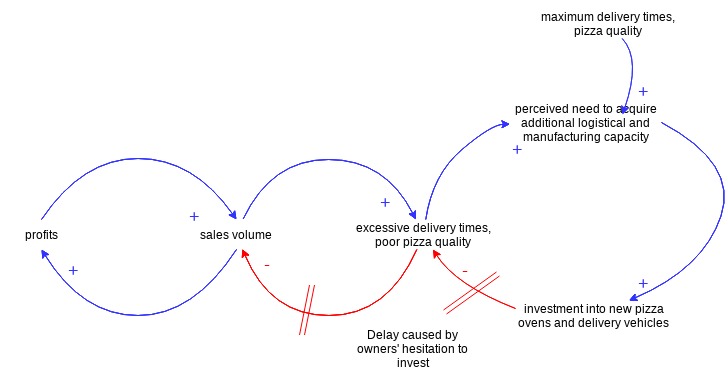
Cause Loop Diagram Example — Pizza House
A new home delivery-focused pizzeria opens up in the neighborhood. At first, the demand is low, but the pizza’s quality is excellent, as well as the delivery times. After a while, the pizzeria gets noticed and is featured in a local online food blog. As a result, the demand for pizza rises sharply. But the pizzeria owners are reluctant to purchase more delivery capacity (pizza delivery vehicles and personnel) along with higher pizza production capacity (additional pizza ovens). That results in higher delivery times and a larger percentage of undercooked pizzas, in turn lowering the number of returning customers. As a result, the pressure for additional investment in both delivery and production capacity is eliminated. The pizzeria owners are happy that they held off on the additional investment.
Online Tool for Creating Casual Loop diagrams
VP Online lets you create Causal Loop diagram, here is some examples for you to have deeper understanding of this topic.
Get a head-start of our own Causal Loop Diagrams by following some of these templates:
This post is also available in Deutsch, Español, فارسی, Français, English, Bahasa Indonesia, 日本語, Polski, Portuguese, Ру́сский, Việt Nam, 简体中文 and 繁體中文.