


Introduction
As a project manager who’s facilitated countless post-mortems and problem-solving sessions, I’ve seen my fair share of whiteboard sketches that vaguely resemble fish skeletons. But turning those messy brainstorming sessions into actionable, shareable root cause analysis has always been the hard part. That’s why I decided to put Visual Paradigm’s Cause and Effect Diagram (Fishbone/Ishikawa) tool through its paces. Over the past few weeks, I’ve tested both the traditional manual workflow and the new AI-powered generation features across Desktop, Online, and OpenDocs platforms. Here’s my honest, third-party review of what worked, what surprised me, and whether this tool deserves a spot in your problem-solving toolkit.

What Is a Cause and Effect (Fishbone) Diagram?
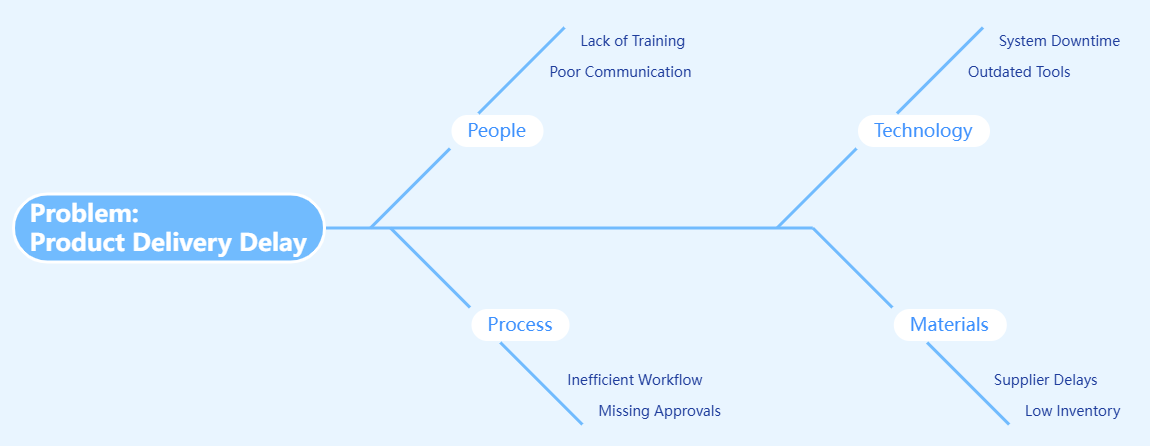
Before diving into the tool itself, a quick refresher: Cause and Effect Diagrams—commonly called Fishbone or Ishikawa diagrams—visually map potential factors contributing to a specific problem. The diagram resembles a fish skeleton: the “head” states the effect (the problem), the “spine” runs horizontally, and categorized “bones” branch off to represent contributing factors like People, Methods, Materials, Equipment, and Environment.
Originally developed by Dr. Kaoru Ishikawa at the University of Tokyo in 1943, this methodology remains invaluable for structured brainstorming, quality control, and systems analysis. The challenge has always been execution: keeping the diagram organized as ideas multiply. That’s where Visual Paradigm steps in.
My First Impressions: Auto-Layout That Just Works
One of my biggest pain points with diagramming tools is manual formatting. Spend 20 minutes brainstorming causes, and suddenly you’re dragging boxes, resizing lines, and realigning text. Visual Paradigm’s auto-layout feature was a genuine relief.
As I added primary and secondary causes, the “bones” automatically repositioned, and the fish body dynamically expanded or contracted. No manual alignment needed. For teams collaborating in real-time, this means less time formatting and more time analyzing.
Two Ways to Build: Traditional vs. AI-Powered
Traditional Modeling: Full Control, Step-by-Step
I started with the manual approach—ideal when you want granular control or are facilitating a live workshop. The workflow is intuitive:
- Define the effect (problem) on the right
- Select standard categories (Methods, Materials, People, etc.)
- Add primary causes as main bones
- Drill down with secondary/tertiary causes using “Why?” analysis
This method shines when your team needs to debate each connection or when causes don’t fit standard categories.
AI-Powered Generation: Speed Meets Structure
Then I tried the AI generator. I typed: “Project delays due to unclear requirements, resource constraints, and communication gaps.” Within seconds, the tool produced a structured fishbone diagram with categorized causes, logical branching, and even suggested sub-causes I hadn’t considered.

The AI didn’t replace critical thinking—it accelerated the setup phase. I could then refine, reorder, or expand branches manually. For rapid prototyping or when jumping into a new problem area, this is a game-changer.
Platform Walkthrough: Where I Used It
Visual Paradigm Desktop
The installed application feels robust and responsive. I appreciated the offline capability and deep customization options. The AI Diagram Generator lives under the Tools menu, making it easy to switch between manual and AI-assisted modes. Syncing with cloud projects requires an active maintenance license, but once configured, changes propagate seamlessly.
Visual Paradigm Online
Accessed via browser, this zero-install option is perfect for quick sessions or when working across devices. The dedicated AI Fishbone Maker and Smartboard mode (where typed outlines auto-convert to diagrams) felt particularly agile. I used this for a remote workshop, and participants could comment directly on diagram elements.
OpenDocs Integration
This was my favorite discovery. OpenDocs, Visual Paradigm’s AI-powered knowledge management tool, lets you embed fishbone diagrams directly into documentation pages.
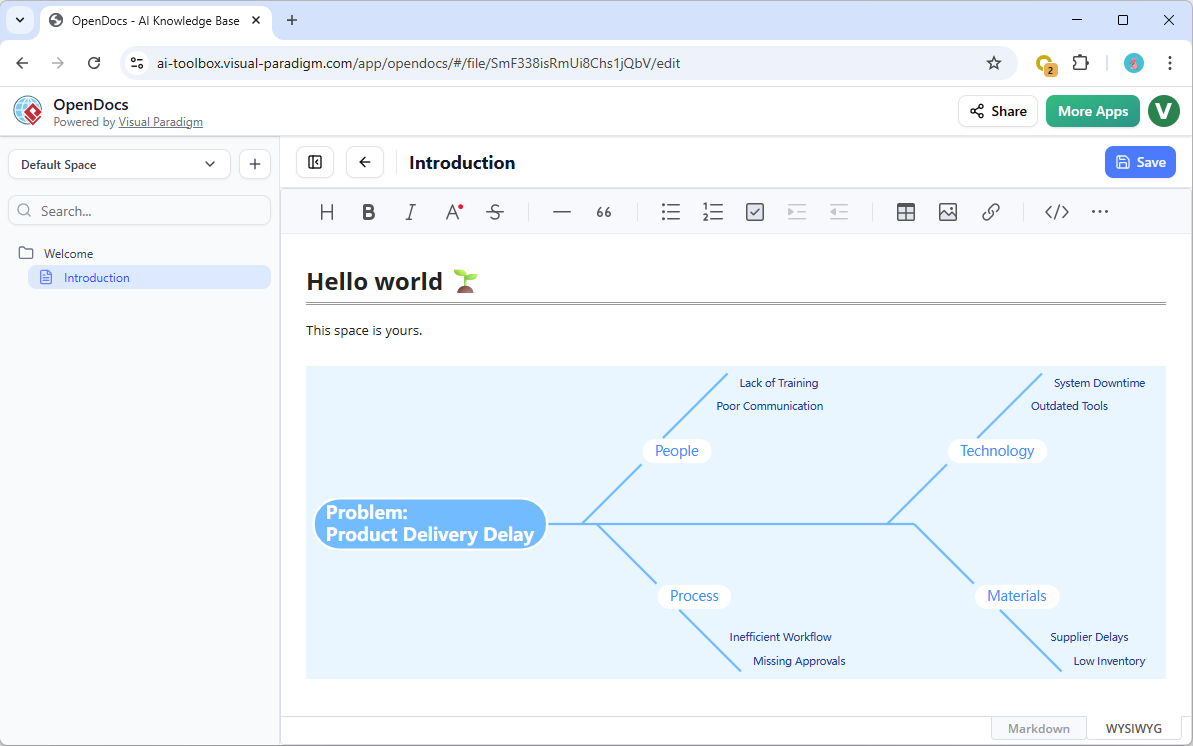
Instead of exporting diagrams as images and losing interactivity, I could keep the live, editable fishbone alongside meeting notes, action items, and follow-up analyses. For audit trails or stakeholder reporting, this contextual integration is invaluable.
Step-by-Step: Creating My First Fishbone Diagram (Desktop)
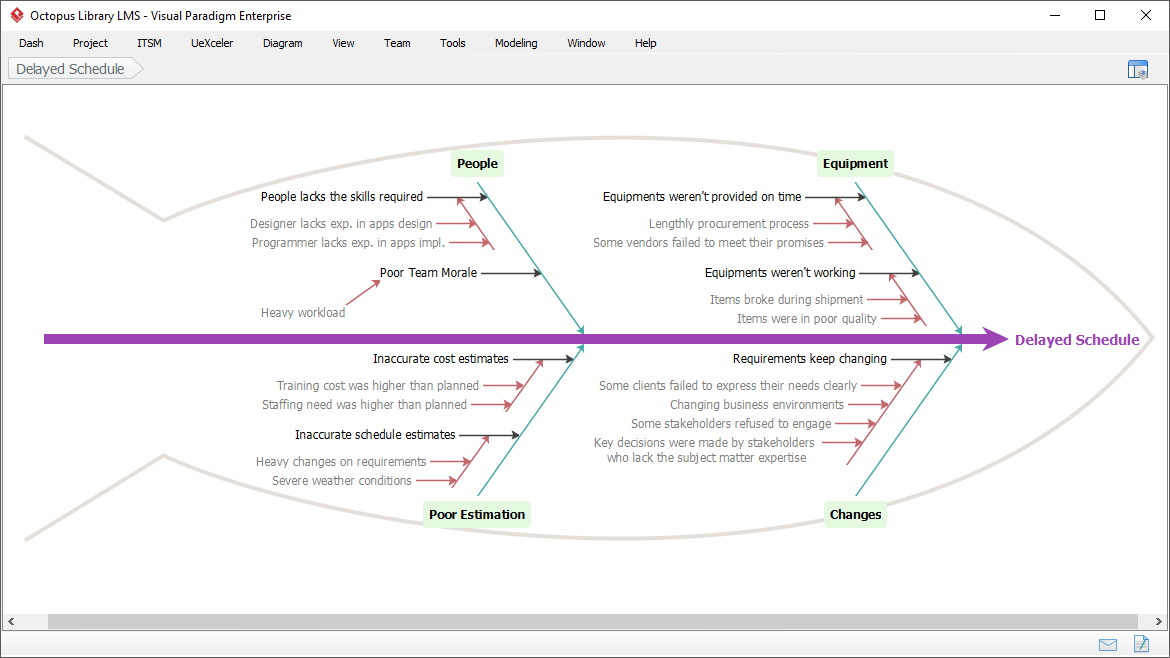
Here’s exactly how I built a diagram for a “Delayed Schedule” scenario:
- Click Diagram > New from the toolbar.
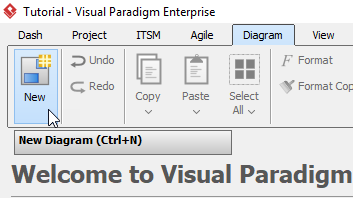
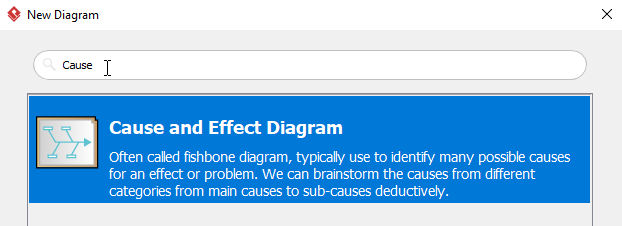
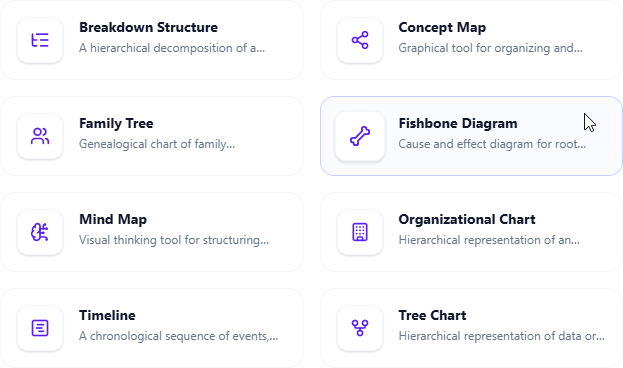
- In the New Diagram window, select Cause and Effect Diagram, then click Next. Use the search bar if needed.
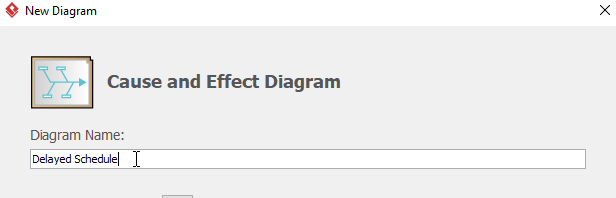
- Name the diagram (e.g., Delayed Schedule), then click OK.
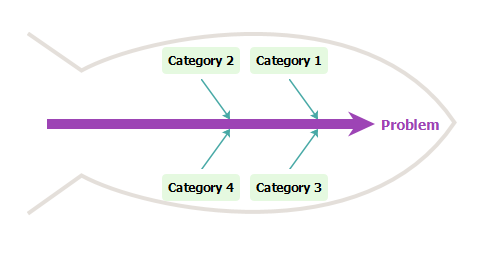
- You’ll see a starter template:
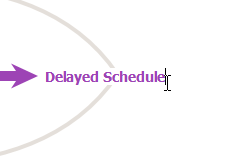
- Double-click problem on the right and rename it (e.g., Delayed Schedule).
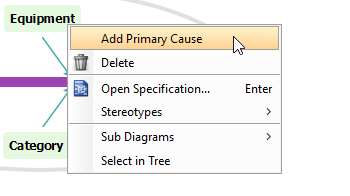
- Double-click Category1 to rename it (e.g., Equipment).
- Right-click Equipment and select Add Primary Cause to create a new cause branch.
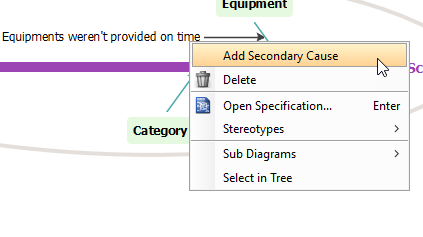
- Rename the cause (e.g., Equipments weren’t provided on time), then right-click it and select Add Secondary Cause for deeper analysis.
- Continue adding and renaming causes until your analysis feels complete.
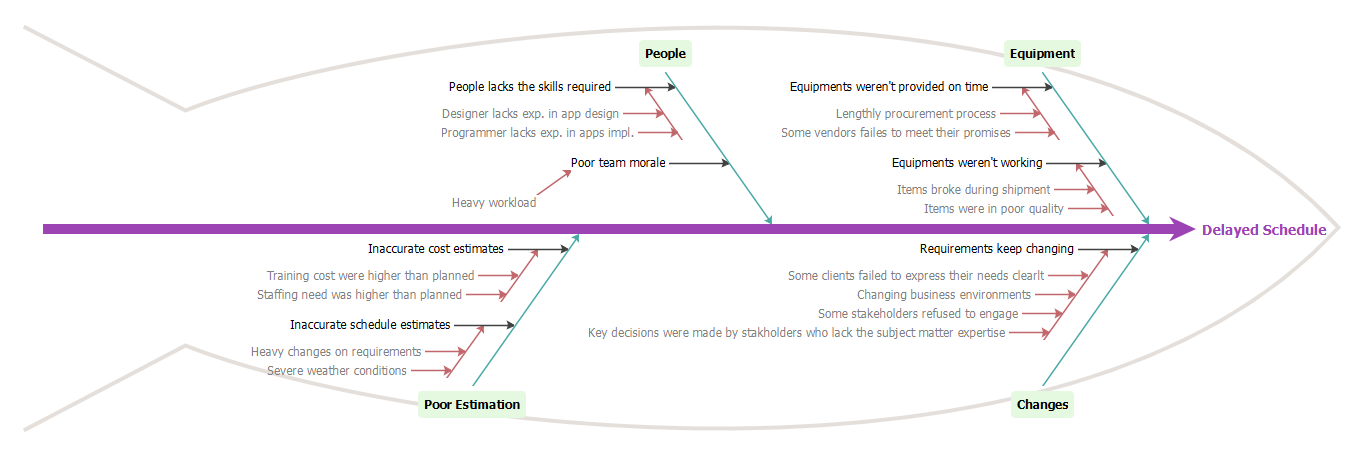
- Final result:
Creating Fishbone Diagrams in OpenDocs
As Part of a Document Page
- Open your page in OpenDocs and click Edit.
- Place your cursor where the diagram should appear.
- Click the Insert button in the toolbar.
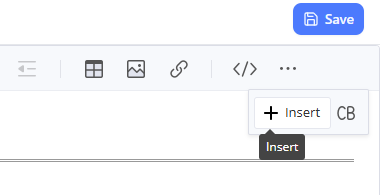
- Select Mind Maps > Fishbone Diagram.
- Edit your diagram directly in the embedded editor.
- Click Save, then Close to return to your document.
As an Independent Component
- In the table of contents pane, click + > New Component Page.
- Select Mind Maps > Fishbone Diagram.
- Build and save your analysis as a standalone, linkable component.
Pros and Cons: My Honest Assessment
✅ What I Loved
- Auto-layout: Saves significant formatting time; diagrams stay clean as complexity grows.
- AI Generation: Turns vague problem statements into structured starting points in seconds.
- Cross-Platform Sync: Work on Desktop, review on Mobile, embed in OpenDocs—consistent experience.
- OpenDocs Integration: Keeps analysis contextualized with project documentation, not siloed.
- Professional Output: Export-ready diagrams for presentations, reports, or stakeholder reviews.
⚠️ Considerations
- Learning Curve: New users may need 15–20 minutes to grasp the interface (though tutorials help).
- AI Refinement Needed: Generated diagrams are strong starting points but often require human validation and customization.
- Licensing: Full cross-platform sync and AI features require Professional Edition or Combo Edition licenses.
Who Should Use This Tool?
- Project Managers running retrospectives or risk assessments
- Quality Engineers conducting root cause analysis for defects
- Consultants facilitating client workshops remotely or in-person
- Product Teams documenting technical debt or feature blockers
- Students & Educators teaching systems thinking or problem-solving frameworks
If your workflow involves recurring problem analysis, documentation, and team collaboration, Visual Paradigm’s fishbone toolset is worth evaluating.
Conclusion
After weeks of testing, I can confidently say Visual Paradigm has elevated the humble fishbone diagram from a whiteboard sketch to a dynamic, AI-enhanced analysis tool. The auto-layout alone solves a decades-old formatting headache, while the AI generator accelerates the “blank page” phase of problem-solving. But what truly sets this suite apart is the OpenDocs integration—keeping root cause analysis living alongside project documentation, not trapped in a separate file.
Is it perfect? No tool is. But for teams serious about structured problem-solving, Visual Paradigm offers a rare combination: the rigor of traditional Ishikawa methodology, the speed of modern AI, and the flexibility of cloud-native collaboration. Whether you’re debugging a software release, analyzing a supply chain disruption, or planning a process improvement initiative, this tool helps turn brainstorming into breakthroughs.
If you’re ready to visualize your next root cause analysis, I’d recommend starting with the free trial of Visual Paradigm Online to test the AI generator, then exploring OpenDocs if documentation integration matters to your workflow.
References
- Cause and Effect Diagram Software (Fishbone Tool) | Visual Paradigm: Official product page detailing Visual Paradigm’s cause and effect diagram tool features, auto-layout capabilities, and traditional creation workflow.
- New AI Powered Fishbone Diagram Generator | Visual Paradigm: Announcement of AI-powered fishbone diagram generation capabilities integrated into Visual Paradigm’s diagram generator.
- AI Fishbone Diagram Generator: Uncover Root Causes in Seconds: Blog post explaining how the AI fishbone generator helps teams quickly identify and organize root causes from simple text prompts.
- How to Create a Fishbone Diagram Tutorial: Step-by-step tutorial guide for manually creating fishbone diagrams in Visual Paradigm.
- Why Every Team Needs an AI Diagram Maker for Faster Project Kickoff: Article discussing the benefits of AI-powered diagramming tools for accelerating project planning and analysis.
- Fishbone Diagram Root Cause Analysis Now in OpenDocs: Release notes announcing Fishbone Diagram support within Visual Paradigm’s OpenDocs knowledge management platform.
- Visual Paradigm Desktop vs. VP Online: A Comprehensive Guide: Third-party comparison guide covering differences between Visual Paradigm’s desktop and online offerings.
- YouTube Tutorial: Creating Fishbone Diagrams: Video walkthrough demonstrating fishbone diagram creation techniques in Visual Paradigm.
- YouTube Tutorial: Advanced Fishbone Features: Video guide covering advanced features and customization options for fishbone diagrams.
- Visual Paradigm Licensing and Sync Options: Official page detailing licensing options and synchronization capabilities between Visual Paradigm platforms.
This post is also available in Deutsch, Español, فارسی, Français, English, Bahasa Indonesia, 日本語, Polski, Portuguese, Ру́сский, Việt Nam, 简体中文 and 繁體中文.