


Introduction
In the fast-paced world of modern software development, there is often a tension between rigorous systems analysis and the rapid iteration demanded by Agile methodologies. Teams frequently skip foundational modeling, fearing it will slow down delivery. However, skipping the “blueprint” phase often leads to scope creep, misunderstood requirements, and costly rework. The Data Flow Diagram (DFD) remains one of the most effective tools for bridging this gap, providing a clear, visual language for how information moves through a system.
This guide explores the practical application of Yourdon DeMarco notation for DFDs, using a classic Video Rental Shop case study. More importantly, we examine why integrating AI-assisted tooling, specifically Visual Paradigm, is not just a convenience but a strategic advantage for Agile teams striving to maintain high-quality documentation without sacrificing velocity.
Key Concepts: The Yourdon DeMarco Notation
Before leveraging AI or agile workflows, one must master the vocabulary of the DFD. The Yourdon DeMarco notation is favored for its readability and distinct separation of concerns. It relies on four core symbols:
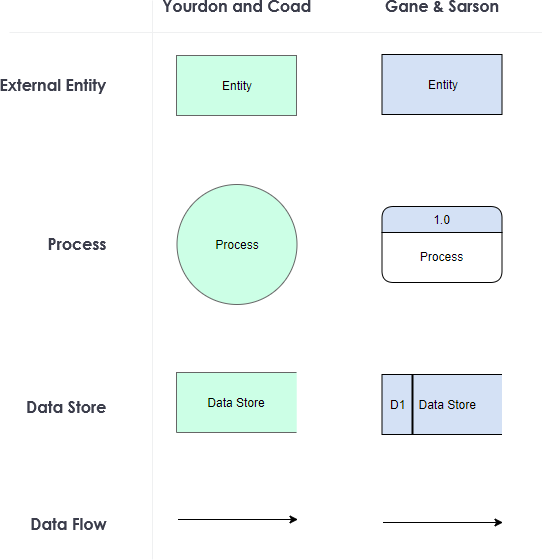
Processes (Circles): Represent transformations or business logic. They take input data, apply rules, and produce output. In hierarchical modeling, these are numbered (e.g., 1.0, 1.1) to allow decomposition into lower-level diagrams.
-
External Entities (Rectangles): Actors outside the system boundary that initiate or receive data. These can be customers, suppliers, regulatory bodies, or external APIs. They define the scope of your system.
-
Data Stores (Open-ended Rectangles): Repositories for persistent data. Depicted as a rectangle with two parallel lines on one side, they represent databases, files, or cloud storage. Crucially, data stores are passive; they only hold data, never transform it.
-
Data Flows (Arrows): The pathways of information. Every arrow must be labeled with specific data content (e.g., “Customer Details,” not just “Data”). Flows connect entities to processes, processes to stores, and processes to each other.
Practical Application: Deconstructing the Video Rental Shop
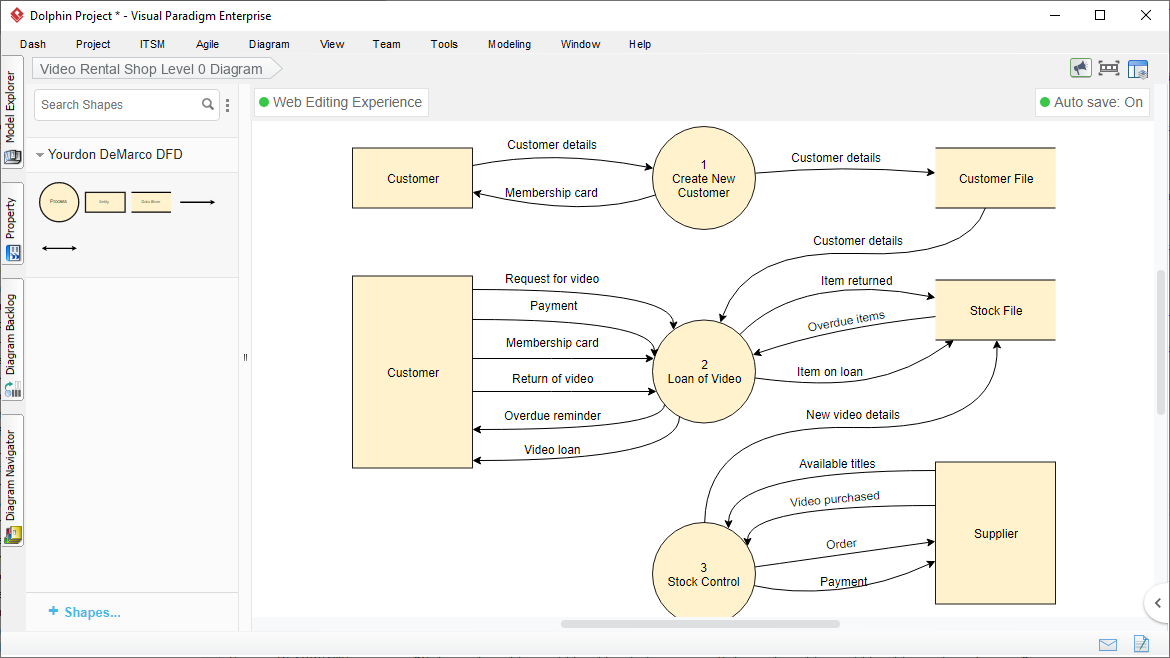
The Level 0 diagram above serves as a perfect pedagogical example of these concepts in action. It models the entire video rental business at a high level of abstraction.
External Entities and Data Stores
The system interacts with two primary actors: the Customer (who rents videos and registers) and the Supplier (who provides inventory). Internally, the system relies on two critical repositories: the Customer File (member records) and the Stock File (inventory status).
Core Business Processes
-
Process 1: Create New Customer. Handles onboarding. Input: “Customer details.” Output: “Membership card” to the customer and updated records to the Customer File.
-
Process 2: Loan of Video. The transactional heart. Inputs: “Request for video” and “Payment.” The process queries the Stock File for availability (“Item on loan”) and outputs a “Video loan” confirmation while updating stock status.
-
Process 3: Stock Control. Manages supply chain. Monitors “Available titles” in the Stock File, generates an “Order” for the Supplier when low, and ingests “Video purchased” data to update the Stock File with “New video details.”
Why AI-Assisted DFDs Are Super Relevant to Agile Teams
Agile teams often resist traditional modeling because manual diagramming is perceived as a bottleneck. AI-assisted features in modern platforms like Visual Paradigm fundamentally change this equation, making DFDs compatible with sprint-based delivery.
1. Accelerating Refinement and Backlog Grooming
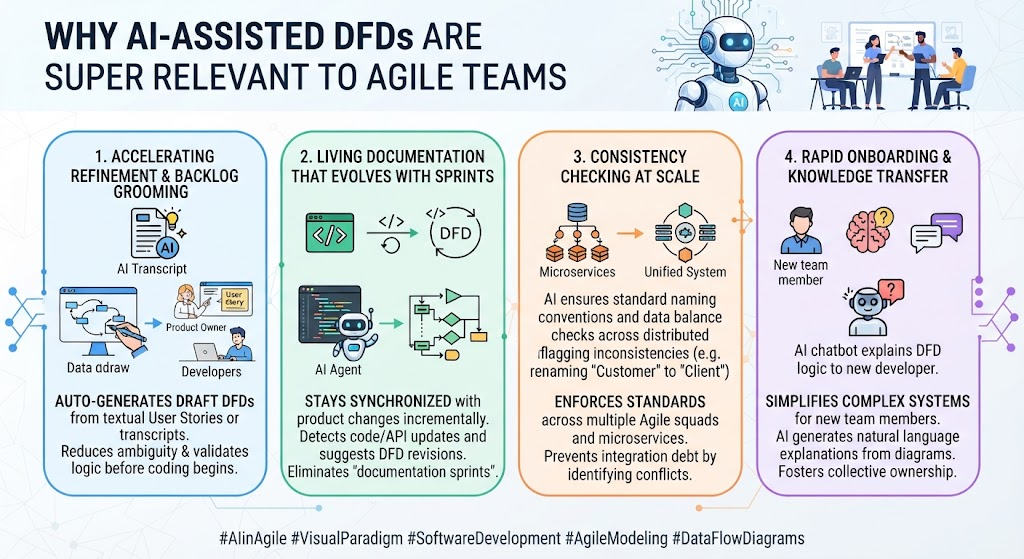
In Agile, user stories often lack systemic context. AI can analyze textual user stories or meeting transcripts and auto-generate draft DFDs. This gives Product Owners and developers an immediate visual baseline to validate during refinement sessions, reducing ambiguity before code is written. Instead of spending hours drawing circles, the team spends minutes validating AI-generated logic.
2. Living Documentation That Evolves With Sprints
Static diagrams die the moment they are published. AI-assisted tools can detect changes in code or API specifications and suggest updates to existing DFDs. For Agile teams, this means documentation stays synchronized with the product incrementally, rather than requiring massive “documentation sprints” at the end of a release cycle.
3. Consistency Checking at Scale
Agile teams often have multiple squads working on different microservices or modules. AI can enforce naming conventions and balance checks across distributed diagrams automatically. If Squad A renames “Customer Details” to “Client Profile,” AI can flag inconsistencies in related processes managed by Squad B, preventing integration debt from accumulating silently.
4. Rapid Onboarding and Knowledge Transfer
High turnover or scaling teams face significant knowledge transfer costs. AI can generate natural language explanations from complex DFDs, allowing new team members to understand system architecture through conversational Q&A rather than deciphering dense diagrams alone. This aligns perfectly with Agile’s emphasis on sustainable pace and collective ownership.
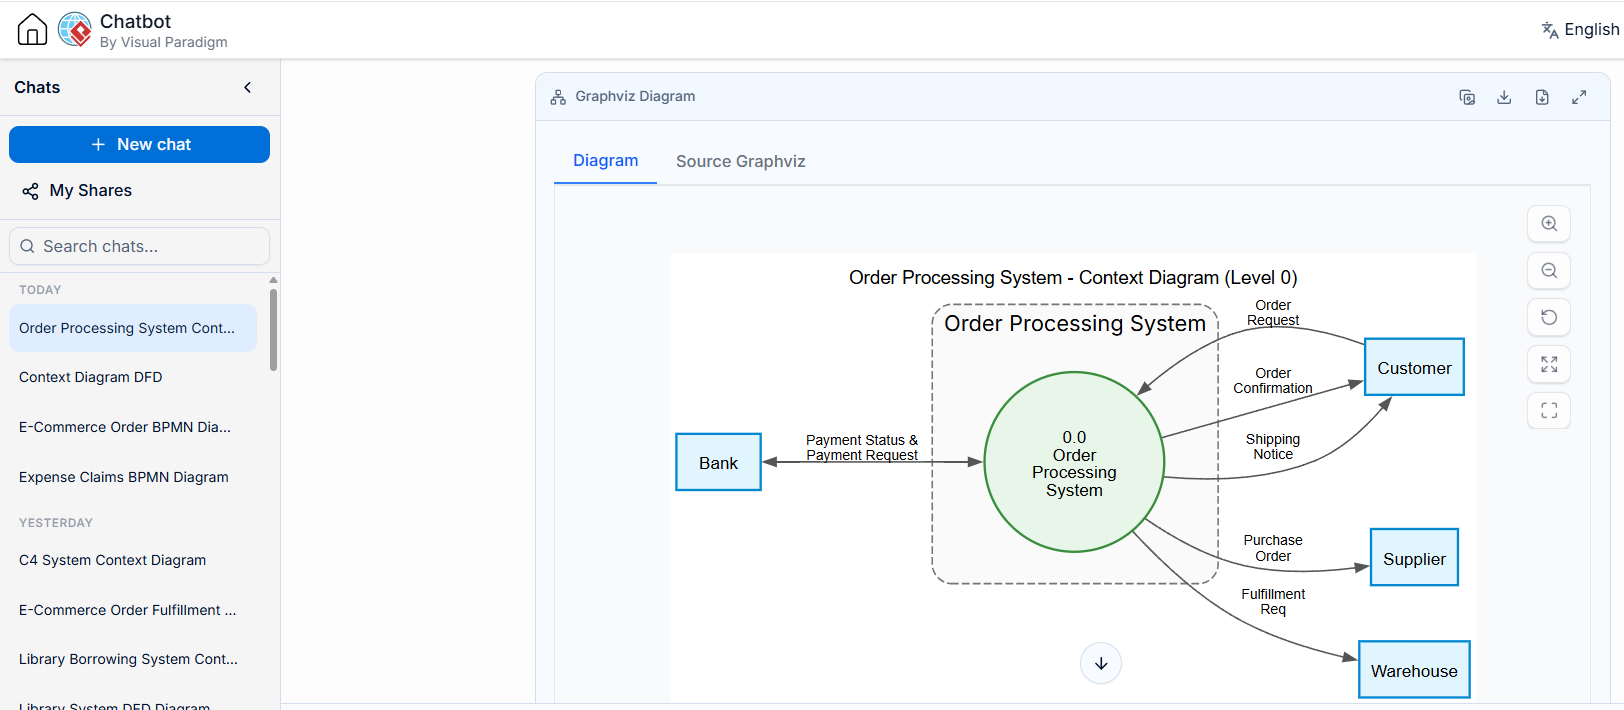
Visual Paradigm AI Chatot DFD Generation – Level 0 Context Diagram Example
Visual Paradigm AI Chatot DFD Refinement – Level 1 DFD Example
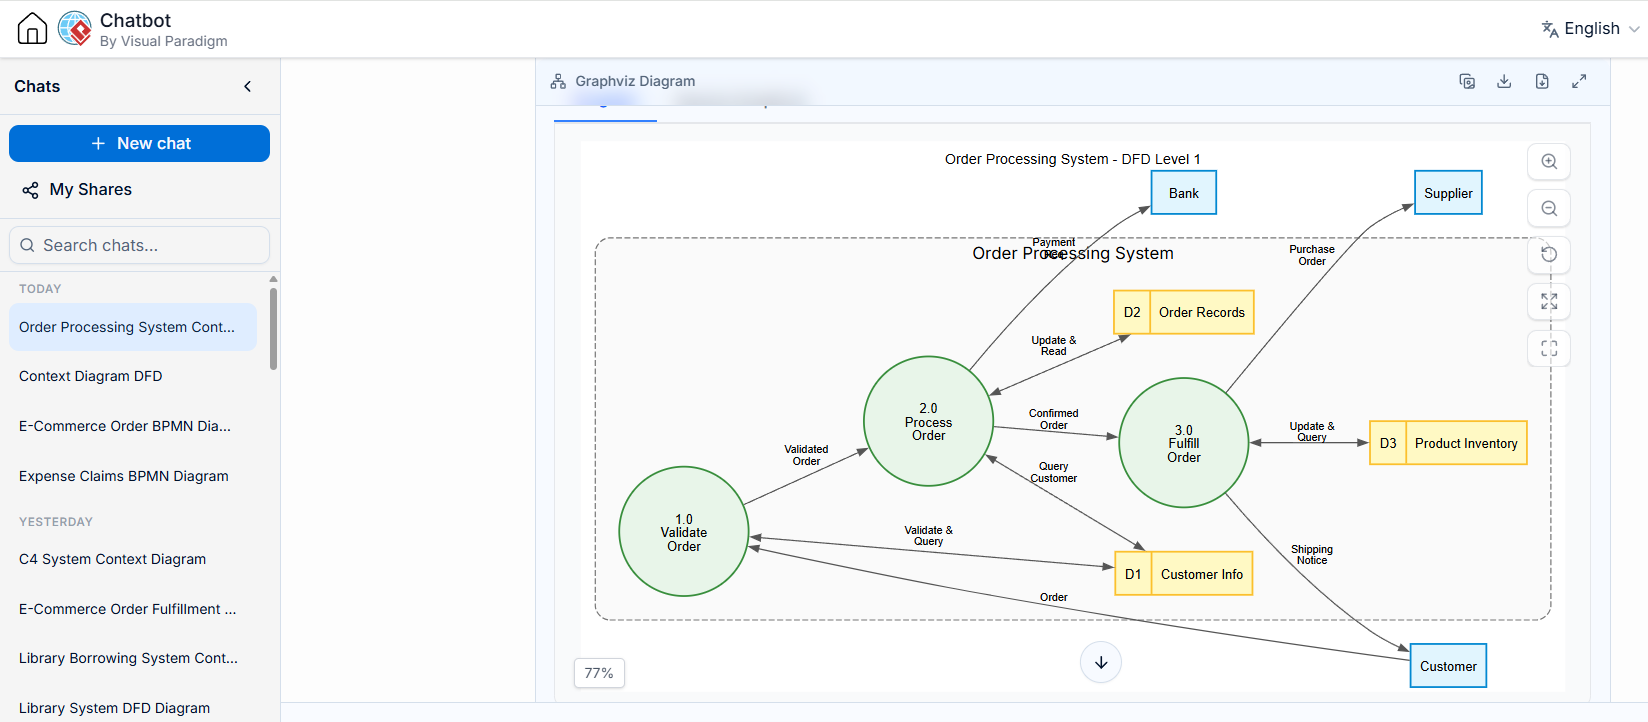
Graphviz Dot – Diagram as Code for DFD
Streamlining Workflow with Visual Paradigm
Creating professional, standards-compliant DFDs manually is error-prone and time-consuming. Visual Paradigm addresses these challenges through purpose-built features that complement AI assistance:
-
Drag-and-Drop Efficiency: Pull Yourdon DeMarco symbols directly from a palette onto a smart canvas. No manual shape formatting required.
-
Alignment Guides and Smart Connectors: Ensure professional aesthetics automatically. Orthogonal routing keeps data flows clean, and alignment guides maintain visual hierarchy—critical when presenting to stakeholders.
-
Multi-Notation Support: Switch between Yourdon DeMarco, Gane-Sarson, or UML activity diagrams instantly. This flexibility allows teams to use the notation that best fits their audience or legacy system requirements.
-
Integrated AI Assistant: Leverage built-in AI to generate initial diagrams from text descriptions, validate model completeness, and export documentation in multiple formats. The AI doesn’t replace the analyst; it amplifies their ability to focus on business logic rather than pixel-pushing.
Tips for Effective Diagramming (Enhanced by Tooling)
-
Label Everything: Use Visual Paradigm’s validation features to catch unlabeled flows before review.
-
Balance Your Flows: Let AI check input/output consistency across process hierarchies.
-
Use Consistent Naming: Utilize the tool’s data dictionary feature to enforce terminology globally. When you rename a data element in one place, it propagates everywhere.
Conclusion
Data Flow Diagrams are not relics of waterfall past; they are vital instruments for clarity in complex systems. The Yourdon DeMarco notation provides a timeless grammar for expressing data movement, as demonstrated by the Video Rental Shop example. However, the true power of DFDs in 2026 lies in their synergy with AI-assisted tooling.
For Agile teams, platforms like Visual Paradigm transform DFDs from burdensome artifacts into dynamic, living assets. By automating the mechanical aspects of diagramming and augmenting analysis with intelligent validation, teams can achieve the rigor of traditional systems analysis at the speed of Agile. The result is software that is not only delivered faster but is also better understood, more maintainable, and aligned with actual business needs. Embrace the diagram, empower it with AI, and let your Agile delivery thrive on a foundation of clarity.
This post is also available in Deutsch, Español, فارسی, Français, Bahasa Indonesia, Polski, Portuguese and Việt Nam.
Related posts:
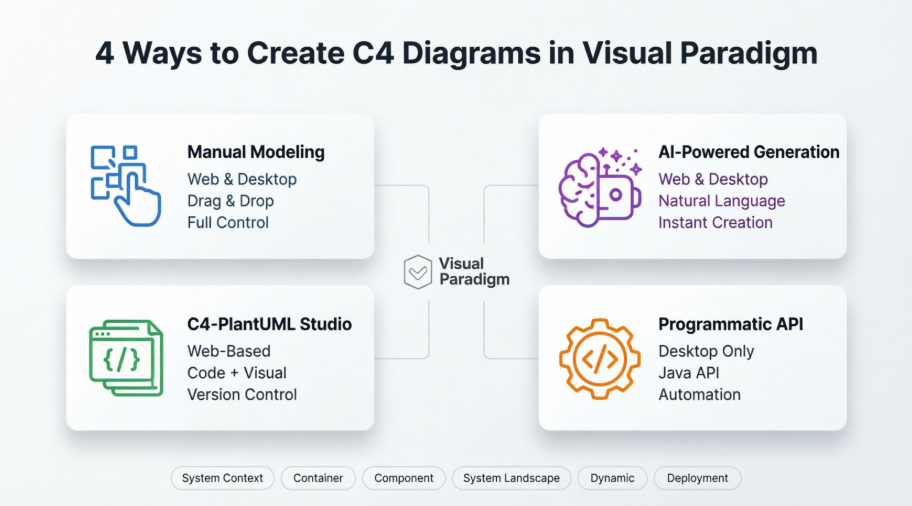 Mastering C4 Diagrams in Visual Paradigm: A Hands-On Review of All Four Creation Methods
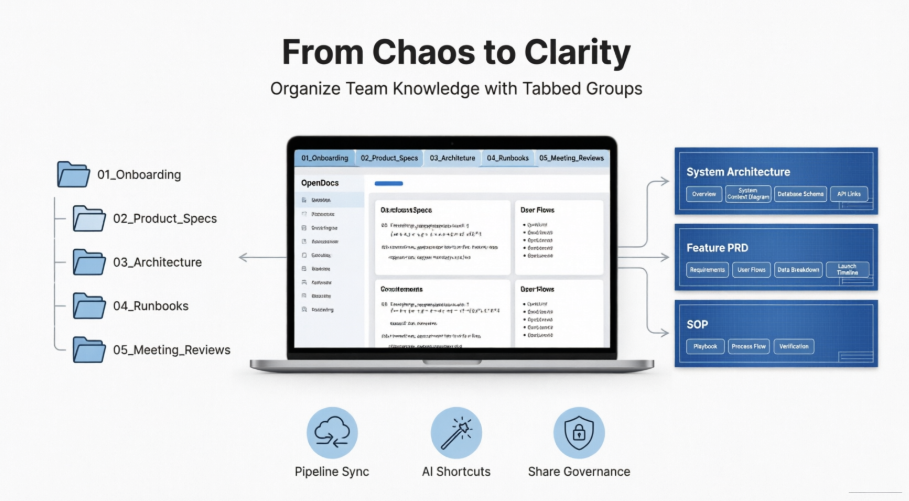 Smarter Documentation with OpenDocs’ Tabbed Groups
 From Idea to Diagram in Seconds: My Hands-On Review of Visual Paradigm’s AI Chatbot for Visual Modeling
Comprehensive Guide: Diagram Generation Methods in Visual Paradigm
From Idea to Diagram in Seconds: My Hands-On Review of Visual Paradigm’s AI Chatbot for Visual Modeling
Comprehensive Guide: Diagram Generation Methods in Visual Paradigm