


Business Process Model and Notation, commonly known as BPMN, serves as the universal language for describing workflows. Whether you are a project manager, a business analyst, or a developer, visualizing how work moves through an organization is critical. Without a clear map, processes become opaque, leading to inefficiencies and errors. This guide provides a structured approach to understanding the core concepts of BPMN and executing a basic process map in a short timeframe.
The goal here is not to create a complex enterprise system, but to establish a clear visual representation of a specific activity. By the end of this session, you will have a functional diagram that clarifies roles, decisions, and actions. This foundation is essential for automation, compliance, and continuous improvement.
📐 What is BPMN and Why Use It?
BPMN is a standard maintained by the Object Management Group (OMG). It defines a graphical notation that is readable by both business stakeholders and technical teams. Unlike proprietary flowcharting methods, BPMN uses a consistent set of symbols that convey specific meanings universally.
Using this standard offers several distinct advantages:
- Clarity: Ambiguity in text descriptions is reduced when actions are visualized.
- Communication: Technical teams and non-technical staff can review the same diagram and understand the intent.
- Automation: Many workflow engines can interpret BPMN diagrams directly, reducing the gap between design and execution.
- Analysis: It becomes easier to spot bottlenecks, redundant steps, or missing decision points.
🧩 The Core Building Blocks of a Workflow
Before drawing lines and shapes, you must understand the containers and objects available. BPMN diagrams are hierarchical. You start with the broadest container and drill down into specific activities.
1. Pools and Lanes
A Pool represents a participant in a process, such as a company, a department, or an external system. It defines the boundary of the process. Inside a pool, you can draw Lanes. Lanes divide the pool to distinguish responsibilities.
- Pool: The overall container. Think of this as the “Company” or “System”.
- Lane: A subdivision within the pool. Think of this as “Sales Team” or “Finance Department”.
If a process involves multiple organizations (e.g., a customer and a vendor), you would typically use two separate pools. If the process stays within one organization but involves different departments, you use one pool with multiple lanes.
2. Flow Objects
Flow objects are the primary shapes used to depict the behavior of the process. They include events, activities, and gateways.
- Events: Circles that indicate something that happens. They have a start, middle, and end.
- Activities: Rounded rectangles that represent work being performed.
- Gateways: Diamonds that represent a decision or branching path.
3. Connecting Objects
Lines connect the flow objects to show the order of operations. The style of the line indicates the type of flow.
- Sequence Flow: A solid line with an arrow indicating the order of activities.
- Message Flow: A dashed line indicating communication between two participants (pools) or across lanes.
🎨 BPMN Symbols Reference Guide
Accuracy in mapping relies on using the correct symbols. Using a square for an event, for example, would confuse the reader. Below is a comprehensive table of the most common elements you will encounter.
| Category | Symbol Shape | Name | Purpose |
|---|---|---|---|
| Events | Circle (Thin line) | Start Event | Triggers the process. Nothing leads into this. |
| Events | Circle (Thick line) | End Event | Terminates the process. Nothing follows this. |
| Events | Circle (Double line) | Intermediate Event | Occurs during the process (e.g., waiting, error). |
| Activities | Rounded Rectangle | Task | Atomic work. Cannot be broken down further in this diagram. |
| Activities | Rounded Rectangle (with +) | Sub-Process | A group of tasks that can be expanded into a separate diagram. |
| Gateways | Diamond (X) | Exclusive Gateway | Decision point. Only one path is taken. |
| Gateways | Diamond (+) | Inclusive Gateway | Decision point. One or more paths may be taken. |
| Gateways | Diamond (&) | Parallel Gateway | Branches into multiple paths simultaneously. |
| Data | Cylinder | Data Store | Represents long-term storage (database, file). |
Understanding these shapes is the prerequisite for mapping. A common error is treating a decision point (Gateway) as a simple line. Remember, if the path splits based on a condition, a Gateway is required.
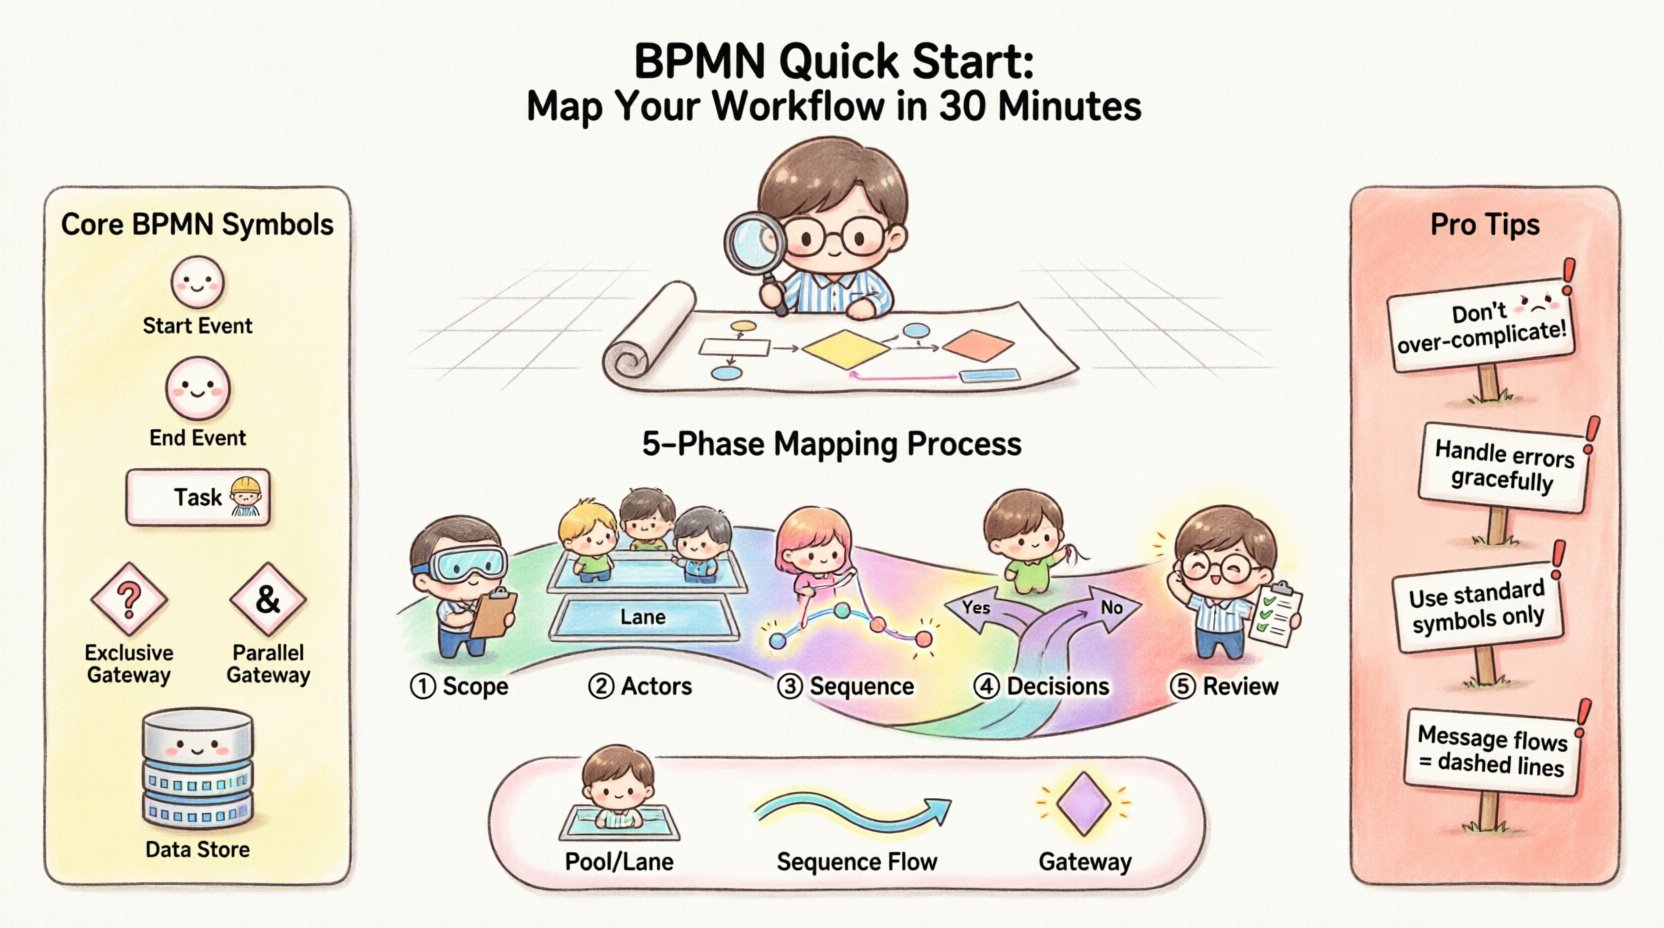
⏱️ Mapping Your First Workflow in 30 Minutes
You do not need hours to create a useful diagram. By following a disciplined structure, you can map a standard workflow in half an hour. This section breaks down the process into five distinct phases.
Phase 1: Define the Scope (5 Minutes)
Before opening your diagramming tool, write down the boundaries of the process. A process map that is too broad becomes unusable.
- Trigger: What starts this process? (e.g., A customer places an order).
- Goal: What is the final output? (e.g., The order is shipped).
- Exclusions: What is explicitly out of scope? (e.g., Manufacturing the product).
Write these three points on a sticky note or a blank document. Keep them visible while you draw.
Phase 2: Identify Actors and Responsibilities (5 Minutes)
Draw a Pool and divide it into Lanes. Assign a role to each lane. Do not use names like “John”; use titles like “Customer” or “Account Manager”. This ensures the diagram remains relevant if personnel changes.
- Customer: The external entity initiating the request.
- Sales: The internal team handling the order intake.
- Finance: The team approving payments.
If you are unsure who does what, mark that lane as “TBD” and note it for later. It is better to have a placeholder than to guess the responsibility.
Phase 3: Map the Sequence of Actions (10 Minutes)
Now, connect the dots. Start with the Start Event in the first lane.
- Draw the Start: Place a thin circle at the top of the first lane.
- Add the First Task: Draw a rounded rectangle connected to the start event.
- Follow the Line: Draw a sequence flow to the next activity.
- Move Across Lanes: If a task is performed by a different role, draw the shape in that specific lane and connect it via a sequence flow.
Tip: Keep the flow top-to-bottom or left-to-right. Do not let lines cross unnecessarily. If lines must cross, ensure there is no ambiguity about which path is being followed.
Phase 4: Add Decisions and Gateways (5 Minutes)
Most workflows involve choices. Where does the process branch?
- Approval Required? If a request needs a yes/no decision, use an Exclusive Gateway.
- Multiple Outcomes? If a task can lead to different states (e.g., “Low Priority” or “High Priority”), use an Inclusive Gateway.
- Parallel Work? If two tasks happen at the same time (e.g., “Notify Customer” and “Update Inventory”), use a Parallel Gateway.
Label every outgoing line from a Gateway with the condition that leads to that path (e.g., “Approved”, “Rejected”, “Yes”, “No”). This is a critical requirement for clarity.
Phase 5: Review and Close (5 Minutes)
Finally, ensure every path leads to an End Event. A common issue is “orphaned paths” where a decision leads to nowhere. Also, check for infinite loops.
- Check Traps: Do all paths eventually end?
- Check Logic: Does the diagram match the reality of how the work is done?
- Validate: Ask a stakeholder to look at the map. Can they follow it without explanation?
Save your work. This document is now a living asset that represents the current state of the process.
🚧 Common Mistakes to Avoid
Even experienced modelers make errors. Being aware of these pitfalls will save you time during the review process.
1. Over-Complicating the Diagram
Do not try to capture every single detail in one view. If a process is complex, break it down. Use a Sub-Process to group a complex set of activities and link to a separate, detailed diagram. This keeps the high-level map readable.
2. Ignoring Error Handling
Real-world processes are not always perfect. What happens if a payment fails? What if a system is down? While you might not map every error in a quick start, acknowledging that exceptions exist is important. You can use an Intermediate Error Event to show where an exception would interrupt the flow.
3. Mixing Notations
Stick to standard BPMN shapes. Do not use a star for a decision or a triangle for a task unless you define it in a legend. Standardization ensures that anyone familiar with the standard can read your work immediately.
4. Forgetting the Message Flow
If you are modeling interactions between two different organizations (two different Pools), you must use a dashed line with an open arrow to represent a Message Flow. Using a solid line implies a direct sequence, which is technically incorrect when crossing organizational boundaries.
📈 Best Practices for Process Documentation
Once you have created your first map, consider these guidelines to maintain its value over time.
- Version Control: Processes change. Date your diagrams. Keep a record of versions so you can track evolution.
- Metadata: Include the author, date of creation, and the version of the BPMN standard used (e.g., BPMN 2.0) in the diagram properties.
- Color Coding: While BPMN is standard, you can use color to indicate status (e.g., Red for high risk, Green for low risk). However, do not rely on color alone for meaning.
- Regular Audits: Schedule a review every quarter or whenever a major system change occurs. A diagram that is six months old may already be inaccurate.
🛠️ Tools for Modeling
You do not need expensive software to begin. There are various options available depending on your needs.
- Cloud-Based Editors: Many online platforms offer drag-and-drop interfaces that support standard BPMN shapes. These are accessible from any browser.
- Desktop Applications: Some tools allow offline work, which is useful for sensitive data or environments with limited internet access.
- Integration: Some modeling tools allow you to export diagrams as executable code or import them into workflow engines. Check compatibility if you plan to automate the process later.
Regardless of the tool you choose, the logic remains the same. The software is merely a canvas; the value lies in the structured thinking required to fill it.
🔄 From Mapping to Improvement
Creating a diagram is not the end goal. It is the starting point for optimization. Once the current state is mapped, you can identify inefficiencies.
Look for:
- Wait Times: Are there gaps between activities where nothing happens?
- Redundancy: Is the same data entered multiple times by different people?
- Complexity: Are there too many decision points that could be simplified?
After identifying issues, sketch a Future State diagram. This represents how the process should work ideally. The gap between the Current State and the Future State defines your improvement roadmap.
📝 Summary of Key Takeaways
To recap the essential elements of this quick start guide:
- BPMN provides a standardized visual language for workflows.
- Pools and Lanes define participants and responsibilities.
- Events, Activities, and Gateways are the core shapes for behavior.
- Sequence Flows connect tasks in order, while Message Flows connect participants.
- Start and End events define the boundaries of the map.
- Gateways handle decision logic and branching paths.
- Mapping should be done in phases: Scope, Roles, Sequence, Decisions, Review.
- Maintain the diagram as a living document that evolves with the business.
By following this structured approach, you can produce a professional-grade workflow map in a short period. This skill enhances your ability to communicate complex operations clearly and lays the groundwork for future automation efforts. Start with a simple process, apply these rules, and gradually increase complexity as your confidence grows.
This post is also available in Deutsch, Español, فارسی, Français, English, Bahasa Indonesia, 日本語, Polski, Portuguese, Ру́сский, Việt Nam, 简体中文 and 繁體中文.