
Introduction
In the fast-paced world of project management, clarity is currency. Whether you are launching a new software product, coordinating an academic research paper, or managing complex infrastructure deployments, understanding the sequence of tasks and their interdependencies is critical to success. Traditional project planning methods often involve manual drawing, static spreadsheets, or rigid software that struggles to adapt to real-time changes.
Enter the PERT Chart (Program Evaluation and Review Technique). A powerful visual tool that maps out task sequences, dependencies, and estimated durations, PERT charts have long been a staple for project managers seeking to identify critical paths and potential bottlenecks. However, creating them manually can be time-consuming and prone to error.
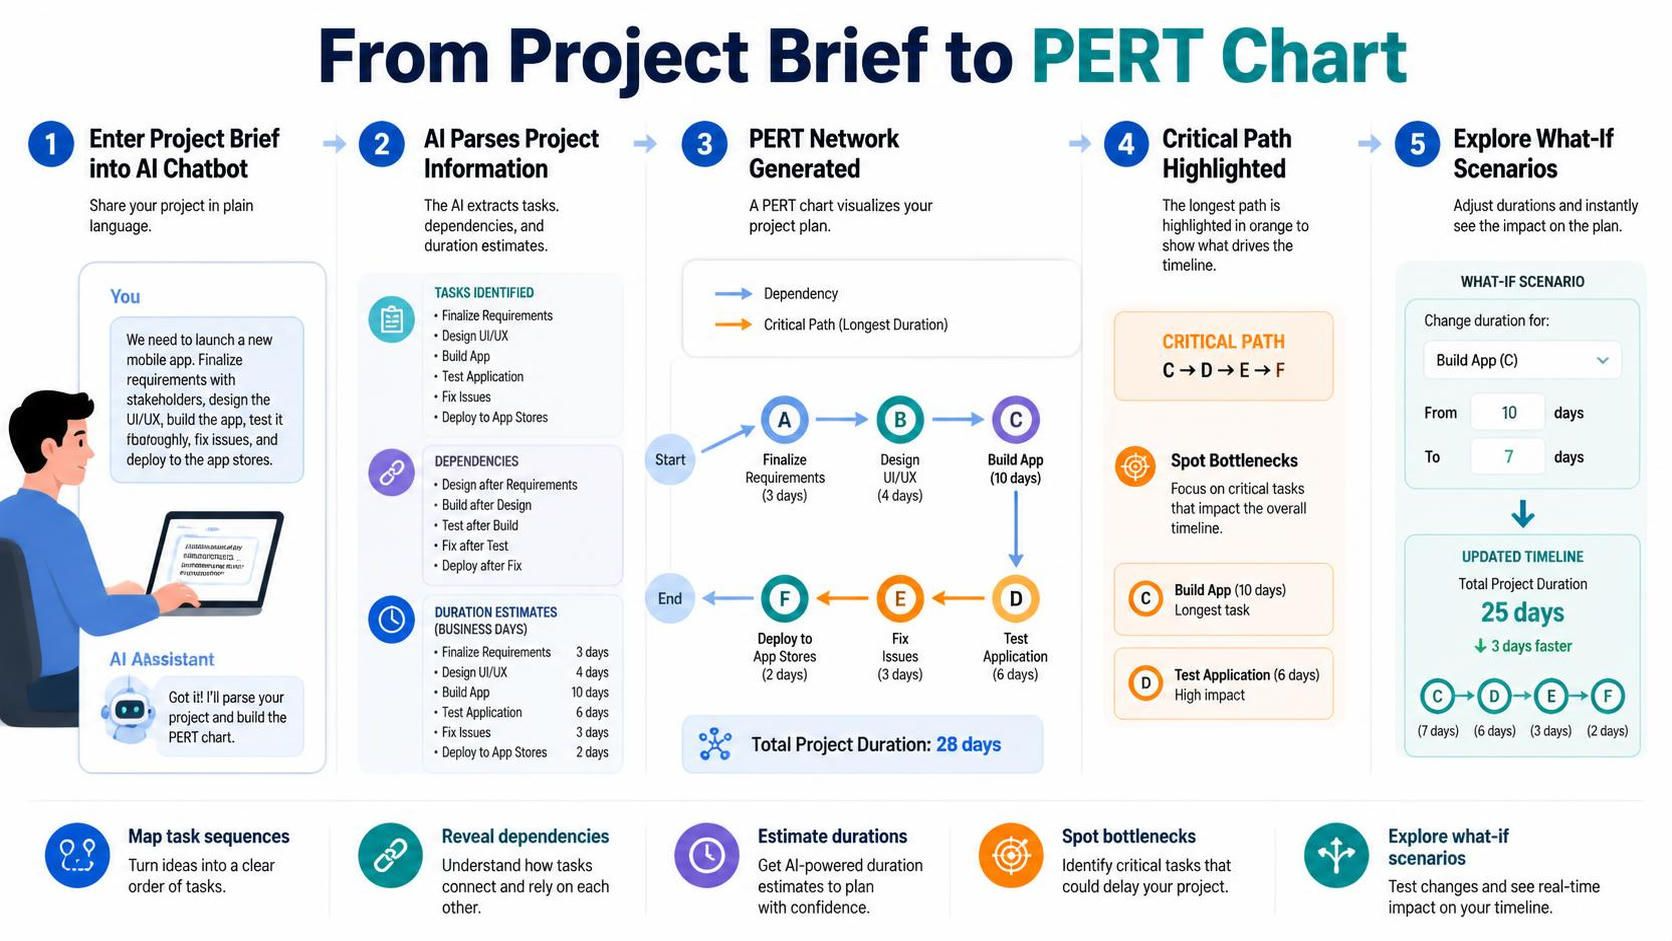
This guide explores how Visual Paradigm’s AI Chatbot revolutionizes this process. By leveraging artificial intelligence, you can transform simple text descriptions into structured, interactive PERT charts instantly. This approach not only saves time but also allows for dynamic exploration of “what-if” scenarios, ensuring your project timeline is both realistic and resilient.
What Is a PERT Chart?
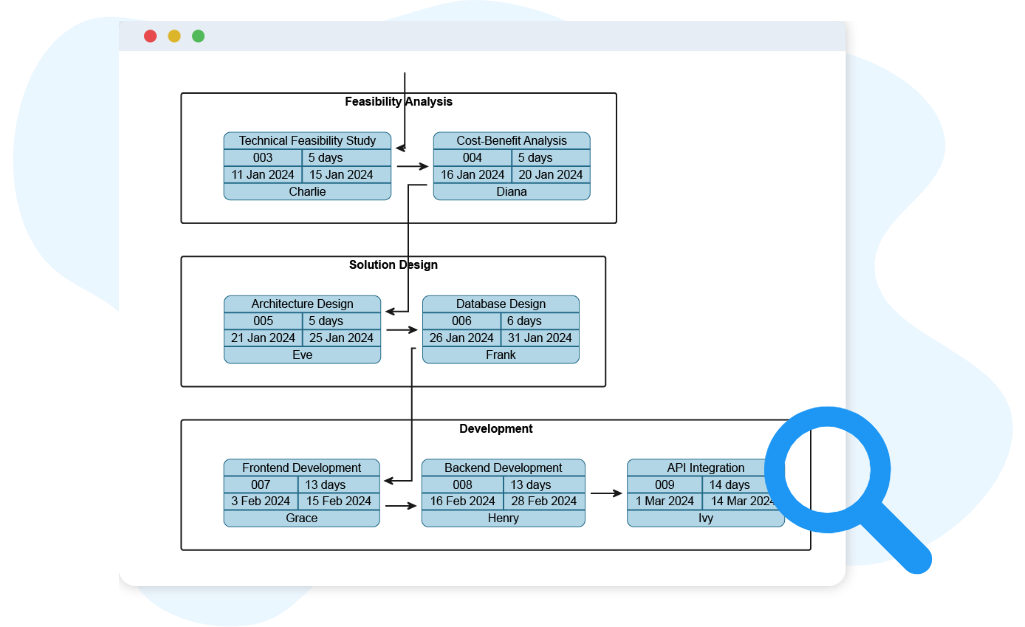
A PERT Chart is a project management diagram that visually represents the sequence of tasks required to complete a project. It shows the relationships between activities, the order in which they must be completed, and the estimated time for each step. By connecting events through arrows, it highlights the structure of a project from start to finish.
This diagram is especially useful when planning complex projects with uncertain timelines. It helps you identify dependencies, evaluate alternative paths, and estimate the earliest possible completion time. With a PERT Chart, you gain a clearer understanding of how each task contributes to the overall workflow.
Key Concepts
To effectively utilize PERT charts, it is essential to understand three core components:
-
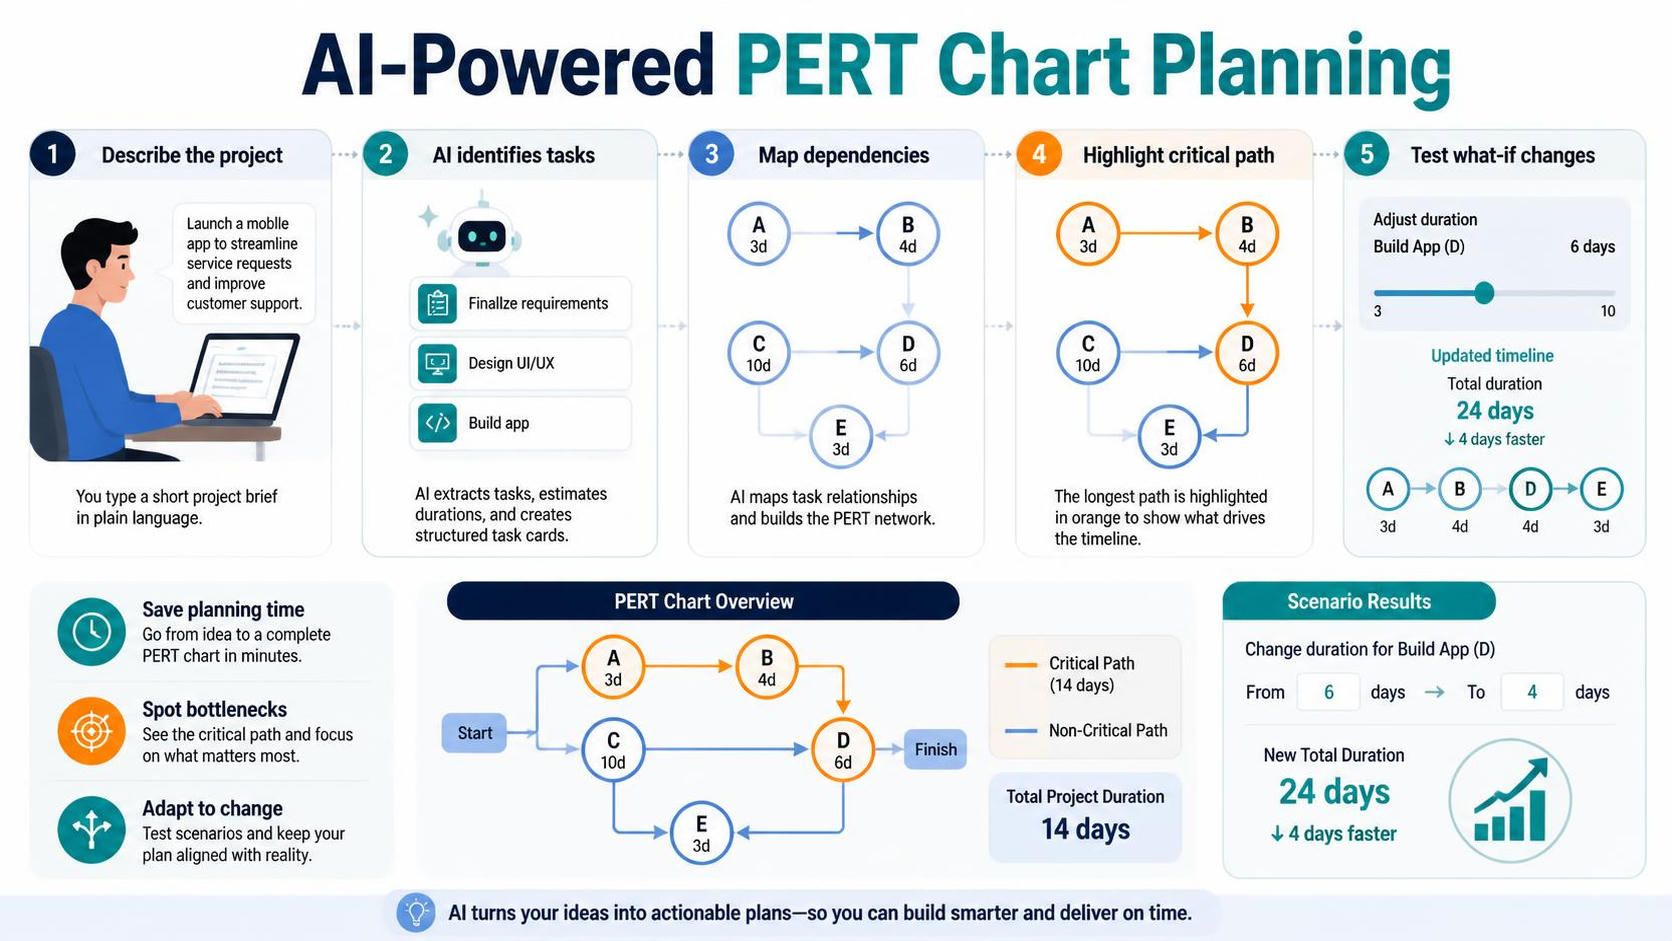
PERT Chart: A Program Evaluation and Review Technique diagram used to plan, schedule, and coordinate tasks. It visualizes the sequence of tasks, their dependencies, and the critical path—the longest route through the project determining its minimum completion time. PERT charts help identify which tasks can run in parallel and which depend on others.
-
Lane (Swimlane): A lane divides the PERT chart into sections that represent responsible teams, departments, or roles. It helps clarify ownership of tasks and improves visibility into which group is responsible for each activity in the project timeline.
-
Dependency: The logical relationship between tasks where one task cannot start or finish until another has started or finished. Identifying dependencies is crucial for accurate scheduling.
Instant PERT Chart Creation with AI
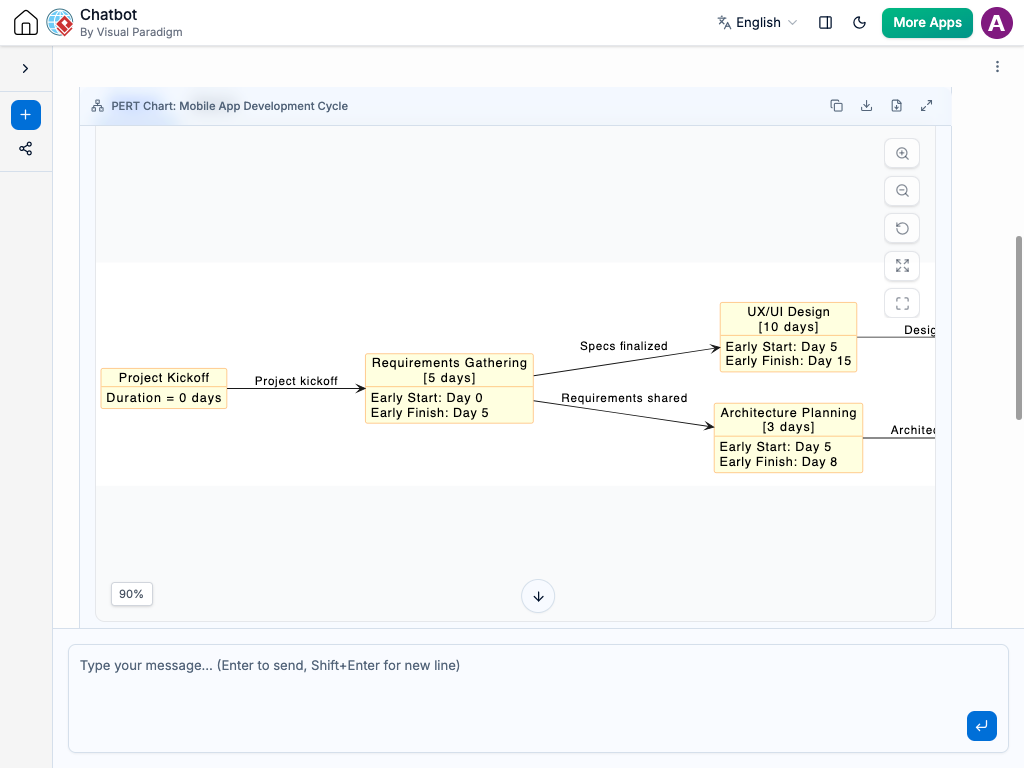
Gone are the days of dragging and dropping shapes for hours. Visual Paradigm’s AI Chatbot allows you to generate professional-grade PERT charts through natural language conversation.
How It Works
Simply describe your project timeline, key activities, and how each task depends on the next. The AI immediately transforms your input into a structured PERT Chart, showing events, durations, and connections. It removes the complexity of manual mapping and gives you a clean visual flow from the start.
Refine and Explore Through Conversation
Project plans are rarely static. Need to adjust durations, add new activities, or explore alternative task paths? Just ask. The chatbot updates the chart step by step while explaining how each change affects the overall timeline. It helps you validate sequences, uncover critical relationships, and refine your scheduling logic interactively.

Benefits of Creating PERT Charts with the AI Chatbot
Using AI to generate PERT charts offers significant advantages over traditional methods:

-
 Speed and Efficiency: Quickly map out tasks, milestones, and dependencies without manual drawing.
-
Interactive Experimentation: Experiment with different task sequences through simple conversation.
-
Risk Mitigation: Understand potential bottlenecks before they impact project schedules.
-
Agility: Get instant updates whenever project requirements change.
-
Clarity: Generate clear visuals that support planning, presentation, and team discussions.
Examples of Generating PERT Charts
You can use simple text prompts to generate these diagrams in seconds. Here are a few practical examples across different industries:
1. Product Launch
Prompt: “Build a PERT chart for a product launch workflow.”

2. Software Development Project
Prompt: “Create a PERT chart for a software development project.”

3. Academic Project
Prompt: “Generate a PERT chart for an academic project with topic selection, research, drafting, review, and final submission.”

Conclusion
The integration of AI into project management tools like Visual Paradigm marks a significant shift in how we plan and execute complex initiatives. By automating the creation of PERT charts, professionals can focus less on the mechanics of diagramming and more on strategic decision-making.
Whether you are a seasoned project manager or a student organizing your first major assignment, AI-powered PERT charts offer a faster, smarter, and more flexible way to visualize your path to success. Stop wrestling with rigid tools. Embrace AI-powered visual modeling and let the technology handle the visualization so you can focus on solving the bigger problems.