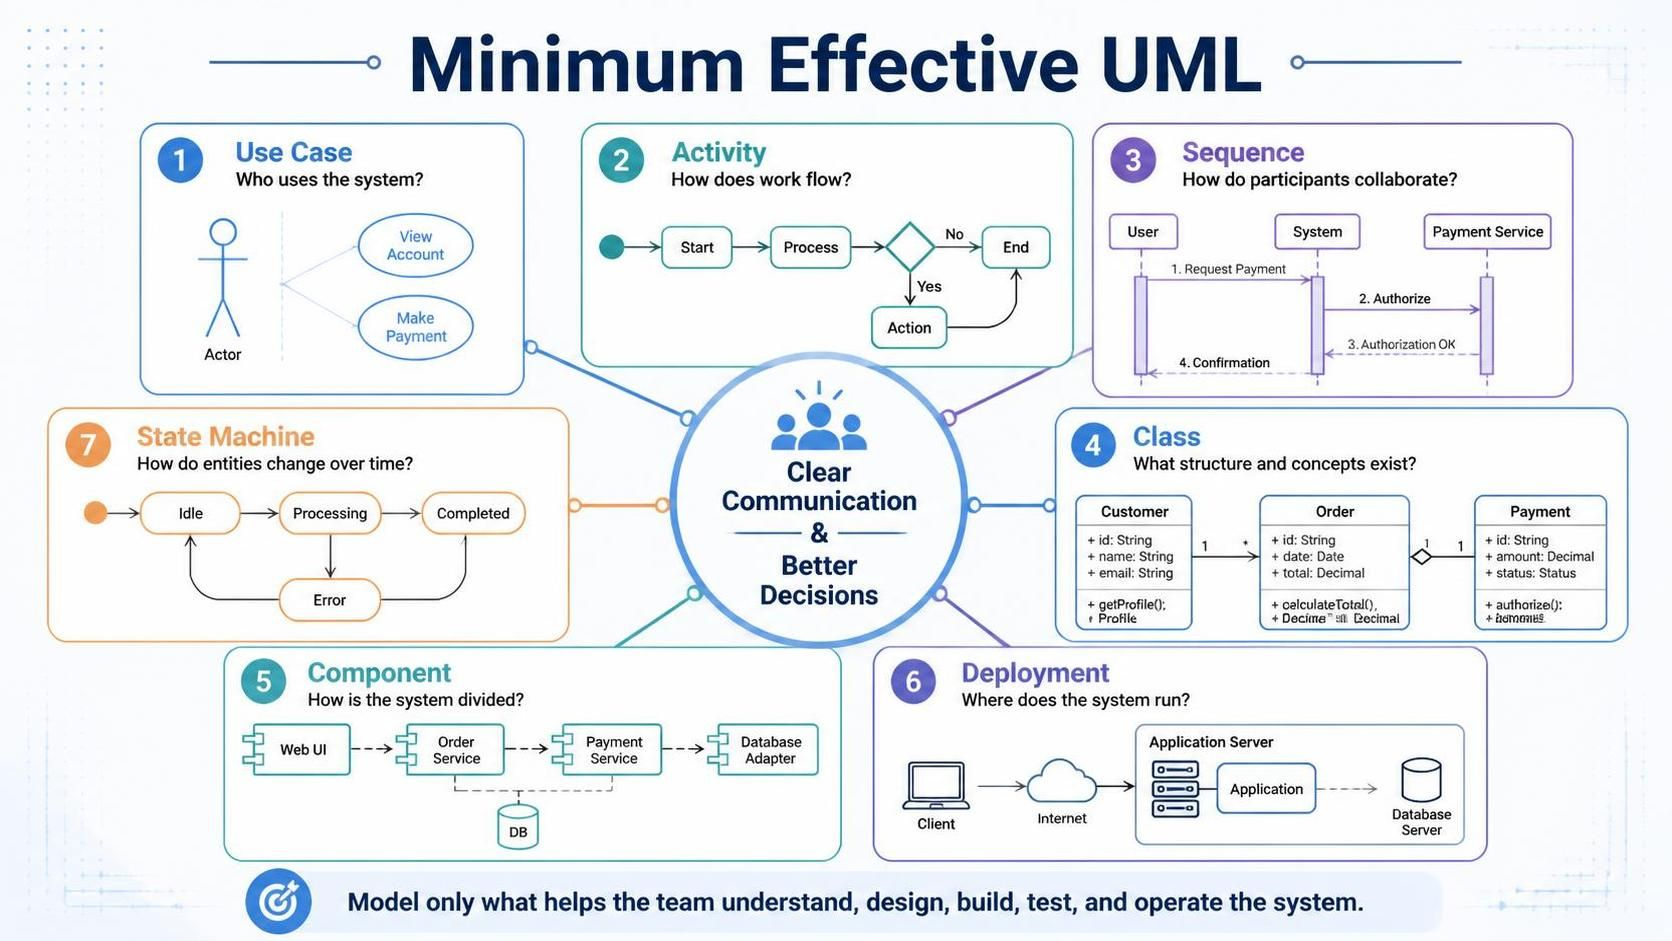
UML is most useful when it improves communication and decision-making—not when it becomes a documentation exercise. A team rarely needs every UML diagram type. In most projects, seven diagram types provide a strong foundation:
-
Use case diagrams
-
Activity diagrams
-
Sequence diagrams
-
Class diagrams
-
Component diagrams
-
Deployment diagrams
-
State-machine diagrams
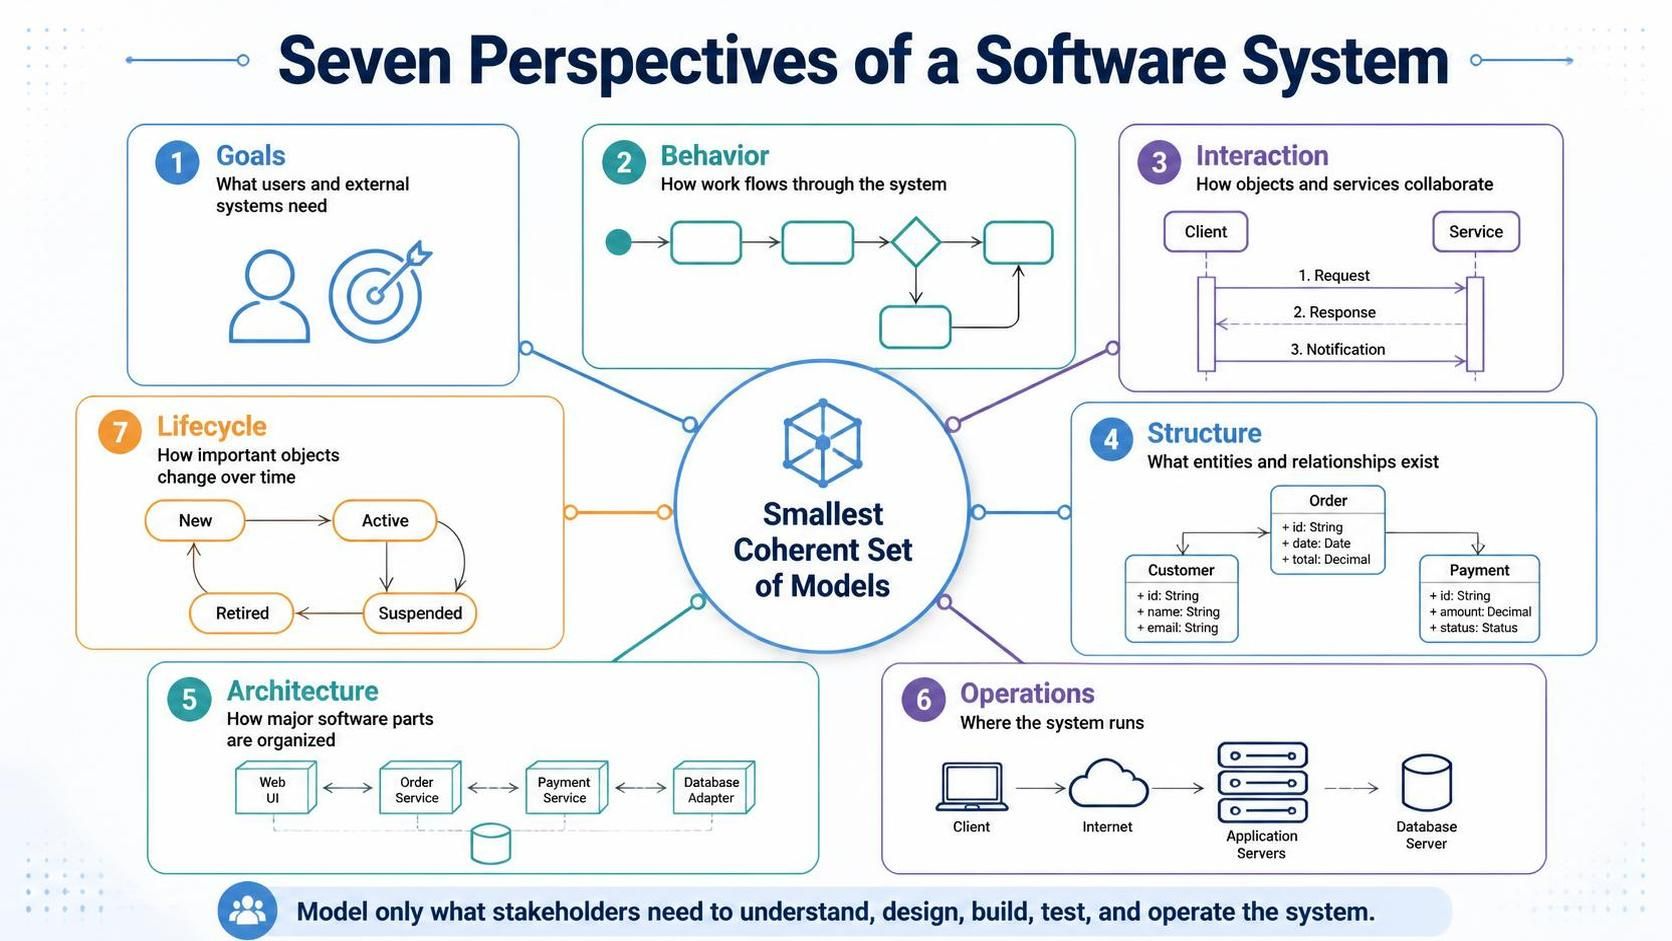
Together, these diagrams describe the system from complementary perspectives:
-
Goals: What users and external systems need
-
Behavior: How work flows through the system
-
Interaction: How objects and services collaborate
-
Structure: What entities and relationships exist
-
Architecture: How major software parts are organized
-
Operations: Where the system runs
-
Lifecycle: How important objects change over time
The goal is not to create one diagram for every possible concern. The goal is to create the smallest coherent set of models that answers the questions stakeholders actually have.
1. What “Minimum Effective UML” Means
Minimum effective UML is a modeling strategy based on four principles:
-
Model for a decision: Create a diagram because it clarifies a requirement, design choice, risk, or implementation detail.
-
Use the simplest adequate notation: Avoid unnecessary symbols, decoration, and detail.
-
Maintain traceability: Connect requirements to behavior, structure, code, tests, and deployment where practical.
-
Keep diagrams understandable: A diagram that contains everything often communicates nothing.
A useful model should help answer questions such as:
-
Who interacts with the system?
-
What capabilities must the system provide?
-
What steps make up a business process?
-
Which object or service is responsible for each action?
-
What data and domain concepts must be represented?
-
How are subsystems divided?
-
Where are applications, databases, and external services deployed?
-
How does an important entity transition through its lifecycle?
If a diagram does not help answer one of these questions, it may not be necessary.
2. The Seven-Diagram Core
| Diagram | Primary question | Main audience | Typical project phase |
|---|---|---|---|
| Use case | Who needs what from the system? | Customers, analysts, product owners | Requirements |
| Activity | How does work flow? | Analysts, designers, developers, testers | Requirements and process design |
| Sequence | How do participants collaborate over time? | Developers, architects, testers | Detailed design |
| Class | What concepts, data, and relationships exist? | Developers, analysts, architects | Domain and software design |
| Component | How is the system divided into major parts? | Architects, developers, operations teams | Architecture |
| Deployment | Where does the software run? | Architects, DevOps, operations, security teams | Deployment and operations |
| State machine | How does an entity change over time? | Developers, analysts, testers | Lifecycle design |
These diagrams are not independent. They form a chain:
Use Cases ⟶ Activities ⟶ Sequences ⟶ Classes and Components ⟶ Deployment
State-machine diagrams cut across this chain by describing the lifecycle of objects that have meaningful states.
For example, an online order may be represented as follows:
-
Use case: Place an order
-
Activity: Validate cart, authorize payment, reserve stock, confirm order
-
Sequence: Customer interface calls order service, payment service, and inventory service
-
Class:
Order,OrderLine,Payment, andProduct -
Component: Web application, order service, payment adapter, inventory service
-
Deployment: Browser, application cluster, database, payment provider
-
State machine: Draft → Pending Payment → Paid → Shipped → Delivered
3. Use Case Diagrams: Defining System Goals
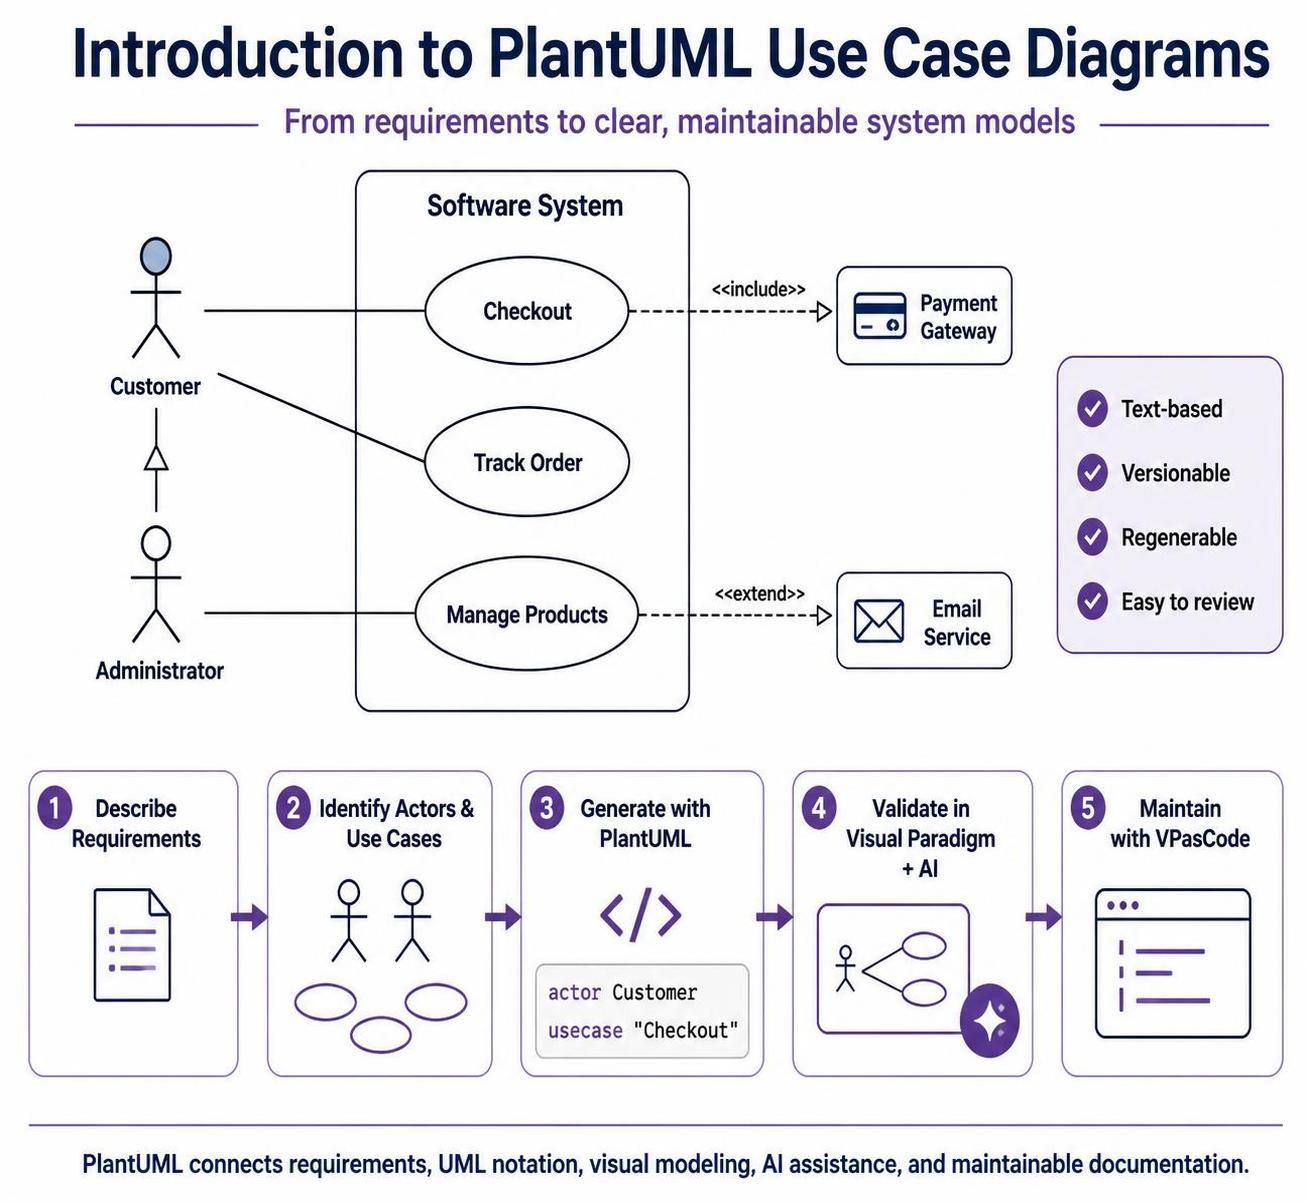
A use case diagram presents the system from the outside. It identifies the actors that interact with the system and the goals they pursue.
3.1 What a use case diagram contains
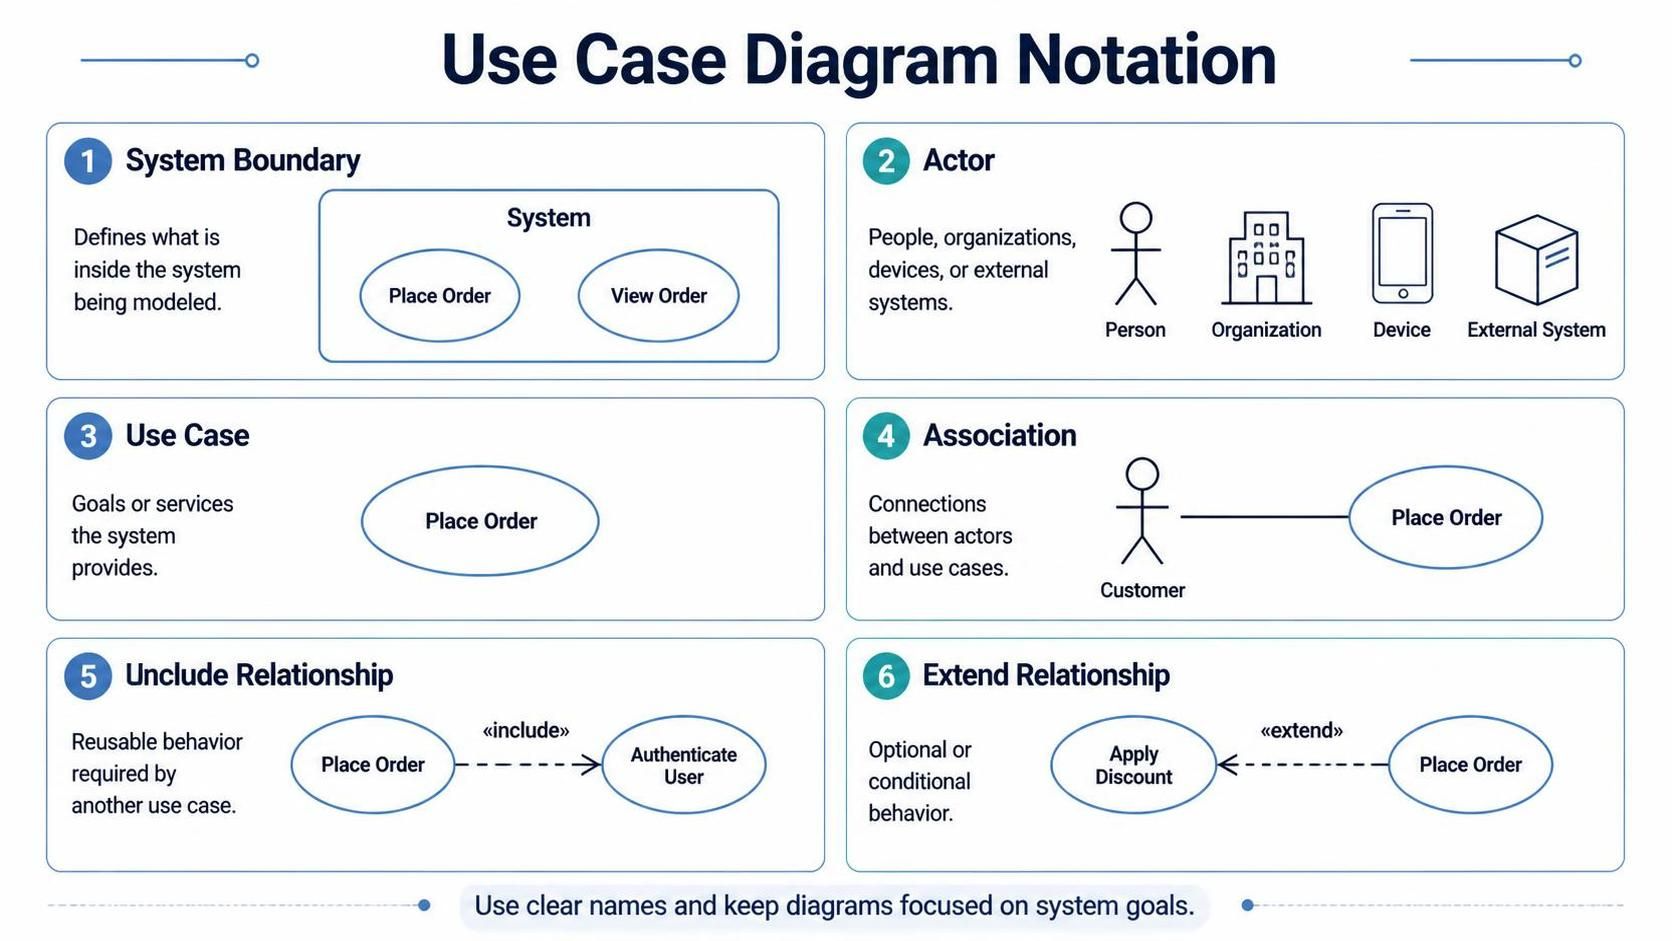
The main elements are:
-
System boundary: Defines what is inside the system being modeled
-
Actors: People, organizations, devices, or external systems
-
Use cases: Goals or services the system provides
-
Associations: Connections between actors and use cases
-
Include relationships: Reusable behavior required by another use case
-
Extend relationships: Optional or conditional behavior
Example:
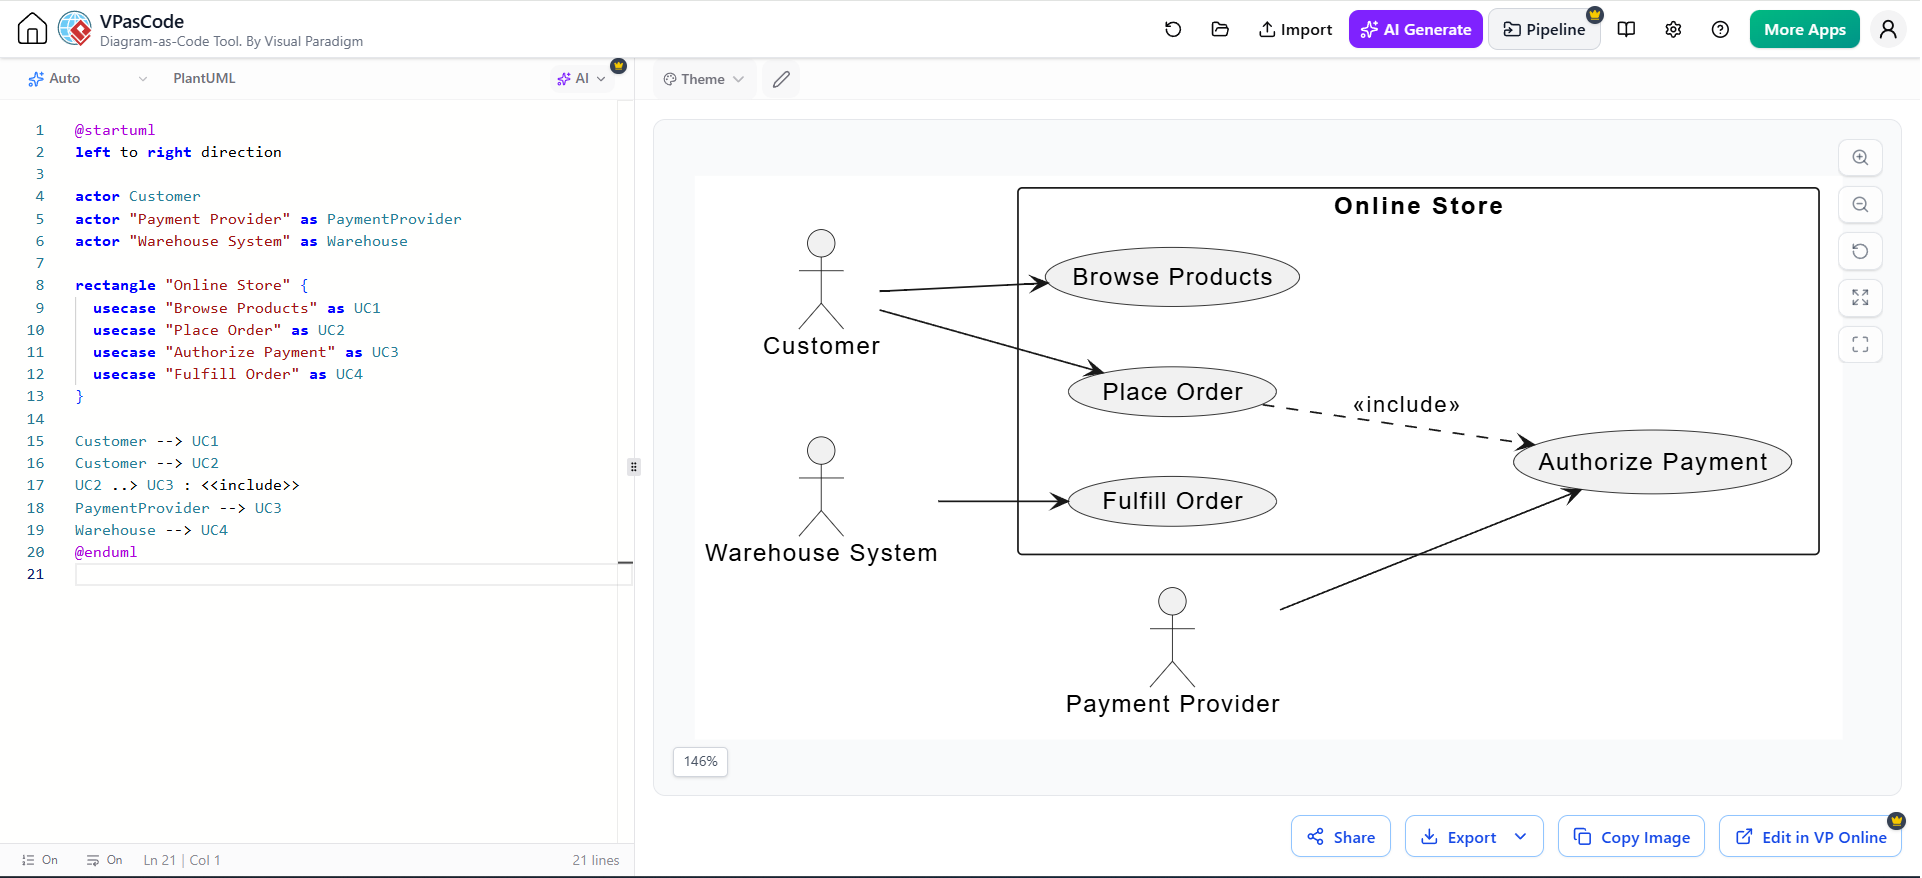
@startuml
left to right direction

actor Customer
actor "Payment Provider" as PaymentProvider
actor "Warehouse System" as Warehouse

rectangle "Online Store" {
  usecase "Browse Products" as UC1
  usecase "Place Order" as UC2
  usecase "Authorize Payment" as UC3
  usecase "Fulfill Order" as UC4
}

Customer --> UC1
Customer --> UC2
UC2 ..> UC3 : <<include>>
PaymentProvider --> UC3
Warehouse --> UC4
@enduml
3.2 Identify actors correctly
An actor is not necessarily a human role. It is anything external that interacts with the system.
Possible actors include:
-
Customer
-
Support agent
-
Administrator
-
Payment gateway
-
Identity provider
-
Warehouse management system
-
Scheduled job
-
Mobile application
-
IoT device
Avoid naming actors after internal implementation details. “REST controller” is usually not an actor. “Partner application” may be one.
3.3 Name use cases as goals
Good use case names describe outcomes:
-
Submit expense report
-
Approve purchase request
-
Register new patient
-
Generate invoice
-
Reset password
Weak names describe implementation mechanisms:
-
Call API
-
Run SQL query
-
Open form
-
Invoke controller
A use case should answer:
What meaningful result does an actor want to achieve with the system?
3.4 When to use include and extend
Use <<include>> when one behavior is always required as part of another.
For example:
-
“Place Order” includes “Calculate Total”
-
“Register Account” includes “Validate Email”
Use <<extend>> when behavior is optional or conditional.
For example:
-
“Place Order” may be extended by “Apply Promotional Discount”
-
“Sign In” may be extended by “Complete Multi-Factor Authentication”
Do not use these relationships merely to make a diagram look more sophisticated. Often, a short written scenario or activity diagram is clearer.
3.5 What use case diagrams do not show
Use case diagrams are not intended to describe:
-
Detailed user-interface layouts
-
Exact implementation classes
-
Database tables
-
Message ordering
-
Algorithmic logic
-
Infrastructure topology
They define scope and goals. Other diagrams provide the detail.
4. Activity Diagrams: Modeling Workflows and Processes
Activity diagrams show how work progresses. They are particularly effective for business processes, workflows, branching logic, parallel work, and exception handling.
4.1 Core elements
Activity diagrams commonly use:
-
Initial nodes
-
Actions
-
Decision nodes
-
Merge nodes
-
Forks and joins
-
Swimlanes
-
Final nodes
-
Guards such as
[approved]or[rejected]
Example:
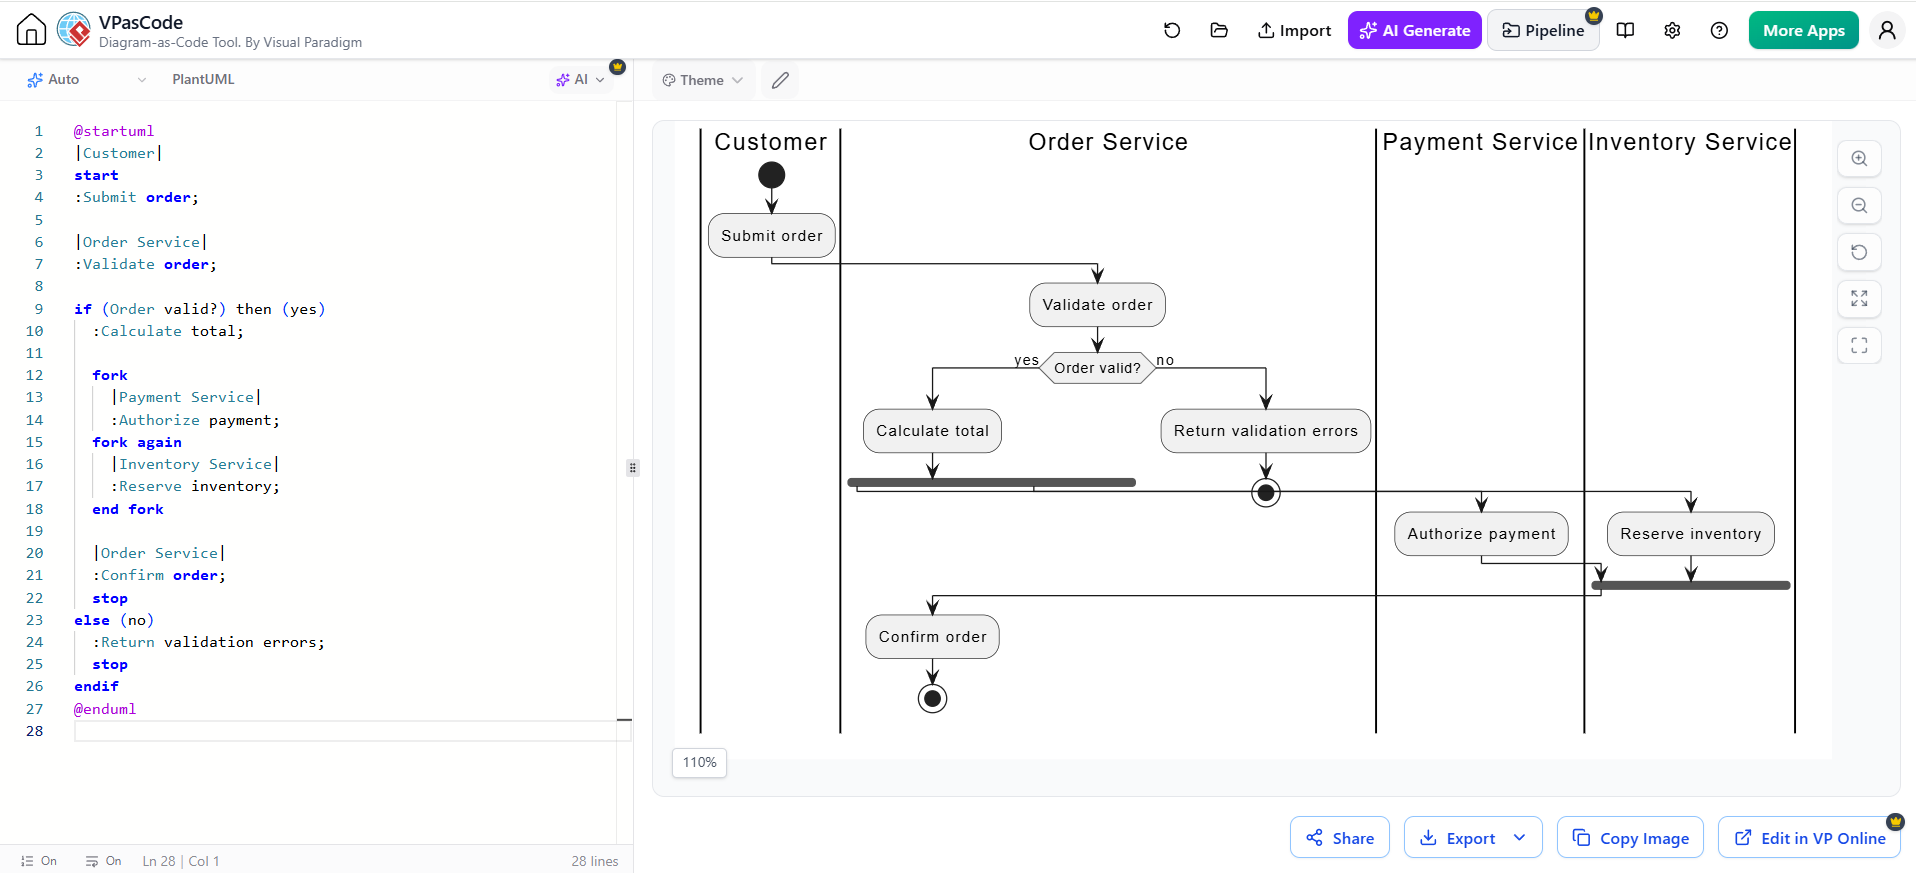
@startuml
|Customer|
start
:Submit order;

|Order Service|
:Validate order;

if (Order valid?) then (yes)
  :Calculate total;

  fork
    |Payment Service|
    :Authorize payment;
  fork again
    |Inventory Service|
    :Reserve inventory;
  end fork

  |Order Service|
  :Confirm order;
  stop
else (no)
  :Return validation errors;
  stop
endif
@enduml
4.2 Use swimlanes to show responsibility
Swimlanes clarify which role, system, or component performs each action.
Useful lanes may represent:
-
Customer
-
Customer service agent
-
Order service
-
Payment provider
-
Warehouse
-
Automated scheduler
Swimlanes are especially valuable when a process crosses organizational or system boundaries.
4.3 Model decisions explicitly
A decision should have meaningful guards:
[Payment approved]
[Payment declined]
Avoid vague labels such as:
[yes]
[no]
unless the decision question is immediately obvious.
4.4 Show parallelism when it matters
Forks and joins are useful when activities happen concurrently. For example, after an order is validated:
-
Payment may be authorized
-
Inventory may be reserved
-
A fraud check may run
However, only model parallelism when it affects timing, consistency, failure handling, or system design. Do not use parallel branches merely to make the diagram more elaborate.
4.5 Activity diagrams and requirements
An activity diagram can expose missing requirements. For example, while modeling an approval process, the team may discover unanswered questions:
-
What happens if an approver is unavailable?
-
Can a request be rejected and resubmitted?
-
What is the escalation time?
-
Can two people approve simultaneously?
-
What happens if the downstream system is unavailable?
This makes activity diagrams useful before implementation begins.
5. Sequence Diagrams: Explaining Collaboration Over Time
Sequence diagrams show how participants exchange messages in a time-ordered interaction. They are ideal for describing important scenarios in detail.
5.1 Main elements
A sequence diagram typically includes:
-
Actors
-
Objects or services
-
Lifelines
-
Messages
-
Return messages
-
Activation bars
-
Conditions
-
Loops
-
Alternative paths
-
Asynchronous messages
Example:
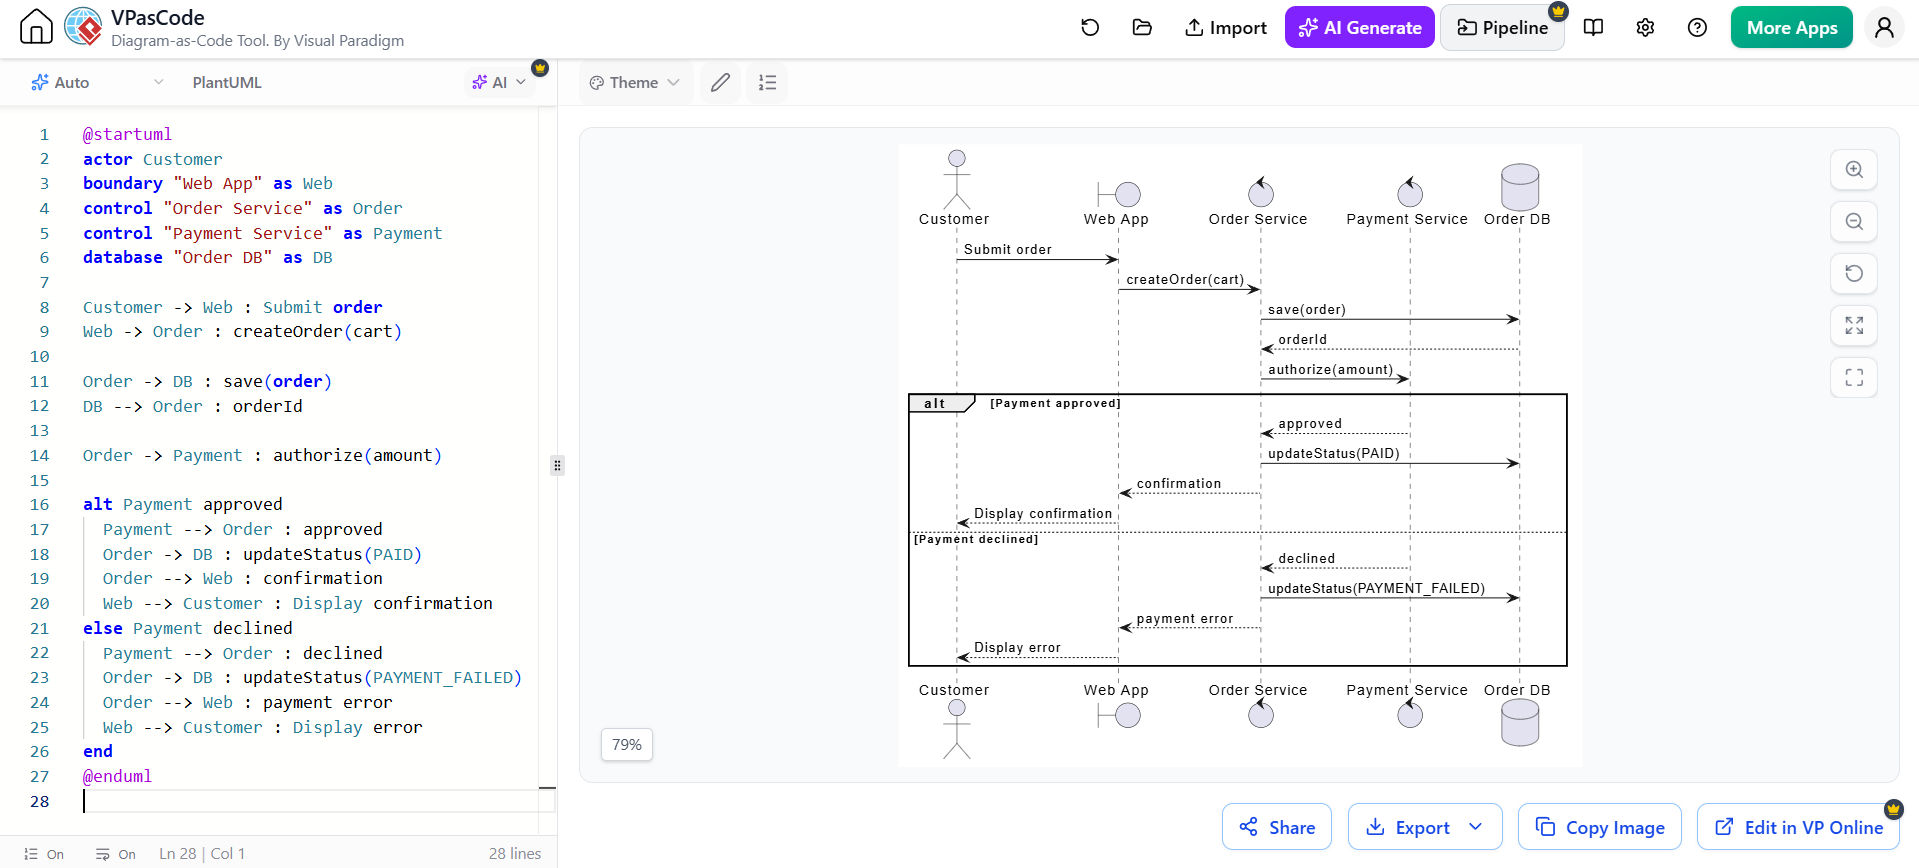
@startuml
actor Customer
boundary "Web App" as Web
control "Order Service" as Order
control "Payment Service" as Payment
database "Order DB" as DB

Customer -> Web : Submit order
Web -> Order : createOrder(cart)

Order -> DB : save(order)
DB --> Order : orderId

Order -> Payment : authorize(amount)

alt Payment approved
  Payment --> Order : approved
  Order -> DB : updateStatus(PAID)
  Order --> Web : confirmation
  Web --> Customer : Display confirmation
else Payment declined
  Payment --> Order : declined
  Order -> DB : updateStatus(PAYMENT_FAILED)
  Order --> Web : payment error
  Web --> Customer : Display error
end
@enduml
5.2 Choose scenarios strategically
Do not create a sequence diagram for every use case. Start with scenarios that are:
-
Business-critical
-
Technically risky
-
Integration-heavy
-
Security-sensitive
-
Transactional
-
Difficult to understand
-
Likely to expose architectural problems
Typical examples include:
-
User authentication
-
Payment processing
-
File upload
-
Order submission
-
Password reset
-
Event publication
-
Failure recovery
-
Background job execution
5.3 Distinguish synchronous and asynchronous interactions
A synchronous call means the sender waits for a response. An asynchronous message allows the sender to continue.
This distinction affects:
-
User experience
-
Transaction boundaries
-
Error handling
-
Scalability
-
Retry behavior
-
Observability
Use different notation consistently and explain important asynchronous behavior in a note or accompanying text.
5.4 Model failure paths
A sequence diagram that only shows the successful path can hide major design risks. Use alt, opt, and loop fragments to show:
-
Validation failure
-
Authorization failure
-
Timeout
-
Retry
-
Partial failure
-
Duplicate request
-
Service unavailability
-
Compensation or rollback
For example:
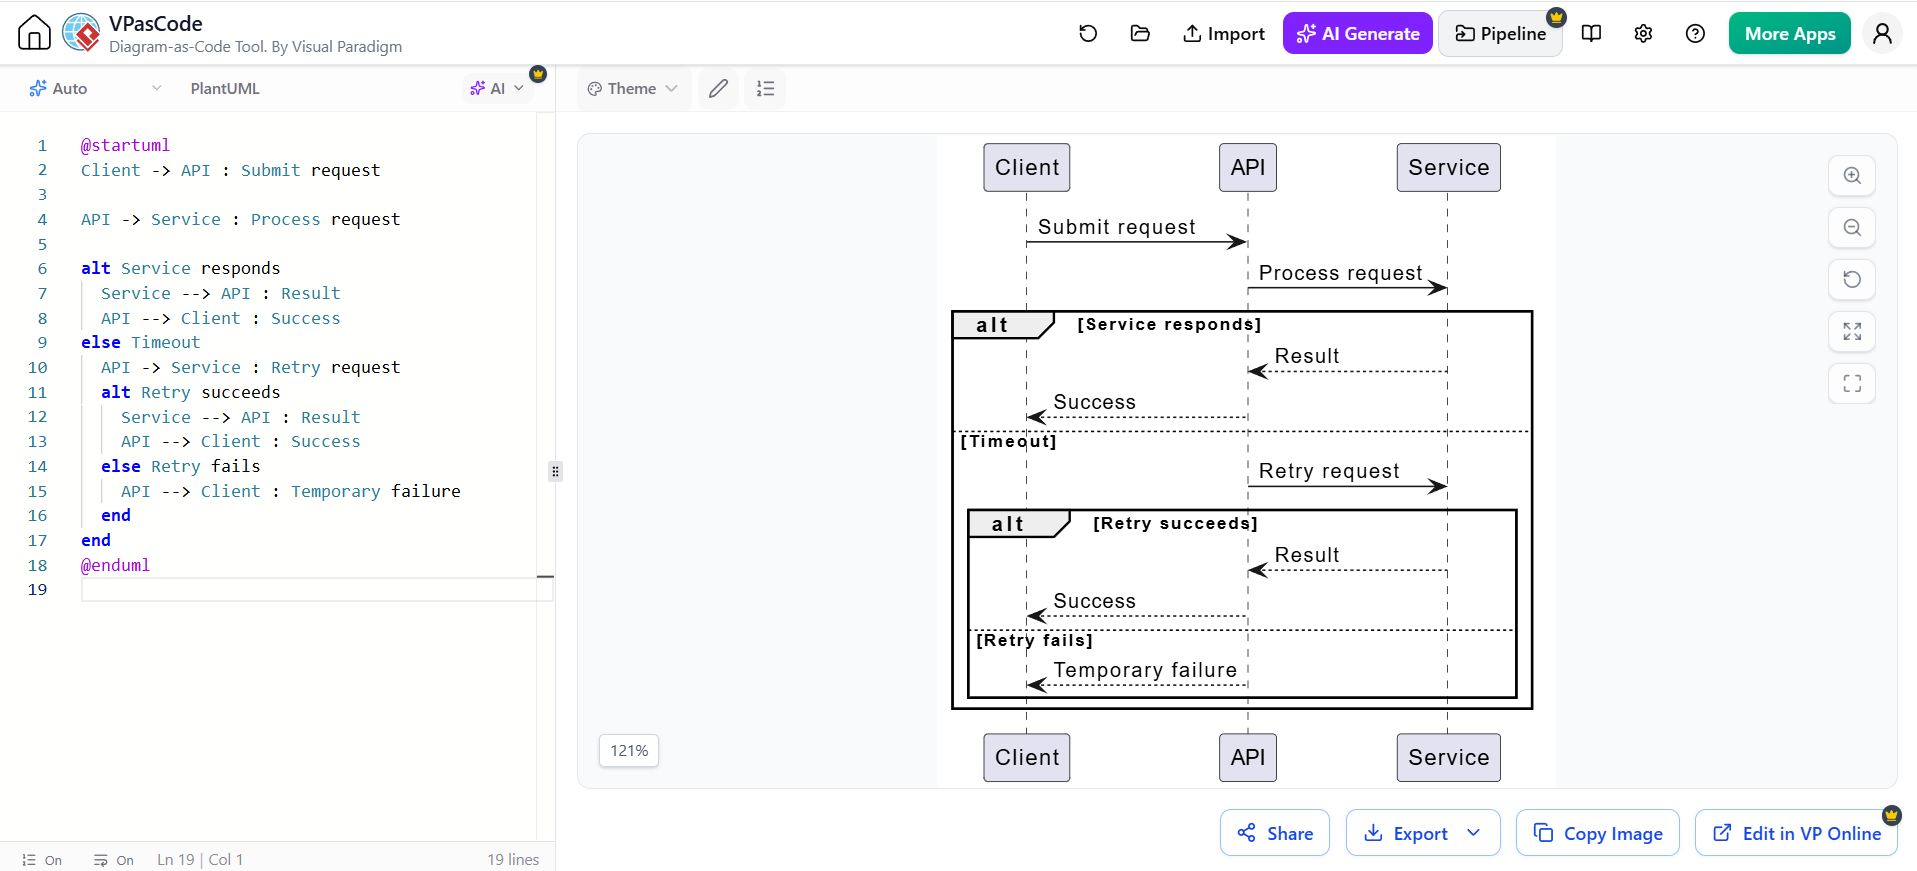
@startuml
Client -> API : Submit request

API -> Service : Process request

alt Service responds
  Service --> API : Result
  API --> Client : Success
else Timeout
  API -> Service : Retry request
  alt Retry succeeds
    Service --> API : Result
    API --> Client : Success
  else Retry fails
    API --> Client : Temporary failure
  end
end
@enduml
5.5 Avoid overly detailed sequence diagrams
A sequence diagram becomes difficult to maintain when it includes every internal method call. Focus on meaningful responsibilities and boundaries:
-
User interface
-
Application service
-
Domain object
-
Repository
-
External service
-
Message broker
-
Database
Detailed implementation diagrams may be useful during debugging, but they should not become the primary architectural documentation.
6. Class Diagrams: Describing Structure and Domain Concepts
Class diagrams show static structure. They can describe either:
-
A conceptual domain model
-
A design-level object model
-
An implementation-oriented class structure
These are different levels of abstraction and should not be mixed carelessly.
6.1 Conceptual versus implementation class diagrams
A conceptual model might contain:
-
Customer
-
Order
-
Product
-
Payment
An implementation model might contain:
-
OrderController -
OrderApplicationService -
OrderRepository -
PaymentGatewayAdapter
Both are valid, but they answer different questions.
6.2 Core relationships
Common relationships include:
-
Association
-
Aggregation
-
Composition
-
Generalization
-
Dependency
-
Realization
Use relationships carefully. In many cases, a simple association is clearer than an elaborate distinction between aggregation and composition.
Example:
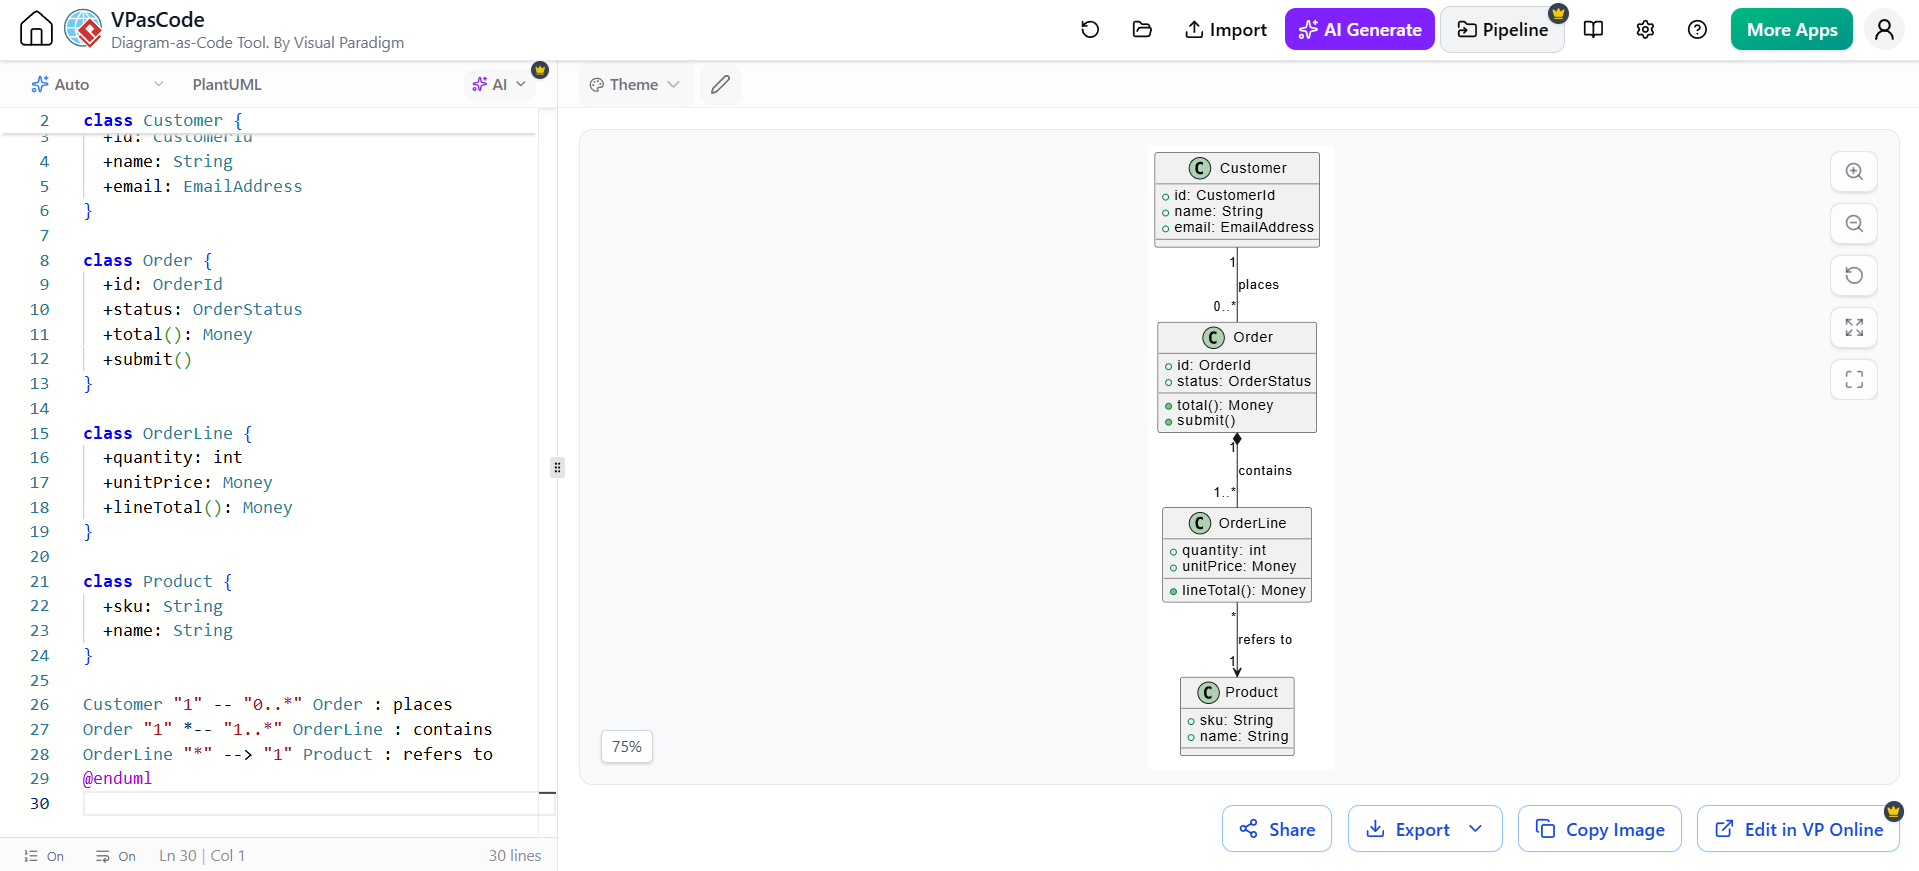
@startuml
class Customer {
  +id: CustomerId
  +name: String
  +email: EmailAddress
}

class Order {
  +id: OrderId
  +status: OrderStatus
  +total(): Money
  +submit()
}

class OrderLine {
  +quantity: int
  +unitPrice: Money
  +lineTotal(): Money
}

class Product {
  +sku: String
  +name: String
}

Customer "1" -- "0..*" Order : places
Order "1" *-- "1..*" OrderLine : contains
OrderLine "*" --> "1" Product : refers to
@enduml
6.3 Multiplicity is important
Multiplicity expresses constraints:
-
1— exactly one -
0..1— optional -
*— many -
1..*— one or more
For example:
Customer "1" -- "0..*" Order
means each order belongs to one customer, while a customer may have zero or more orders.
6.4 Model responsibilities, not just data fields
A class diagram should help explain where behavior belongs. A domain object with meaningful operations is often more informative than a set of classes containing only getters and setters.
For example:
Order.submit()
Order.cancel()
Order.calculateTotal()
Payment.authorize()
The exact operations depend on the design approach, but the principle is consistent:
Put important business responsibilities close to the concepts that own them.
6.5 Avoid turning class diagrams into database schemas
A class diagram is not automatically a relational schema. Do not add every database column unless the purpose is specifically persistence design.
A useful distinction is:
-
Domain model: Business concepts and rules
-
Design model: Software classes and responsibilities
-
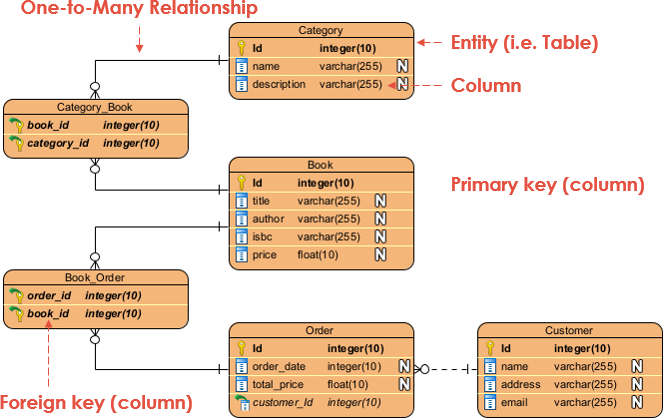
Data model: Tables, keys, indexes, and constraints
These may be related, but they should not be confused.
7. Component Diagrams: Showing Architectural Boundaries
Component diagrams describe major replaceable or deployable parts of a system and the interfaces through which they interact.
They are useful for answering:
-
What are the major subsystems?
-
Which component owns a responsibility?
-
What does each component provide?
-
What does each component require?
-
Where are integration boundaries?
-
Which dependencies are stable or risky?
Example:
@startuml
component "Web Application" as Web
component "Order Service" as Order
component "Payment Adapter" as Payment
component "Inventory Service" as Inventory
database "Order Database" as DB
cloud "External Payment Provider" as Provider

Web --> Order : REST API
Order --> Payment : Payment interface
Order --> Inventory : Inventory API
Order --> DB : Persistence
Payment --> Provider : Provider API
@enduml
7.1 Component diagrams are not package diagrams
A package diagram groups model elements, often for organization. A component diagram describes architectural units that provide and consume functionality.
A component might be:
-
A deployable service
-
A web application
-
A mobile application
-
A library
-
A message broker
-
An external platform
-
A database
-
A third-party integration
The appropriate level depends on the architecture.
7.2 Show interfaces where they clarify contracts
Interfaces make dependencies more explicit:
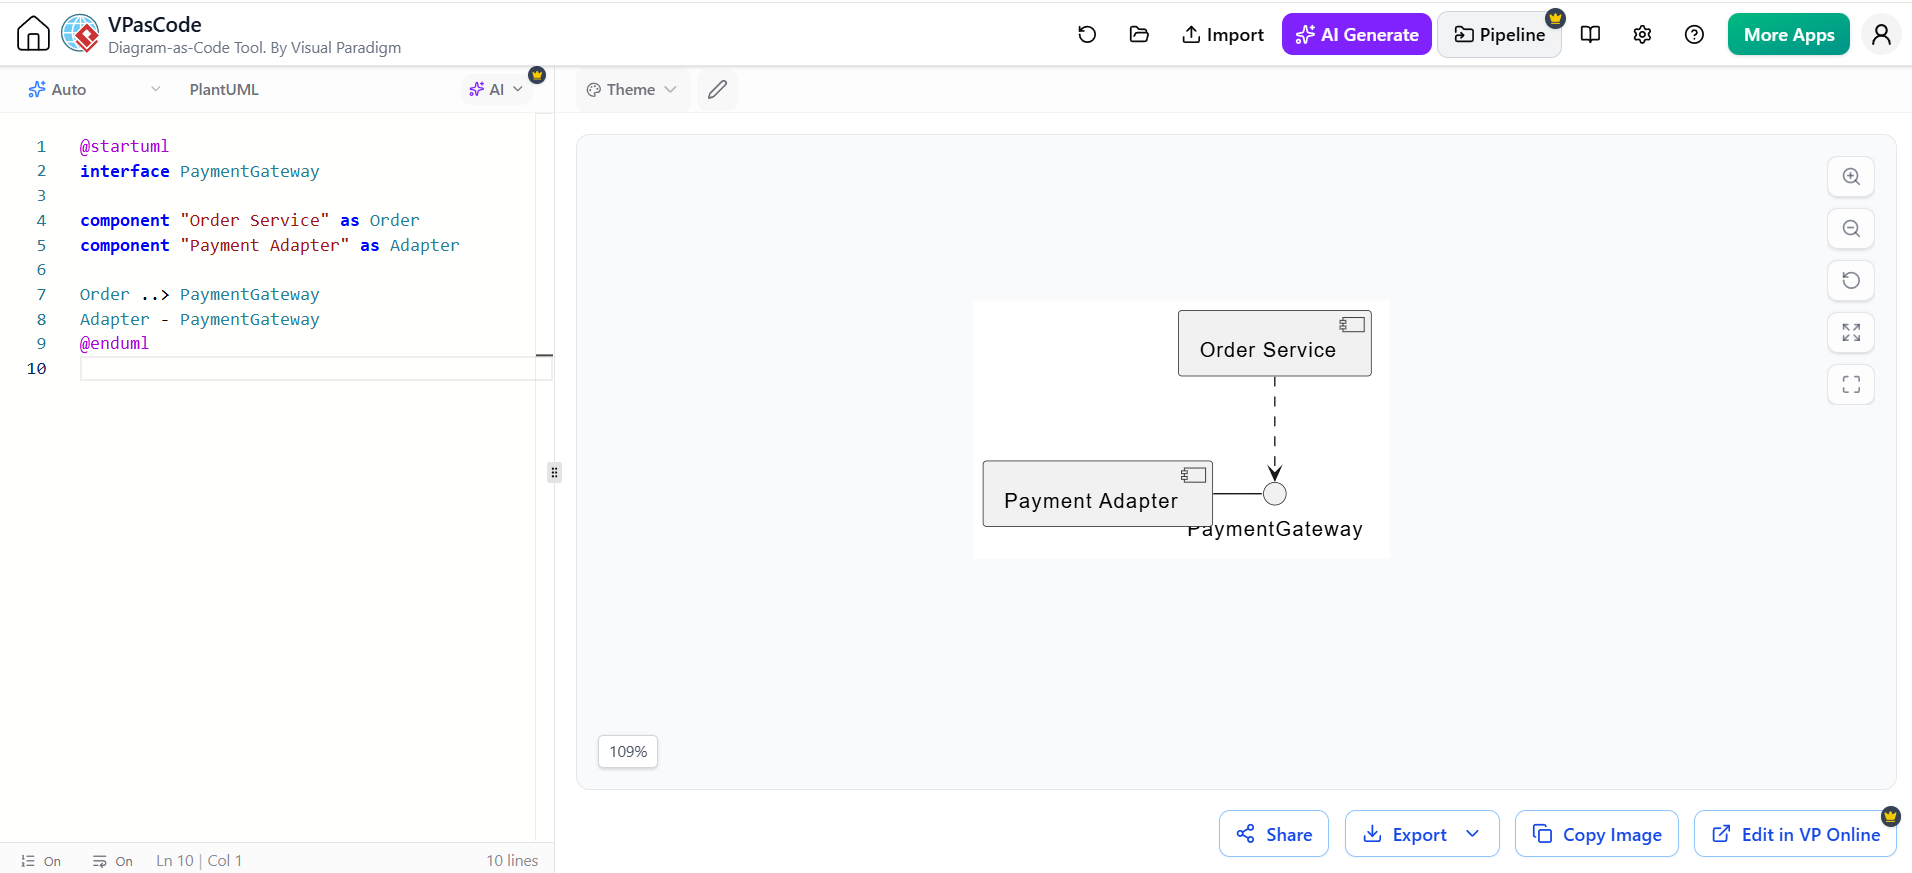
@startuml
interface PaymentGateway

component "Order Service" as Order
component "Payment Adapter" as Adapter

Order ..> PaymentGateway
Adapter - PaymentGateway
@enduml
This communicates that the order service depends on an abstraction rather than a particular provider.
7.3 Use component diagrams to support architectural decisions
A component diagram becomes more valuable when paired with short design notes:
-
Why is this boundary present?
-
Who owns the data?
-
Is the interaction synchronous or asynchronous?
-
What happens when the dependency fails?
-
Is the component independently deployable?
-
What security boundary does it represent?
-
What consistency guarantees exist?
The diagram should not need to contain every answer, but it should direct attention to important ones.
8. Deployment Diagrams: Connecting Software to Infrastructure
Deployment diagrams show the physical or virtual environment where software artifacts execute.
They help answer:
-
Where does each application run?
-
Which nodes communicate?
-
Where are databases located?
-
Which services are externally accessible?
-
What network boundaries exist?
-
How is the system distributed?
-
Which infrastructure choices affect reliability or performance?
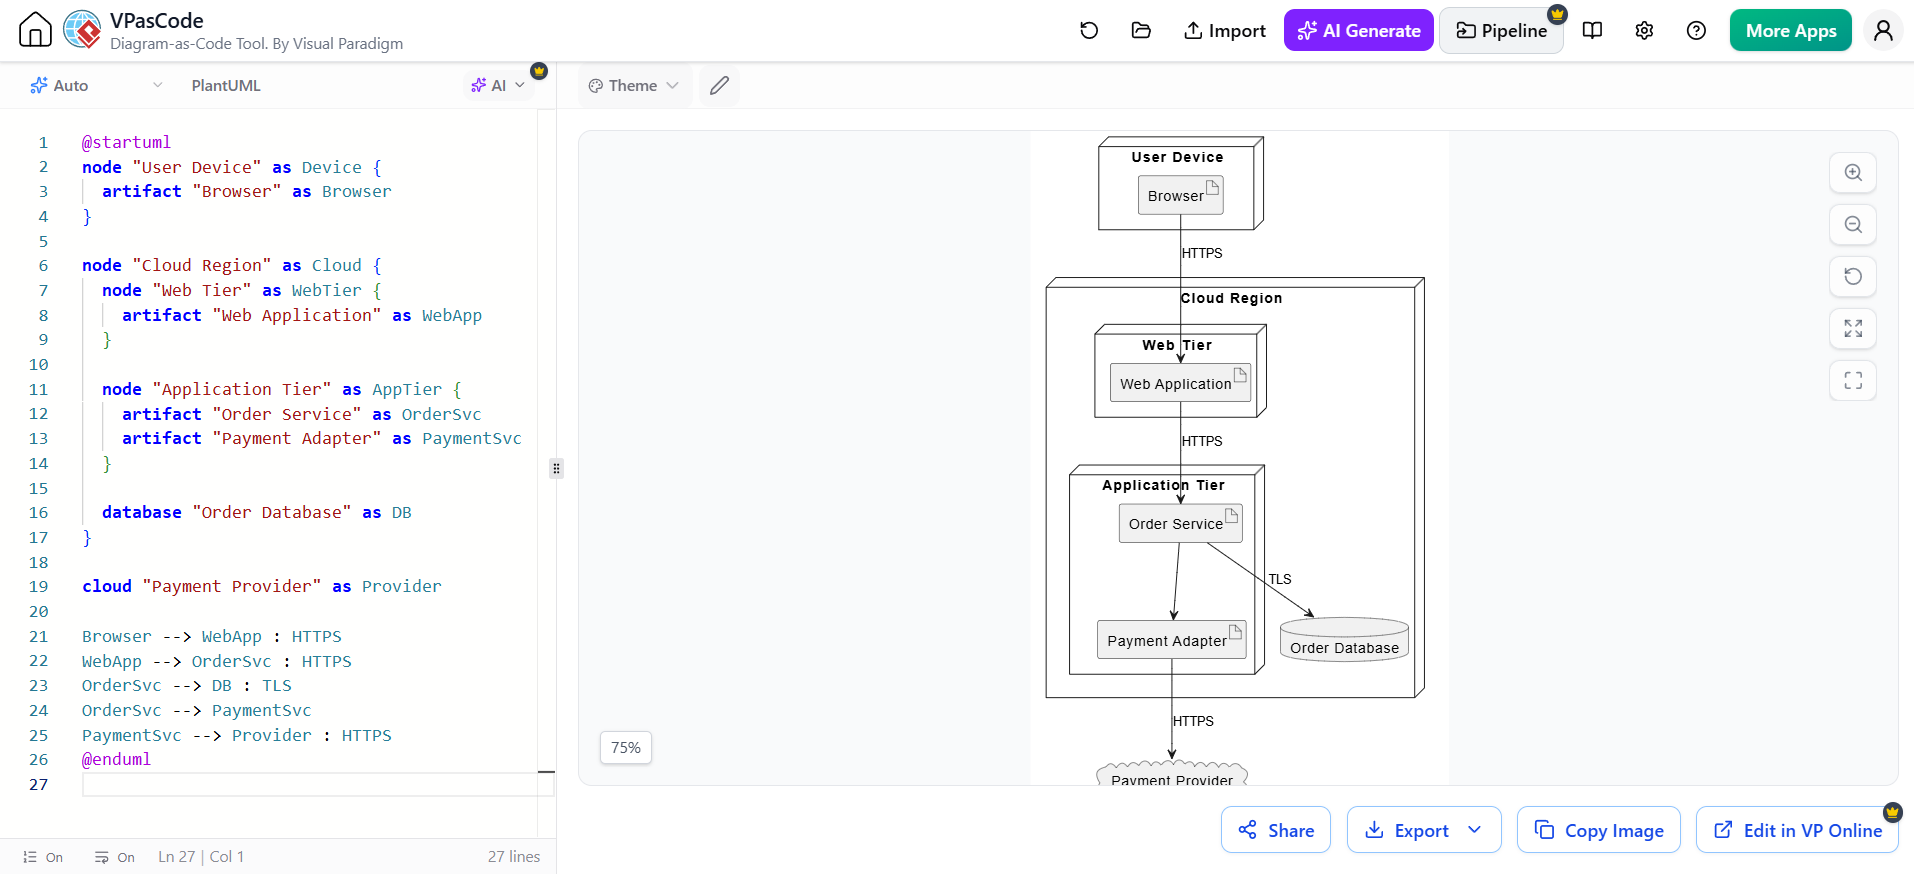
Example:
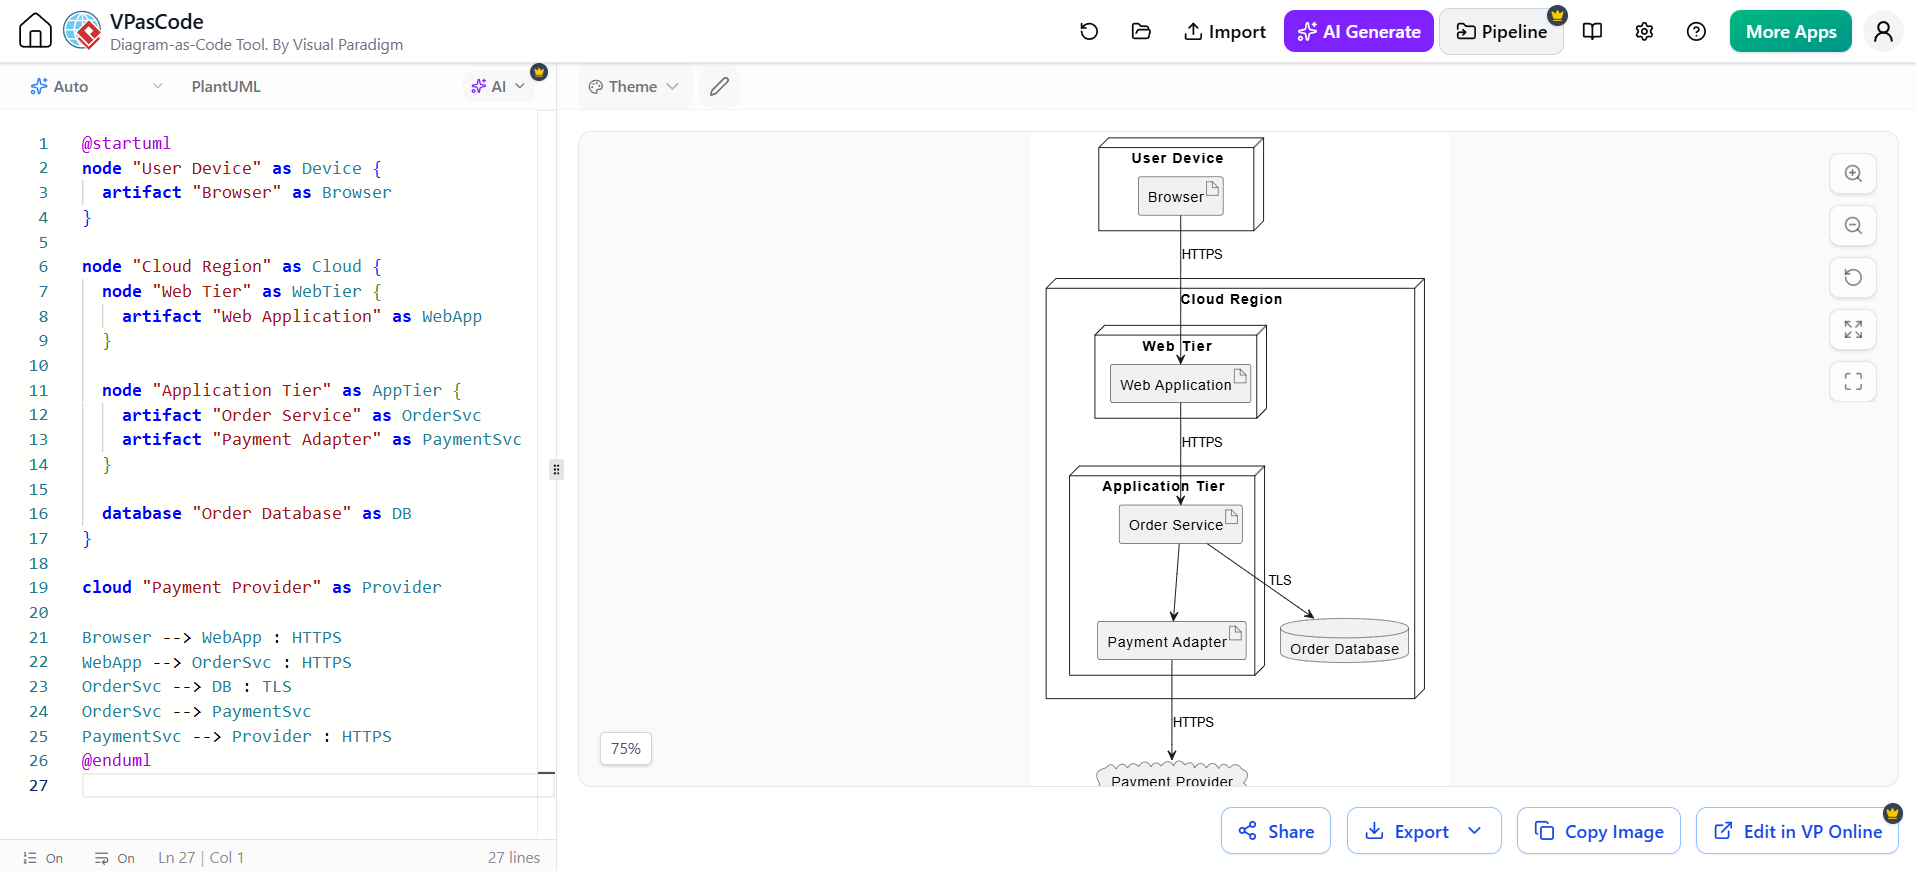
@startuml
node "User Device" as Device {
  artifact "Browser" as Browser
}

node "Cloud Region" as Cloud {
  node "Web Tier" as WebTier {
    artifact "Web Application" as WebApp
  }

  node "Application Tier" as AppTier {
    artifact "Order Service" as OrderSvc
    artifact "Payment Adapter" as PaymentSvc
  }

  database "Order Database" as DB
}

cloud "Payment Provider" as Provider

Browser --> WebApp : HTTPS
WebApp --> OrderSvc : HTTPS
OrderSvc --> DB : TLS
OrderSvc --> PaymentSvc
PaymentSvc --> Provider : HTTPS
@enduml
8.1 Distinguish nodes, artifacts, and environments
-
A node is an execution environment, such as a server, container, device, virtual machine, or managed platform.
-
An artifact is a deployable software unit, such as a binary, container image, package, or application.
-
An environment may represent development, testing, staging, or production.
8.2 Include operationally important details
Depending on the purpose, deployment diagrams may show:
-
Load balancers
-
Firewalls
-
Network zones
-
Container clusters
-
Availability zones
-
Databases and replicas
-
Caches
-
Message brokers
-
Object storage
-
External services
-
Monitoring and logging systems
Do not add infrastructure details that have no effect on the decision being documented.
8.3 Use deployment diagrams for risk analysis
Deployment modeling can reveal:
-
A single point of failure
-
An exposed database
-
A missing network boundary
-
Excessive cross-region traffic
-
A dependency with no failover strategy
-
Inadequate separation between environments
-
An unencrypted connection
-
An unrealistic scaling assumption
9. State-Machine Diagrams: Modeling Lifecycles
State-machine diagrams describe how an entity responds to events by moving between states.
They are valuable when an object’s behavior depends strongly on its current state.
Common examples include:
-
Order
-
Payment
-
Shipment
-
Support ticket
-
User account
-
Workflow request
-
Subscription
-
Document
-
Device
-
Job execution
Example:
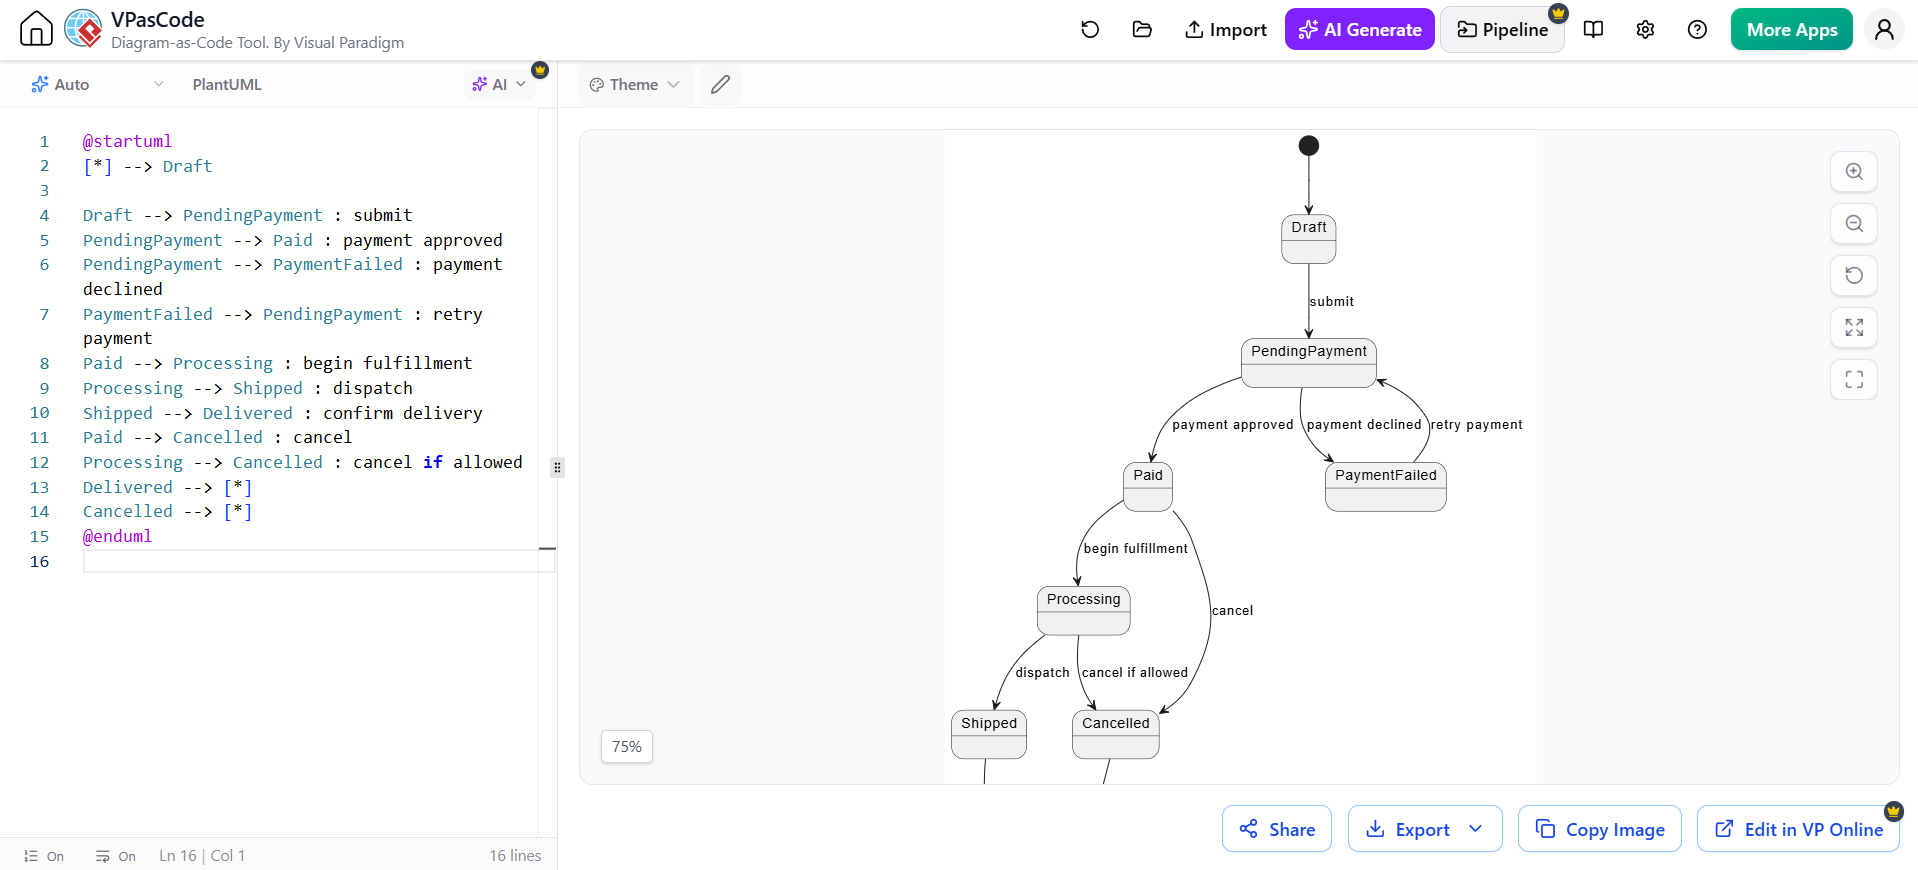
@startuml
[*] --> Draft

Draft --> PendingPayment : submit
PendingPayment --> Paid : payment approved
PendingPayment --> PaymentFailed : payment declined
PaymentFailed --> PendingPayment : retry payment
Paid --> Processing : begin fulfillment
Processing --> Shipped : dispatch
Shipped --> Delivered : confirm delivery
Paid --> Cancelled : cancel
Processing --> Cancelled : cancel if allowed
Delivered --> [*]
Cancelled --> [*]
@enduml
9.1 Define states carefully
A state should represent a meaningful condition, not merely an action.
Good states:
-
Pending Approval
-
Approved
-
Rejected
-
Payment Failed
-
Shipped
Weak states:
-
Clicking Button
-
Calling Service
-
Running Method
Actions are events or transitions. States are conditions that persist.
9.2 Include transition rules
A transition can include:
-
Event
-
Guard condition
-
Action
For example:
Pending Approval -- approve [manager authorized] / recordApproval --> Approved
This makes business rules visible and testable.
9.3 Use state machines to derive tests
Each transition suggests test cases:
-
Valid transition
-
Invalid transition
-
Guard failure
-
Repeated event
-
Timeout
-
Retry
-
Cancellation
-
Recovery
For an order lifecycle, tests might verify:
-
A draft order can be submitted
-
A delivered order cannot be cancelled
-
A payment failure permits retry
-
A cancelled order cannot return to paid status
10. How the Seven Diagrams Work Together
The diagrams should form a consistent model rather than seven disconnected illustrations.
Consider a “Submit Expense Report” capability.
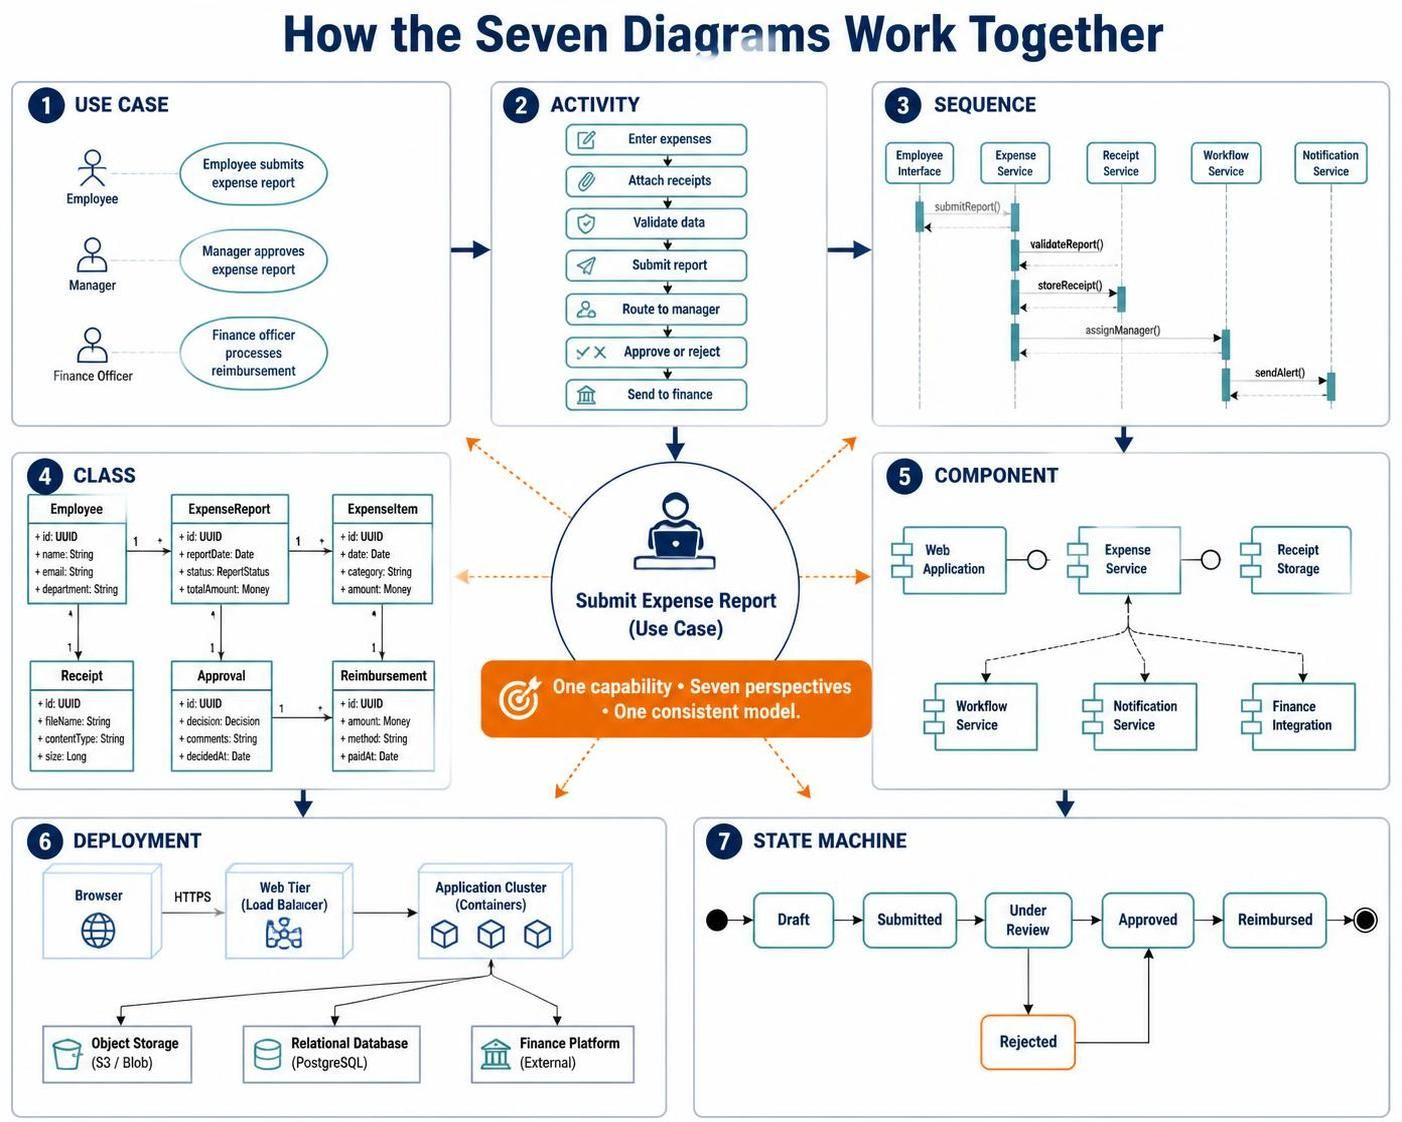
Use case
-
Employee submits expense report
-
Manager approves expense report
-
Finance officer processes reimbursement
Activity
-
Enter expenses
-
Attach receipts
-
Validate data
-
Submit report
-
Route to manager
-
Approve or reject
-
Send to finance
Sequence
-
Employee interface calls expense service
-
Expense service validates report
-
Receipt service stores attachments
-
Workflow service assigns manager
-
Notification service sends alerts
Class
-
Employee -
ExpenseReport -
ExpenseItem -
Receipt -
Approval -
Reimbursement
Component
-
Web application
-
Expense service
-
Receipt storage
-
Workflow service
-
Notification service
-
Finance integration
Deployment
-
Browser
-
Web tier
-
Application cluster
-
Object storage
-
Relational database
-
Finance platform
State machine
Draft → Submitted → Under Review → Approved → Reimbursed
                         ↓
                      Rejected
Each diagram adds a different perspective without duplicating all the others.
11. Choosing Which Diagrams to Create
A practical selection process is to ask what kind of uncertainty the team has.
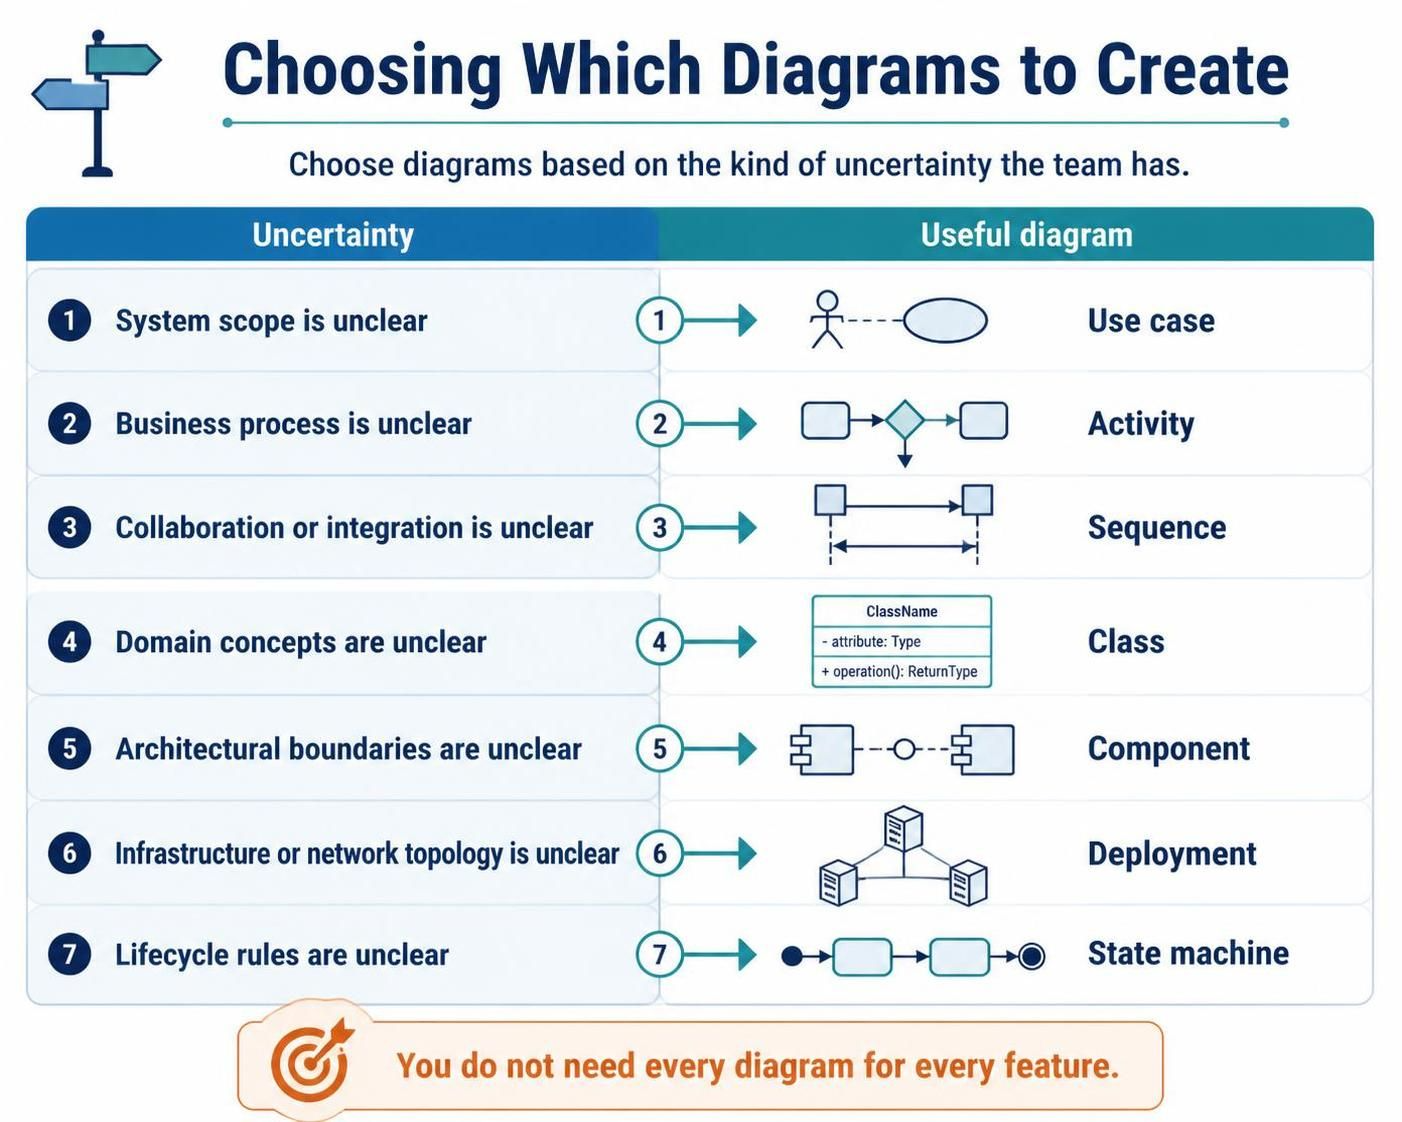
| Uncertainty | Useful diagram |
|---|---|
| System scope is unclear | Use case |
| Business process is unclear | Activity |
| Collaboration or integration is unclear | Sequence |
| Domain concepts are unclear | Class |
| Architectural boundaries are unclear | Component |
| Infrastructure or network topology is unclear | Deployment |
| Lifecycle rules are unclear | State machine |
You do not need every diagram for every feature.
A lightweight decision rule
Create a diagram when at least one of the following is true:
-
Multiple stakeholders interpret the requirement differently.
-
A process has important branching or parallel behavior.
-
A scenario crosses several system boundaries.
-
A domain object has nontrivial rules.
-
An architecture decision needs to be communicated.
-
Deployment topology affects reliability, security, or performance.
-
Lifecycle rules are difficult to explain in prose.
-
The diagram will be reused for implementation, review, testing, or operations.
Avoid creating a diagram merely because a template says one is expected.
12. Levels of Detail
A strong modeling practice uses multiple levels of abstraction.
Context level
Shows the system and major external actors or systems.
Useful for:
-
Scope
-
Stakeholder communication
-
System boundaries
Container or subsystem level
Shows applications, services, databases, and major integrations.
Useful for:
-
Architecture
-
Ownership
-
Deployment planning
Component level
Shows internal architectural parts and interfaces.
Useful for:
-
Detailed design
-
Dependency review
-
Team boundaries
Code level
Shows classes, methods, and implementation dependencies.
Useful for:
-
Developer work
-
Refactoring
-
Debugging
Do not place all levels into one diagram. A context diagram should not contain every class, and a class diagram should not attempt to represent the entire production network.
13. Visual Paradigm UML
Visual Paradigm is well suited to teams that prefer graphical modeling and integrated documentation.
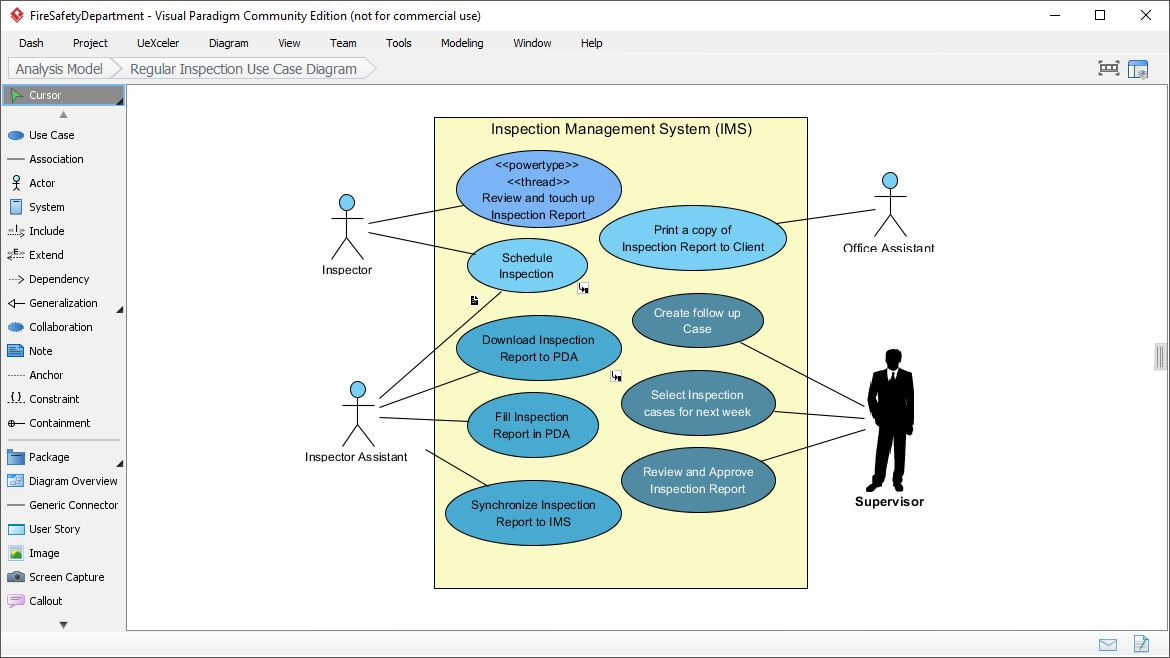
It can be useful for:
-
Drawing UML diagrams interactively
-
Maintaining a model repository
-
Linking diagrams to requirements
-
Creating traceability relationships
-
Producing documentation
-
Collaborating through a shared modeling environment
-
Generating or reverse-engineering selected artifacts
-
Managing larger models with navigation and organization features
13.1 Strengths
Graphical UML tools are particularly helpful when:
-
Analysts and non-developers need to edit diagrams
-
Stakeholders prefer visual manipulation
-
A project requires formal model organization
-
Traceability is important
-
The team maintains a central repository
-
Documentation must be generated consistently
13.2 Recommended usage
Use Visual Paradigm for the model views that benefit from:
-
Interactive layout
-
Rich annotations
-
Cross-diagram navigation
-
Formal repository management
-
Traceability
-
Stakeholder workshops
Do not allow the tool to determine the modeling strategy. First decide:
-
Which decision the diagram supports
-
Who will read it
-
What level of detail is appropriate
-
How it will be maintained
-
Whether the model needs to connect to requirements or code
13.3 Repository discipline
A shared model repository benefits from the same practices as source control:
-
Establish naming conventions
-
Assign ownership of major model areas
-
Review significant changes
-
Avoid unnecessary duplicate diagrams
-
Archive obsolete views
-
Record the purpose of important diagrams
-
Keep model elements consistently named
14. VPasCode and Text-Based Modeling
VPasCode supports a text-oriented approach to modeling within a Visual Paradigm ecosystem. This style is useful for teams that want diagrams to behave more like source artifacts.
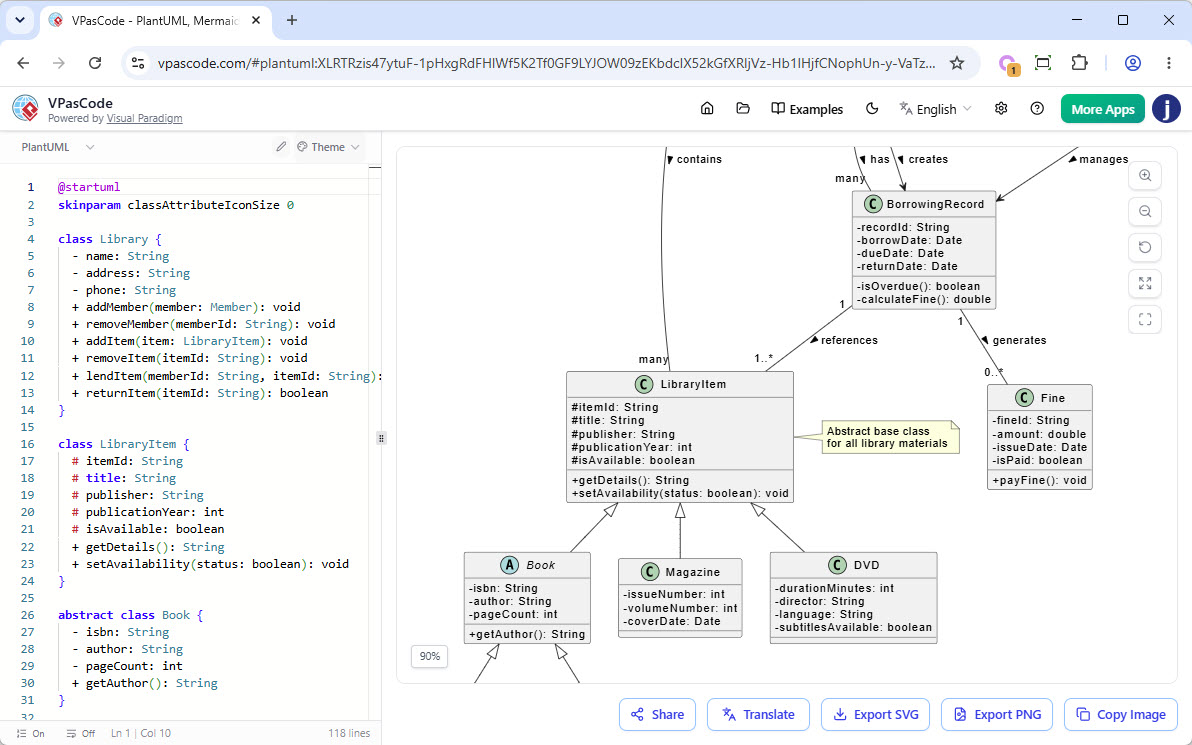
Text-based diagrams can offer:
-
Version-control compatibility
-
Code review
-
Branching and merging
-
Automated generation
-
Repeatable builds
-
Easier batch updates
-
Proximity to source code and documentation
A text-based model might look like:
actor Customer
usecase "Place Order" as PlaceOrder
Customer --> PlaceOrder
The exact syntax depends on the tool and workflow, but the broader advantage is that the diagram is represented as editable text rather than only as a graphical file.
14.1 When text-based modeling works well
Use text-based diagrams when:
-
Developers maintain the models
-
Diagrams change frequently
-
The team uses Git or another version-control system
-
Reviewers want to inspect textual changes
-
Diagrams are generated as part of documentation
-
Multiple branches need to evolve independently
14.2 Potential limitations
Text-based modeling may be less convenient when:
-
Business stakeholders need to edit diagrams directly
-
Layout must be manually optimized
-
The model contains rich visual annotations
-
The team is unfamiliar with diagram syntax
-
A repository requires sophisticated visual navigation
A hybrid approach is often effective: use text-based diagrams for code-oriented architecture and graphical tools for stakeholder-facing analysis.
15. PlantUML
PlantUML is a popular text-based diagramming approach that can generate UML and related architectural diagrams from plain text.
Example:
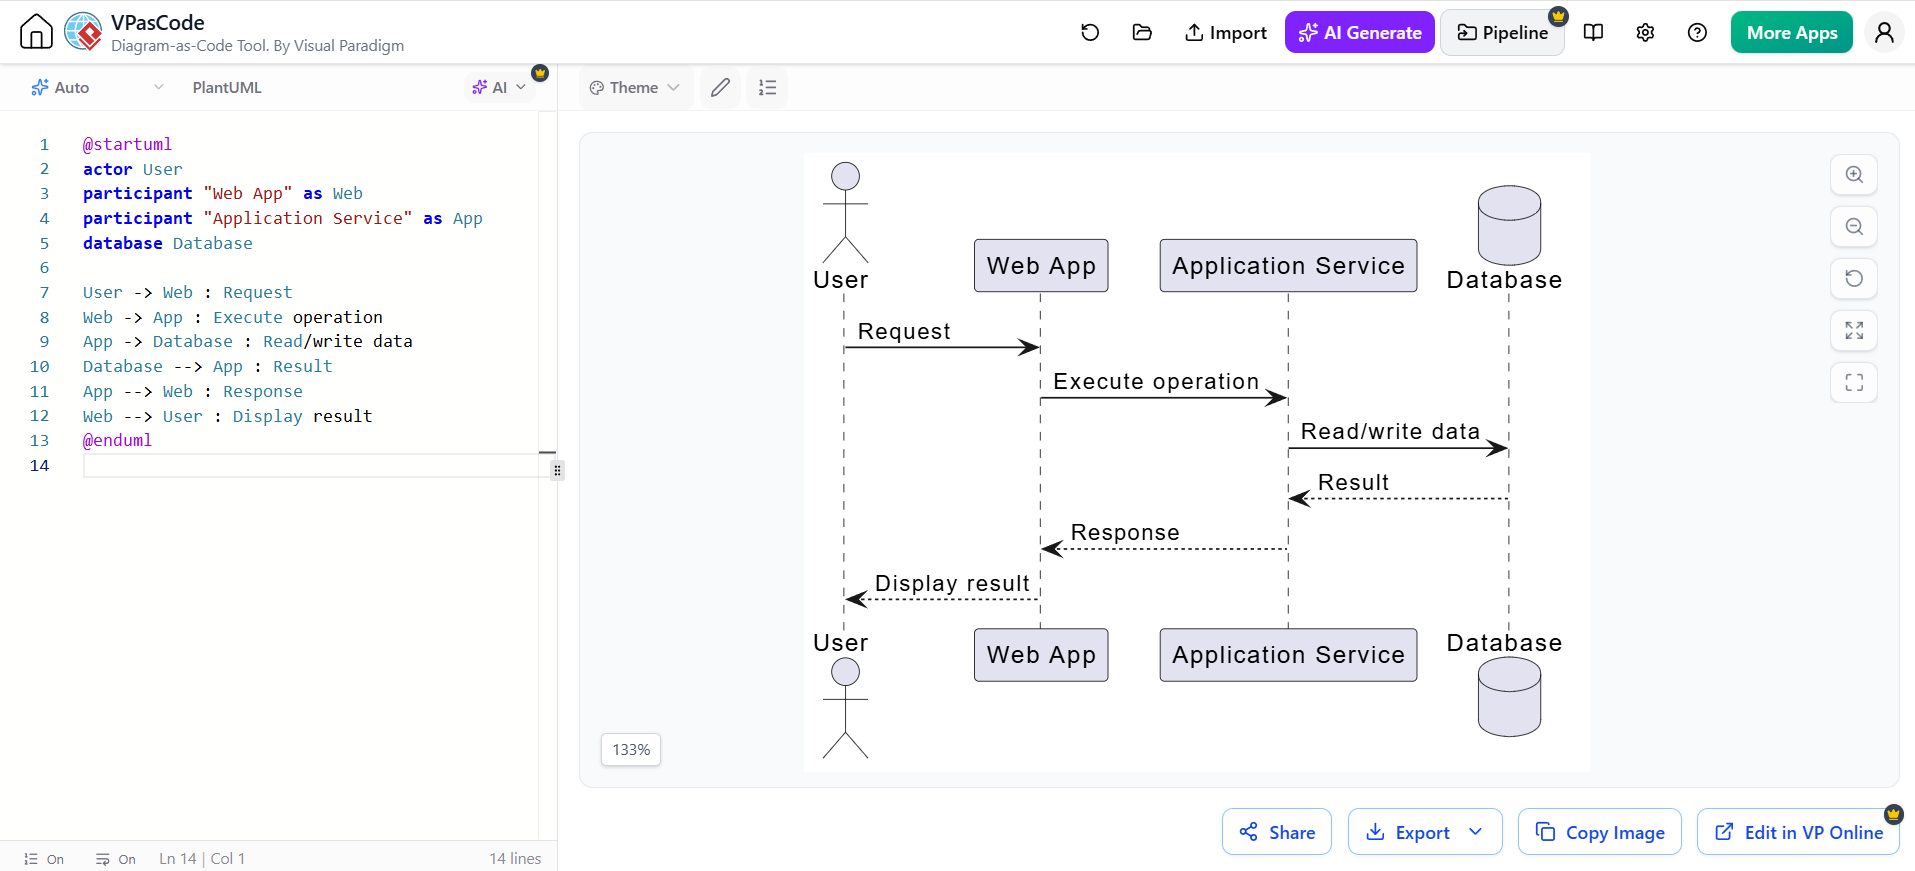
@startuml
actor User
participant "Web App" as Web
participant "Application Service" as App
database Database

User -> Web : Request
Web -> App : Execute operation
App -> Database : Read/write data
Database --> App : Result
App --> Web : Response
Web --> User : Display result
@enduml
15.1 Benefits
PlantUML is valuable because diagrams can be:
-
Stored beside source code
-
Reviewed in pull requests
-
Generated automatically
-
Updated with simple text edits
-
Included in Markdown or documentation pipelines
-
Produced consistently across environments
15.2 Organizing PlantUML files
A practical repository structure might be:
docs/
  architecture/
    system-context.puml
    components.puml
    deployment.puml
  workflows/
    place-order.puml
    refund-payment.puml
  domain/
    order-model.puml
    order-lifecycle.puml
Use descriptive names and organize diagrams by purpose rather than by tool.
15.3 Keep generated images out of the source of truth
When possible:
-
Store
.pumlfiles as the authoritative source -
Generate PNG, SVG, or PDF files during documentation builds
-
Avoid manually editing generated images
-
Validate that diagrams render successfully in automation
15.4 Use consistent styling
Define a small visual vocabulary:
-
One color for external systems
-
One color for internal services
-
One color for databases
-
One notation for asynchronous messaging
-
One naming convention for interfaces
-
One way to represent security boundaries
Consistency is more valuable than decoration.
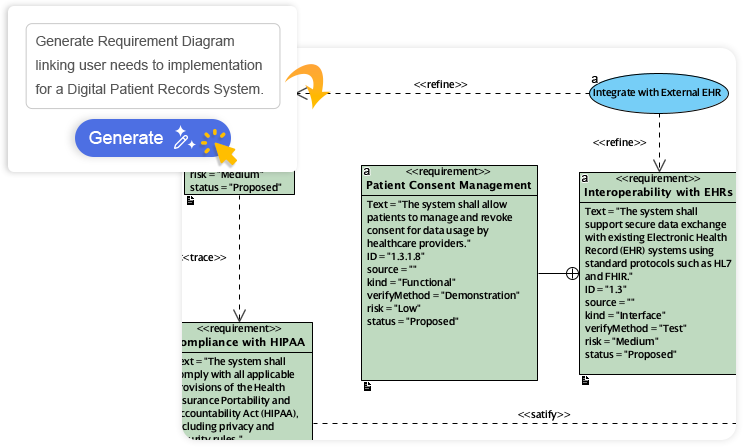
16. AI-Assisted UML Modeling
AI can accelerate modeling, but it should be treated as a modeling assistant rather than an authority.
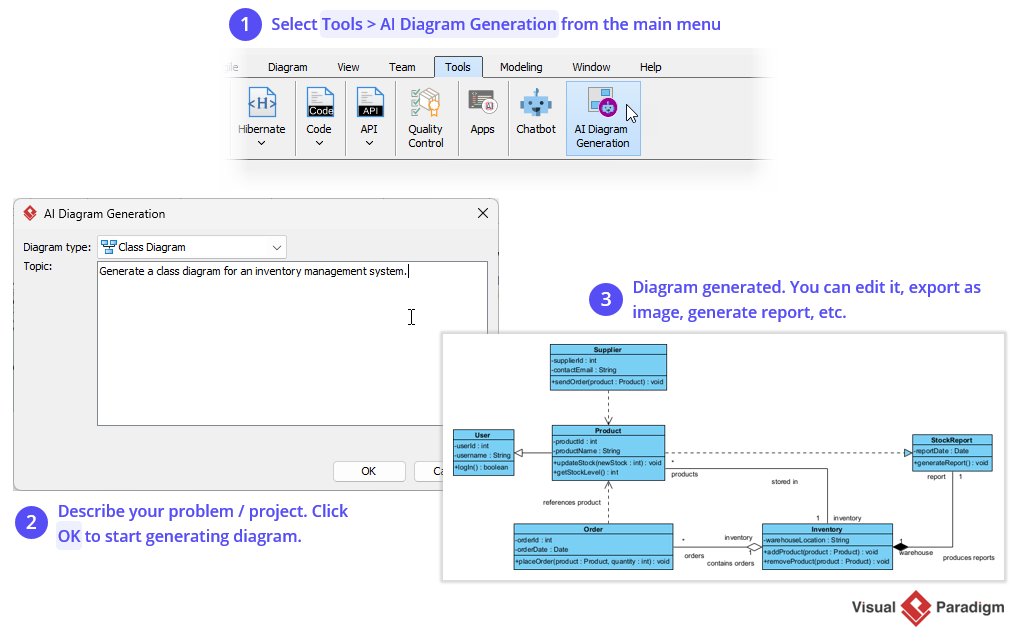
AI is useful for:
-
Converting requirements into candidate use cases
-
Extracting actors and goals
-
Proposing activity flows
-
Generating PlantUML
-
Suggesting sequence participants
-
Identifying domain entities
-
Detecting missing alternate paths
-
Reviewing diagram consistency
-
Producing documentation from diagrams
-
Translating between graphical and textual representations
-
Generating test ideas from state transitions
16.1 A productive AI workflow
A reliable workflow is:
-
Provide the requirements, constraints, and system context.
-
Ask the AI to identify assumptions and ambiguities.
-
Generate a candidate diagram.
-
Review the diagram against actual requirements.
-
Compare it with implementation and infrastructure.
-
Correct inaccurate or invented details.
-
Render and inspect the result visually.
-
Obtain review from relevant stakeholders.
-
Store the approved model in the project repository.
-
Update it when the system changes.
16.2 Prompt AI with constraints
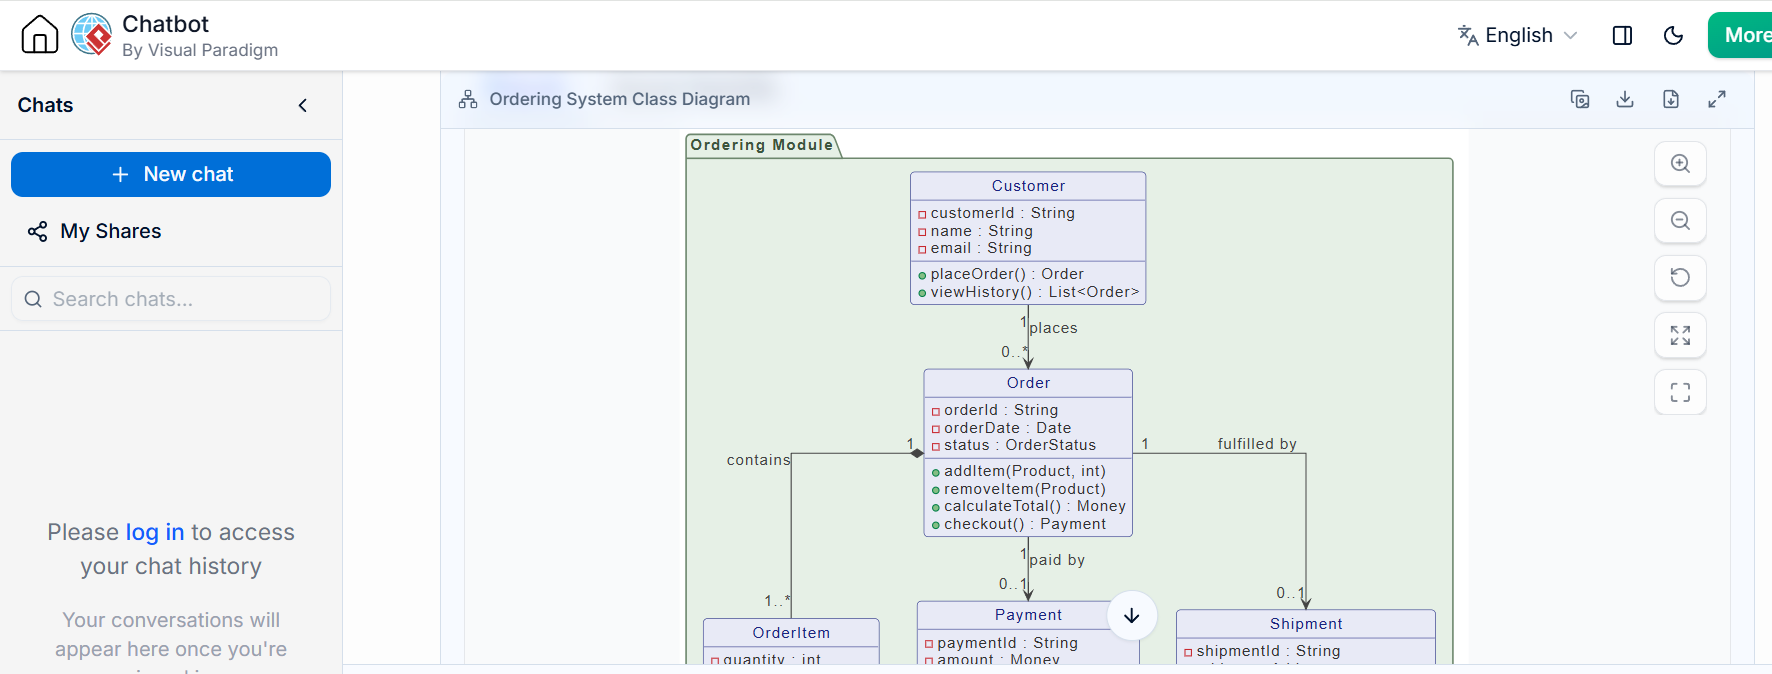
Weak prompt:
Create a UML diagram for an ordering system.
Stronger prompt:
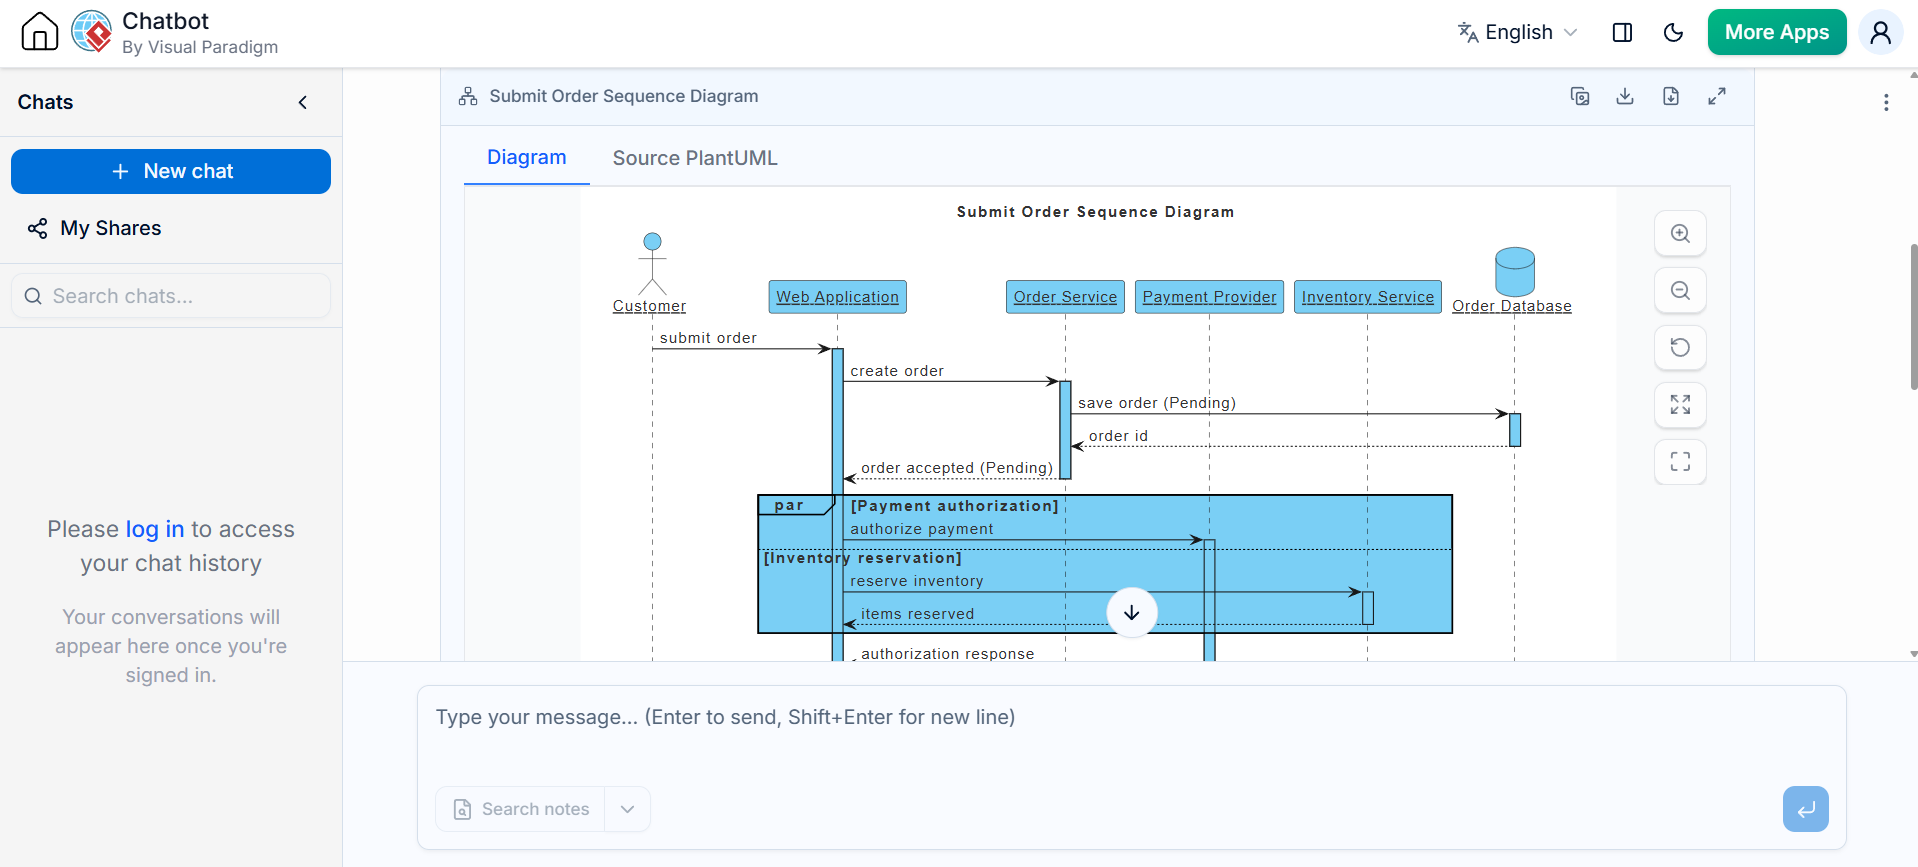
Create a PlantUML sequence diagram for submitting an order.

Participants:
- Customer
- Web application
- Order service
- Payment provider
- Inventory service
- Order database

Constraints:
- Payment must be authorized before the order is confirmed.
- Inventory reservation may occur in parallel with payment authorization.
- A declined payment must leave the order in PaymentFailed.
- A timeout should be retried once.
- Show successful, declined, and timeout paths.
- Do not invent services not listed here.
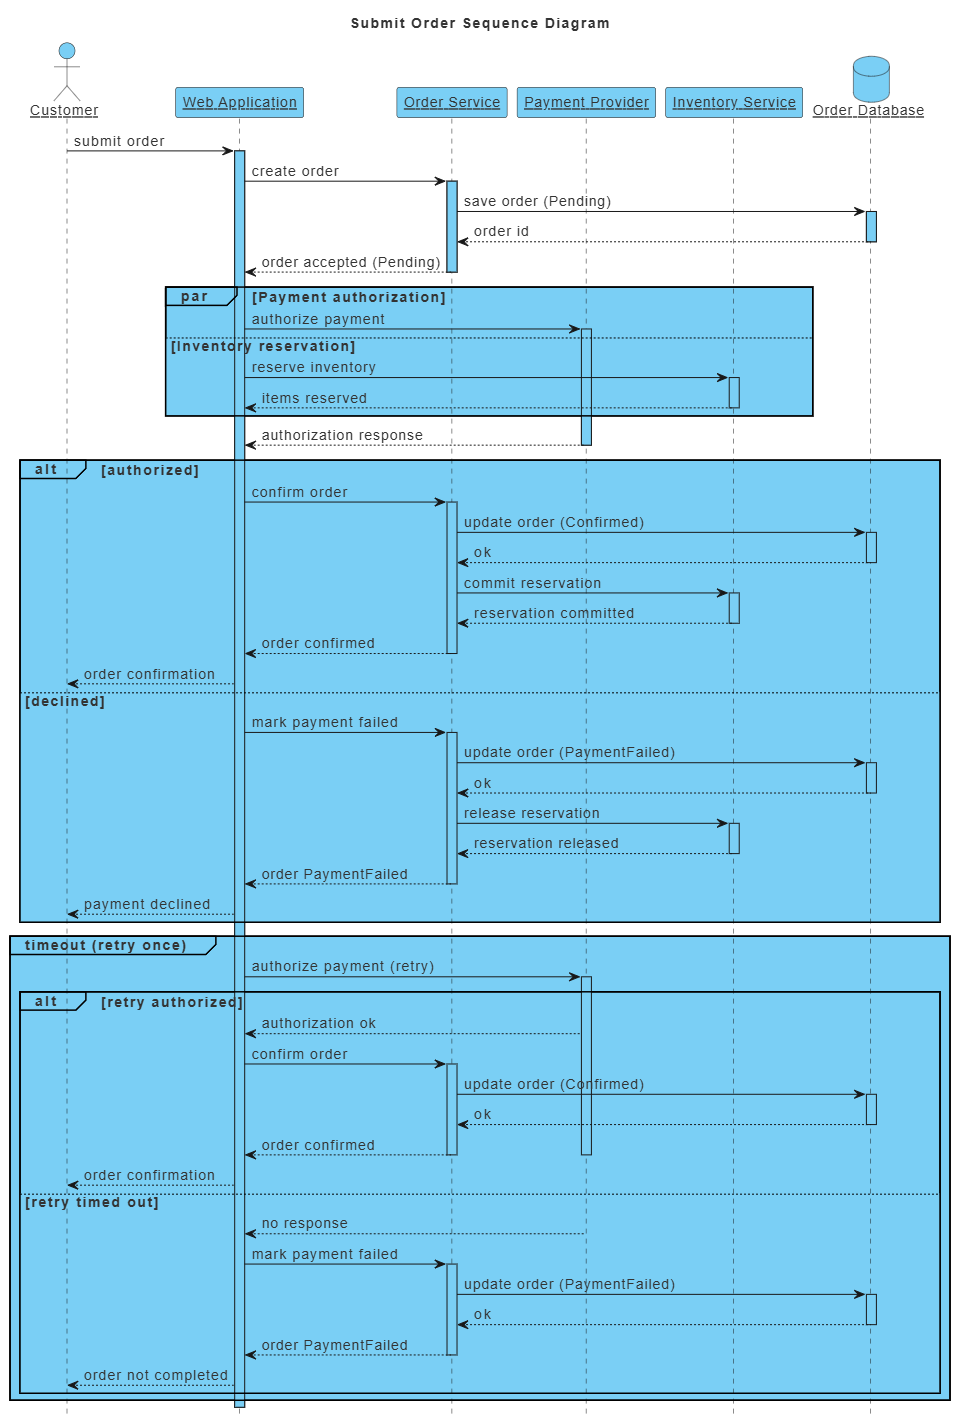
The more clearly the constraints are stated, the less likely the output is to contain unsupported architecture.
16.3 Ask AI for critique, not only generation
Useful review prompts include:
-
What requirements are not represented?
-
Which branches are missing?
-
Does this sequence diagram contradict the state machine?
-
Are any dependencies unexplained?
-
Are there responsibilities assigned to the wrong component?
-
Does the deployment model support the availability requirement?
-
Which transitions should become test cases?
-
Which assumptions need confirmation?
16.4 Common AI modeling failures
AI-generated models may:
-
Invent actors or services
-
Confuse business roles with technical components
-
Add unsupported database tables
-
Assume synchronous communication
-
Omit failure paths
-
Misrepresent ownership
-
Use UML relationships incorrectly
-
Produce diagrams that are syntactically valid but semantically wrong
-
Mix abstraction levels
-
Treat guesses as requirements
The key principle is:
AI can generate a draft quickly, but only domain and technical review can establish whether the draft is true.
17. Validating UML Against Reality
A diagram is valuable only if it remains aligned with the system.
17.1 Validate against requirements
Check:
-
Does every important requirement appear in one or more models?
-
Are actors and goals correct?
-
Are business rules represented?
-
Are exceptions included?
-
Are nonfunctional requirements reflected where relevant?
17.2 Validate against implementation
Check:
-
Do component boundaries match the code?
-
Do sequence participants exist?
-
Are interfaces and messages accurate?
-
Are class responsibilities realistic?
-
Are asynchronous operations shown correctly?
-
Are state transitions enforced by the implementation?
17.3 Validate against operations
Check:
-
Can the deployment diagram actually be deployed?
-
Are network connections realistic?
-
Are external systems represented?
-
Are databases, queues, caches, and storage included where important?
-
Are failure and scaling assumptions plausible?
17.4 Validate across diagrams
Look for contradictions such as:
-
A use case names an actor absent from the system context
-
A sequence diagram calls a component not shown in the architecture
-
A state machine permits a transition not supported by the business rules
-
A class diagram shows one-to-many while the database enforces one-to-one
-
A deployment diagram omits a service required by the sequence diagrams
-
An activity diagram shows parallel operations while the implementation is strictly sequential
Cross-diagram consistency is often more important than the artistic quality of any individual diagram.
18. Traceability
Traceability links models to requirements, code, tests, and operational artifacts.
A simple traceability chain might be:
Requirement
  → Use case
    → Activity flow
      → Sequence scenario
        → Component
          → Implementation
            → Automated test
For a stateful domain object:
Business rule
  → State transition
    → Guard condition
      → Test case
Traceability does not require connecting every element to everything else. Focus on high-value relationships:
-
Safety-critical behavior
-
Regulatory requirements
-
Security controls
-
Important integrations
-
Complex business rules
-
High-risk architectural decisions
19. Version Control and Model Maintenance
A diagram is documentation, and documentation becomes unreliable when it is not maintained.
19.1 Store models near the work they describe
Possible approaches include:
-
UML files in the source repository
-
Architecture documentation repositories
-
A shared modeling repository
-
Generated diagrams published with technical documentation
-
Links between requirements and model elements
19.2 Review diagrams with code
For architecture or behavior changes, include the relevant diagram update in the same change as the implementation where practical.
Reviewers can then assess:
-
Whether the implementation matches the intended design
-
Whether the design change is complete
-
Whether dependencies have changed
-
Whether new failure paths exist
-
Whether deployment implications were considered
19.3 Prefer fewer authoritative diagrams
Multiple contradictory diagrams are worse than one incomplete diagram. Establish which diagram is authoritative for each concern.
For example:
-
Component diagram: authoritative for major service boundaries
-
Deployment diagram: authoritative for production topology
-
State machine: authoritative for order lifecycle
-
Class diagram: authoritative for domain relationships
20. Common Modeling Mistakes
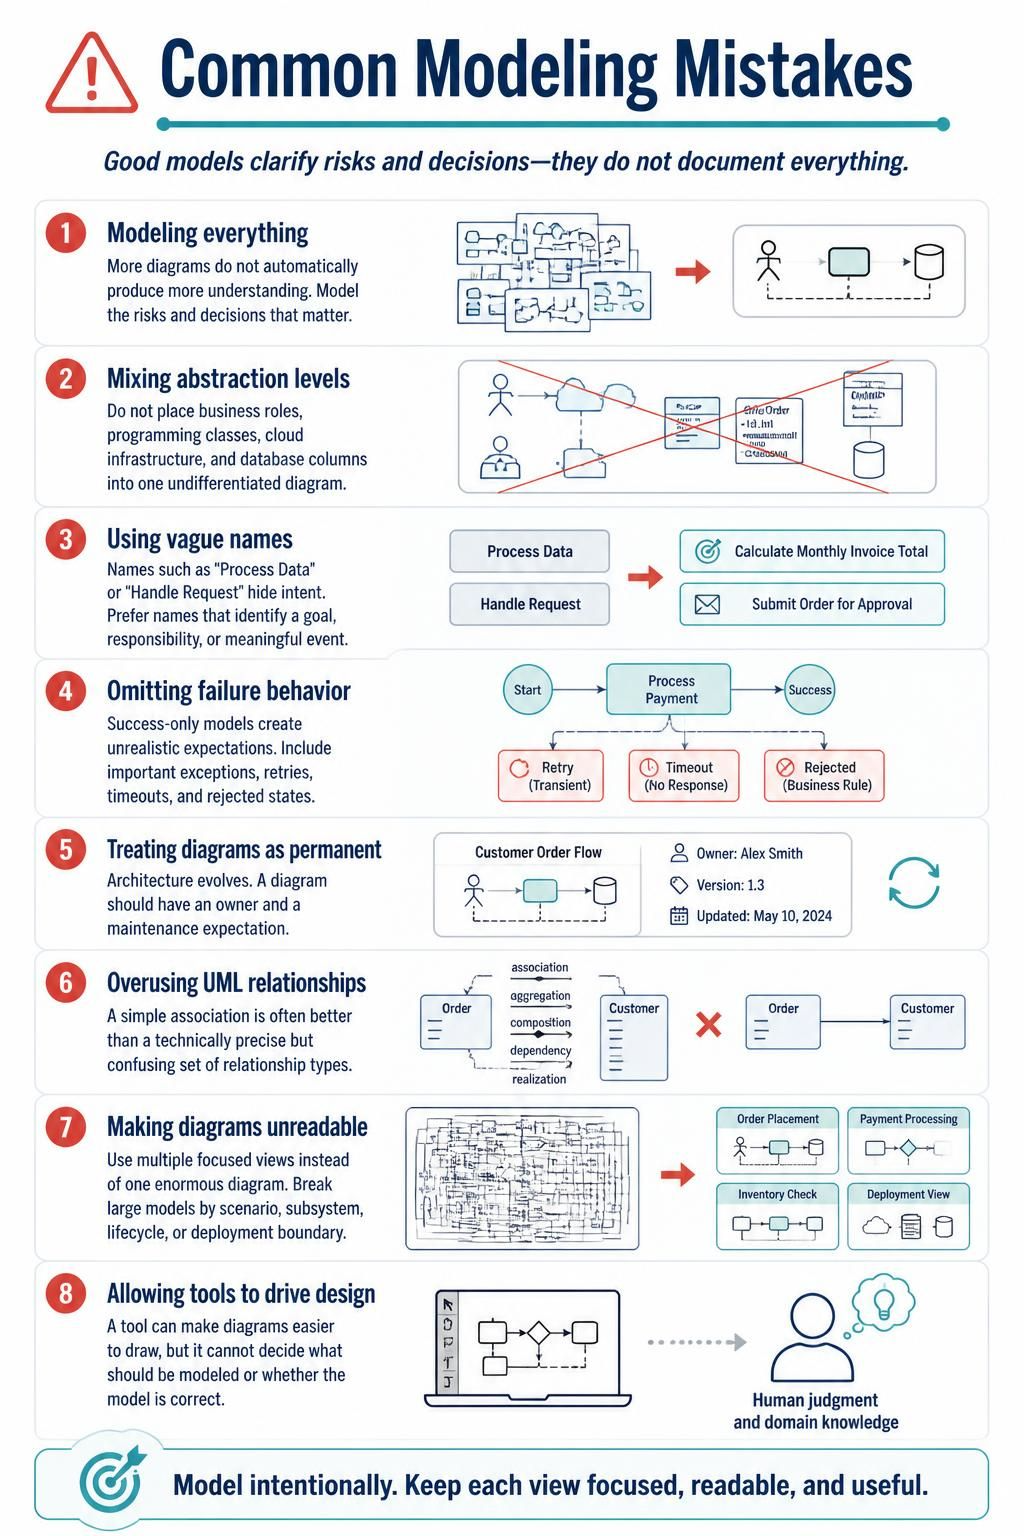
Modeling everything
More diagrams do not automatically produce more understanding. Model the risks and decisions that matter.
Mixing abstraction levels
Do not place business roles, programming classes, cloud infrastructure, and database columns into one undifferentiated diagram.
Using vague names
Names such as “Process Data” or “Handle Request” hide intent. Prefer names that identify a goal, responsibility, or meaningful event.
Omitting failure behavior
Success-only models create unrealistic expectations. Include important exceptions, retries, timeouts, and rejected states.
Treating diagrams as permanent
Architecture evolves. A diagram should have an owner and a maintenance expectation.
Overusing UML relationships
A simple association is often better than a technically precise but confusing set of relationship types.
Making diagrams unreadable
Use multiple focused views instead of one enormous diagram. Break large models by scenario, subsystem, lifecycle, or deployment boundary.
Allowing tools to drive design
A tool can make diagrams easier to draw, but it cannot decide what should be modeled or whether the model is correct.
21. A Practical Modeling Workflow
A team can adopt the following workflow for a feature or system.
Step 1: Establish scope
Create a lightweight context view and identify:
-
System boundary
-
Primary users
-
External systems
-
Major goals
Step 2: Identify use cases
Write use cases as actor goals. Group related functionality and identify the most important scenarios.
Step 3: Model the main workflow
Use an activity diagram to show:
-
Normal flow
-
Decisions
-
Responsibilities
-
Parallel work
-
Exceptions
Step 4: Select critical scenarios
Create sequence diagrams for the interactions that are important, complex, risky, or integration-heavy.
Step 5: Define domain structure
Create a conceptual or design-level class diagram for the concepts involved in those scenarios.
Step 6: Establish architectural boundaries
Use a component diagram to show:
-
Major modules or services
-
Interfaces
-
Dependencies
-
Ownership
-
Integration points
Step 7: Model deployment
Create a deployment diagram when infrastructure, security, scaling, availability, or operations are significant concerns.
Step 8: Model lifecycles
Create state-machine diagrams for entities whose behavior depends on status or permitted transitions.
Step 9: Validate
Compare the models with:
-
Requirements
-
Existing code
-
Tests
-
Data structures
-
Infrastructure
-
Operational constraints
Step 10: Maintain
Update the affected diagrams when behavior, interfaces, ownership, or deployment changes.
22. A Minimal Deliverable for a Typical System
For a medium-sized application, a practical baseline might be:
-
One system context or use case view
-
Two to five activity diagrams for important business processes
-
Two to five sequence diagrams for critical scenarios
-
One domain class diagram
-
One component diagram
-
One production deployment diagram
-
State-machine diagrams for key lifecycle entities
This is not a mandatory quota. Some systems may need fewer diagrams; others may need more. The appropriate number depends on complexity, risk, team size, regulation, and the cost of misunderstanding.
23. Tool Selection Strategy
Different tools serve different modeling needs.
| Need | Suitable approach |
|---|---|
| Stakeholder workshops | Graphical UML tool |
| Formal repository and traceability | Visual modeling platform |
| Developer-owned architecture documentation | PlantUML or VPasCode |
| Diagrams reviewed in pull requests | Text-based diagrams |
| Rapid first draft | AI-assisted generation |
| High-fidelity operational topology | Graphical or infrastructure-aware modeling |
| Long-lived documentation | Version-controlled source plus automated rendering |
| Exploratory modeling | Whiteboard or lightweight diagramming |
A team does not need to select one tool for every situation. A mixed approach can work well if the source of truth and maintenance responsibilities are clear.
Conclusion
A practical UML strategy is not about using every diagram type. It is about selecting the smallest set of views that makes the system understandable.
The seven-diagram core provides broad coverage:
-
Use case diagrams explain goals and scope.
-
Activity diagrams explain workflows and responsibilities.
-
Sequence diagrams explain collaboration and timing.
-
Class diagrams explain structure and domain concepts.
-
Component diagrams explain architectural boundaries.
-
Deployment diagrams explain runtime placement and infrastructure.
-
State-machine diagrams explain lifecycle rules.
Visual Paradigm can support graphical modeling, traceability, and repository-based collaboration. VPasCode and PlantUML make diagrams easier to version, review, generate, and maintain with source code. AI can accelerate drafting, transformation, and review, but its output must be checked against real requirements, actual implementation, and operational constraints.
The strongest modeling practice is disciplined rather than exhaustive:
-
Model decisions, risks, and behavior that matter.
-
Choose the diagram type that best answers the question.
-
Keep each diagram focused on one abstraction level.
-
Connect related diagrams through consistent names and traceability.
-
Validate models against requirements, code, tests, and deployment.
-
Store and review diagrams as maintainable project artifacts.
-
Remove diagrams that no longer provide value.
Effective UML is not measured by the number of diagrams produced. It is measured by whether the models help people build, test, operate, and change the system with greater confidence.
Reference
- VPasCode: AI-Assisted Diagram-as-Code with PlantUML, Mermaid, and Graphviz: Official guide covering VPasCode’s text-to-diagram engine, syntax best practices, and AI-assisted modification workflows.
- From “Drawing Chores” to “Articulation”: Overview of the AI Chatbot: Explains how Visual Paradigm’s AI Chatbot converts natural language into standards-compliant UML and other diagrams.
- Power Visual Paradigm AI Chatbot with NotesKeep Knowledge Base: Shows how to connect NotesKeep repositories as a knowledge source for AI-driven diagram generation and requirement synthesis.
- Revolutionize Your Mac UML Modeling with Visual Paradigm: Overview of Visual Paradigm’s UML 2.x support, code engineering, and model traceability on macOS.
- Introducing AI VPP Chatbot in Visual Paradigm 18.1: Release announcement for the AI VPP Chatbot that lets users query .vpp project files through natural language.
- VPasCode Plans & Pricing: Pricing and feature comparison for VPasCode’s free tier and integration with Visual Paradigm Online/Desktop editions.
- Welcome to Visual Paradigm VPasCode: The Diagram-as-Code Shift: Introduces the Diagram-as-Code workflow and the unified rendering environment for PlantUML, Mermaid, and Graphviz.
- Native AI Diagram Generation in Visual Paradigm VPasCode: Details VPasCode’s embedded AI that generates and modifies PlantUML/Mermaid/Graphviz diagrams directly within the editor.