


Executive Summary
The C4 Model is a lightweight, hierarchical framework for visualizing software architecture at four levels of abstraction: Context, Container, Component, and Code. Combined with Visual Paradigm’s native C4 support—including AI-powered diagram generation and professional modeling features—teams gain a powerful, standards-compliant approach to documenting and communicating system design.
Part 1: C4 Model Fundamentals
What Is the C4 Model?
The C4 Model provides a structured, notation-independent method for creating architecture diagrams that scale from high-level stakeholder views to detailed implementation views. Unlike UML or free-form drawing tools, C4 emphasizes:
-
Clarity over completeness: Each diagram answers specific questions for a defined audience
-
Progressive disclosure: Zoom from system landscape → context → containers → components → code
-
Audience alignment: Technical and non-technical stakeholders can engage with appropriate abstraction levels
The Four Core Levels (Plus Two Extensions)
| Level | Purpose | Primary Audience | Key Elements |
|---|---|---|---|
| System Landscape | Shows organizational ecosystem and system relationships | Executives, Product Owners | Systems, external dependencies |
| System Context | High-level view of your system and its external interactions | All stakeholders | People, software systems, relationships |
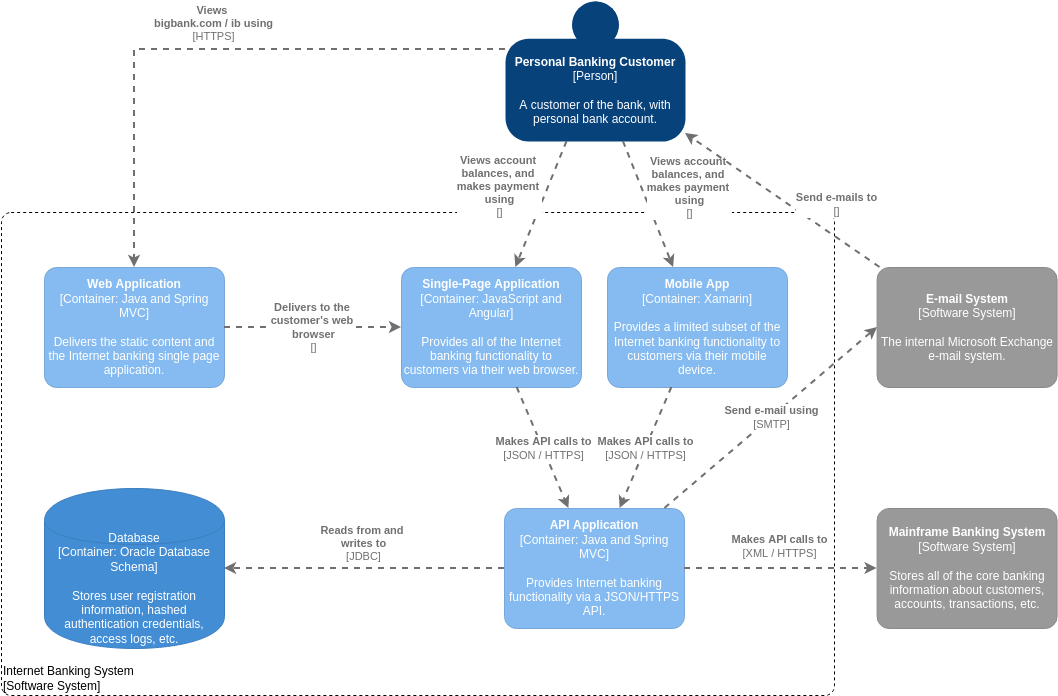
| Container | Technical building blocks: apps, databases, microservices | Architects, Tech Leads | Containers, protocols, tech stacks |
| Component | Internal structure of a single container | Development Teams | Components, interfaces, dependencies |
| Dynamic | Runtime behavior and interaction flows | Engineers, DevOps | Sequences, events, async flows |
| Deployment | Infrastructure mapping: nodes, environments, scaling | Platform/DevOps Teams | Nodes, containers, environments |
💡 Note: Visual Paradigm supports all six diagram types natively, extending the original C4 framework with Landscape, Dynamic, and Deployment views .
Guidelines for Effective C4 Diagramming
✅ Do:
-
Start with Context: Always begin at the highest abstraction level before drilling down
-
Label relationships clearly: Use verb phrases like “uses HTTPS,” “publishes events to,” “queries”
-
Keep diagrams focused: One diagram = one purpose, one audience
-
Leverage descriptions: Add concise text to elements; good diagrams balance visuals with context
-
Link diagrams hierarchically: Enable navigation from Context → Container → Component
❌ Avoid:
-
Overloading diagrams: Resist adding every detail to a single view
-
Mixing abstraction levels: Keep Context diagrams free of implementation details
-
Neglecting maintenance: Assign ownership; outdated diagrams erode trust
-
Ignoring the audience: A CTO needs different information than a backend engineer
When to Use Each Level

flowchart LR
    A[New Project/Onboarding] --> B[System Landscape]
    B --> C[System Context]
    C --> D{Technical Planning?}
    D -->|Yes| E[Container Diagram]
    D -->|No| F[Share with Stakeholders]
    E --> G{Complex Internal Logic?}
    G -->|Yes| H[Component Diagram]
    G -->|Async/Event Flows| I[Dynamic Diagram]
    E --> J{Deploying to Infra?}
    J -->|Yes| K[Deployment Diagram]
Rule of thumb: Most teams achieve 80% of communication value with just Context + Container diagrams. Add Component/Dynamic/Deployment views only when complexity demands it.
Part 2: Visual Paradigm for C4 Modeling – Adoption Review
Overview
Visual Paradigm Desktop (and Online) now offers full native support for all six C4 diagram types, including AI-powered generation, semantic element modeling, and enterprise-grade collaboration features.
Key Capabilities
🤖 AI-Powered Diagram Generation
-
Text-to-diagram: Describe your system in natural language; AI generates standards-compliant C4 diagrams across all six levels
-
Stakeholder-aware output: Customize detail level for “General Readers” vs. “Engineers”
-
Rapid prototyping: Generate a complete Context→Deployment suite in seconds, eliminating the “blank canvas” problem
-
C4-specific palette: Drag-and-drop Person, Software System, Container, Component elements with official styling
-
Semantic relationships: Connection tools suggest appropriate relationship types (Uses, Publishes, Calls) based on element types
-
Layout intelligence: Sweeper tool and auto-alignment keep diagrams clean as they evolve
-
Inline editing: Modify labels and properties directly on the canvas without modal dialogs
🔗 Model Navigation & Consistency
-
Hierarchical linking: Right-click a System in a Context diagram → “Create Container Diagram” to auto-generate the child view with synchronized elements
-
Sub-diagrams & references: Break complex views into manageable layers while maintaining traceability
-
Cross-project navigation: Reference elements across projects for enterprise-scale architecture modeling
📤 Publishing & Collaboration
-
Project Publisher: Export interactive HTML documentation for stakeholder review
-
Report Composer: Generate PDF/Word architecture handbooks with diagrams and descriptions
-
Version control: Built-in Git integration tracks diagram evolution and supports team collaboration
-
Cloud sync: Real-time collaboration via Visual Paradigm’s cloud platform for distributed teams
User Adoption Assessment
👍 Strengths for Adoption
| Factor | Impact |
|---|---|
| Reduced onboarding time | New team members understand system architecture faster via standardized, navigable diagrams |
| Stakeholder alignment | Non-technical audiences engage with Context diagrams; engineers drill into Components |
| Documentation sustainability | Semantic modeling + AI generation reduces maintenance overhead vs. manual drawing tools |
| Enterprise readiness | Version control, access management, and reporting meet organizational governance needs |
| Tool consolidation | Replaces multiple tools (draw.io for sketches, Structurizr for C4, Confluence for docs) |
⚠️ Considerations & Mitigations
| Challenge | Mitigation Strategy |
|---|---|
| Learning curve | Start with AI generation + templates; use Visual Paradigm’s guided tutorials |
| License cost | Evaluate ROI: reduced miscommunication, faster onboarding, and living documentation often justify investment |
| Over-engineering risk | Enforce team guidelines: “Only create Component diagrams when complexity demands it” |
| Tool lock-in | Export diagrams as PNG/SVG/PDF; C4’s notation-agnostic philosophy preserves portability |
| AI output validation | Treat AI-generated diagrams as first drafts; require architectural review before sharing |
🎯 Ideal Adoption Scenarios
Visual Paradigm’s C4 tooling delivers maximum value when:
-
Teams practice microservices, event-driven, or cloud-native architectures requiring multi-level documentation
-
Organizations need audit-ready architecture records for compliance or knowledge transfer
-
Distributed teams require centralized, versioned architecture artifacts
-
Leadership seeks visual alignment between business strategy and technical implementation
🚫 When to Consider Alternatives
-
Small, co-located teams with simple architectures may prefer lightweight tools like Excalidraw or Mermaid
-
Diagram-as-code enthusiasts might prefer Structurizr or PlantUML for Git-native workflows
-
Budget-constrained projects could start with Visual Paradigm Online’s free tier before upgrading
Part 3: Implementation Roadmap
Phase 1: Foundation (Weeks 1-2)
-
Install Visual Paradigm Desktop or activate Online account
-
Complete the C4 Model quick start guide
-
Create your first System Context diagram using AI generation or templates
-
Establish team conventions: naming, relationship labels, description standards
Phase 2: Expansion (Weeks 3-6)
-
Build Container diagrams for core systems; link them to Context views
-
Introduce Component diagrams for high-complexity containers only
-
Configure Project Publisher for stakeholder-friendly HTML exports
-
Train tech leads on hierarchical navigation and diagram linking
Phase 3: Optimization (Weeks 7-12)
-
Add Dynamic/Deployment diagrams for critical runtime or infrastructure concerns
-
Integrate with CI/CD: auto-generate architecture reports on release
-
Establish review cadence: quarterly diagram audits to prevent drift
-
Measure impact: track onboarding time, stakeholder satisfaction, change-request clarity
Success Metrics
-
📉 30% reduction in architecture-related miscommunication incidents
-
⏱️ 50% faster onboarding for new engineering hires
-
🔄 90% of architecture diagrams updated within 2 weeks of major changes
-
👥 Stakeholder satisfaction score ≥4.5/5 on architecture documentation clarity
Conclusion
The C4 Model solves a fundamental challenge in software development: communicating complex architecture clearly across diverse audiences. When paired with Visual Paradigm’s native C4 support—including AI generation, semantic modeling, and enterprise collaboration—teams gain a sustainable, scalable approach to architecture documentation.
Key takeaway: Start simple. Create a System Context diagram this week. Let Visual Paradigm’s AI handle the heavy lifting. Iterate based on feedback. The goal isn’t perfect diagrams—it’s shared understanding.
“Architecture documentation that no one reads is technical debt. C4 + Visual Paradigm helps you create documentation people actually use.”
Further Resources
- Visual Paradigm C4 Feature Overview
- Official C4 Model Reference
- Visual Paradigm C4 Tutorials
- AI C4 Generator Demo
This post is also available in Deutsch, Español, Français, English, Bahasa Indonesia, 日本語, Polski, Ру́сский, Việt Nam, 简体中文 and 繁體中文.