


Project management often involves navigating intricate webs of dependencies, stakeholders, and logistics. When these webs become tangled, efficiency drops, costs rise, and delivery timelines slip. This is where Business Process Model and Notation (BPMN) becomes an indispensable asset. It provides a standardized graphical language to map, analyze, and improve workflows.
In this guide, we explore a practical case study focused on optimizing a complex supply chain. We will walk through the transformation from a chaotic, manual operation to a streamlined, automated flow using BPMN principles. This approach is designed for project managers seeking clarity and control without needing to become technical experts.
📦 The Scenario: Apex Distribution Network
Consider a mid-sized logistics firm, Apex Distribution, responsible for moving electronics from manufacturing hubs in Asia to retail centers in Europe. The project manager (PM) overseeing this operation faces significant challenges.
- Fragmented Data: Information exists in spreadsheets, emails, and legacy systems.
- Manual Handoffs: Tasks often stall waiting for human approval or data entry.
- Visibility Gaps: Stakeholders cannot see the status of a shipment in real-time.
- Compliance Risks: Regulatory checks are often performed late, causing delays.
The goal is to reduce lead time by 20% and eliminate manual errors. The chosen methodology is BPMN modeling.
🔍 Phase 1: Mapping the As-Is Process
Before optimization can begin, the current state must be documented accurately. This is the “As-Is” model. In BPMN, we use specific symbols to represent the flow of work.
Understanding the Core Symbols
Project managers do not need to memorize every symbol, but understanding the core set is vital for reading and creating models.
- Start Event (Green Circle): Indicates where a process begins, such as receiving a purchase order.
- End Event (Red Circle): Marks the conclusion, like successful delivery confirmation.
- Task (Rectangular Box): A unit of work, such as “Verify Invoice” or “Update Inventory”.
- Gateway (Diamond): A decision point where the path splits, such as “Is Stock Available?”.
- Sequence Flow (Arrow): Shows the order in which activities occur.
- Pool and Lane: A Pool represents the entire organization or process. Lanes divide responsibilities (e.g., Warehouse Team, Logistics Team, Finance Team).
Documenting the Flow
Using these symbols, the PM mapped the existing workflow. The model revealed a critical issue: a lack of synchronization between the Finance and Logistics lanes.
When a shipment arrived, the Logistics lane processed it immediately. However, the Finance lane was not notified until the invoice arrived days later. This caused payment delays and strained supplier relationships.
⚠️ Phase 2: Identifying Bottlenecks and Pain Points
Once the As-Is diagram was complete, the team analyzed it for inefficiencies. This step is crucial for determining where value is lost.
Common Supply Chain Issues
| Issue Type | Observation in BPMN Model | Impact on Supply Chain |
|---|---|---|
| Manual Handoffs | Email loops between lanes | High latency, data entry errors |
| Unnecessary Loops | Repetitive approval gates | Slow processing times |
| Parallel Inefficiency | Tasks done sequentially that could be parallel | Extended lead time |
| Exception Handling | No defined path for rejected goods | Uncertainty, ad-hoc fixes |
Specific Findings
The analysis highlighted three major bottlenecks:
- Information Silos: Data entered in one system was not visible to others.
- Approval Delays: Every order required three layers of manual sign-off.
- Exception Ambiguity: If a shipment was damaged, the process stopped, and no one knew the next steps.
By visualizing these issues in the BPMN diagram, the PM could communicate the problems clearly to stakeholders without jargon.
🛠️ Phase 3: Designing the To-Be Process
With the problems identified, the team designed the “To-Be” process. This optimized model integrates automation and clearer decision logic.
Key Changes Implemented
- Automated Notifications: Instead of emails, the system triggers alerts automatically when a task is completed.
- Parallel Processing: Credit checks and inventory checks now happen simultaneously.
- Exception Paths: A clear path for damaged goods is added, ensuring the process never truly stops.
- Role Clarification: Lanes are adjusted to show exactly who is responsible for each task.
The Role of Gateways
Gateways are the brain of the BPMN model. In the new design, the PM utilized specific gateway types to handle logic.
- Exclusive Gateway (XOR): Used for “Yes/No” decisions. For example, if the invoice matches the order (Yes), proceed. If not (No), flag for review.
- Inclusive Gateway (OR): Used when multiple paths might activate. If a shipment contains both electronics and batteries, both regulatory checks trigger.
- Parallel Gateway (AND): Used to split work. The model splits the order into “Shipping” and “Billing” tasks that run at the same time.
This logical precision ensures that the supply chain adapts to real-world conditions rather than forcing a linear path.
🚀 Phase 4: Implementation and Monitoring
Designing the model is only half the battle. Implementation requires change management and technical execution.
Steps for Project Managers
- Stakeholder Validation: Walk the team through the To-Be diagram. Ensure everyone understands their new role.
- Configuration: Translate the diagram into the workflow engine. Map tasks to specific systems (e.g., ERP, CRM).
- Testing: Run simulations. Create test cases for normal flow and exceptions.
- Go-Live: Deploy the process in a controlled environment.
- Continuous Improvement: Monitor performance data and update the model as needed.
Monitoring Key Metrics
After implementation, the PM tracks performance against the baseline established in Phase 1.
- Cycle Time: How long does an order take from start to finish?
- Throughput: How many orders are processed per day?
- Exception Rate: How often do we hit the exception paths?
- Cost per Order: Has the operational cost decreased?
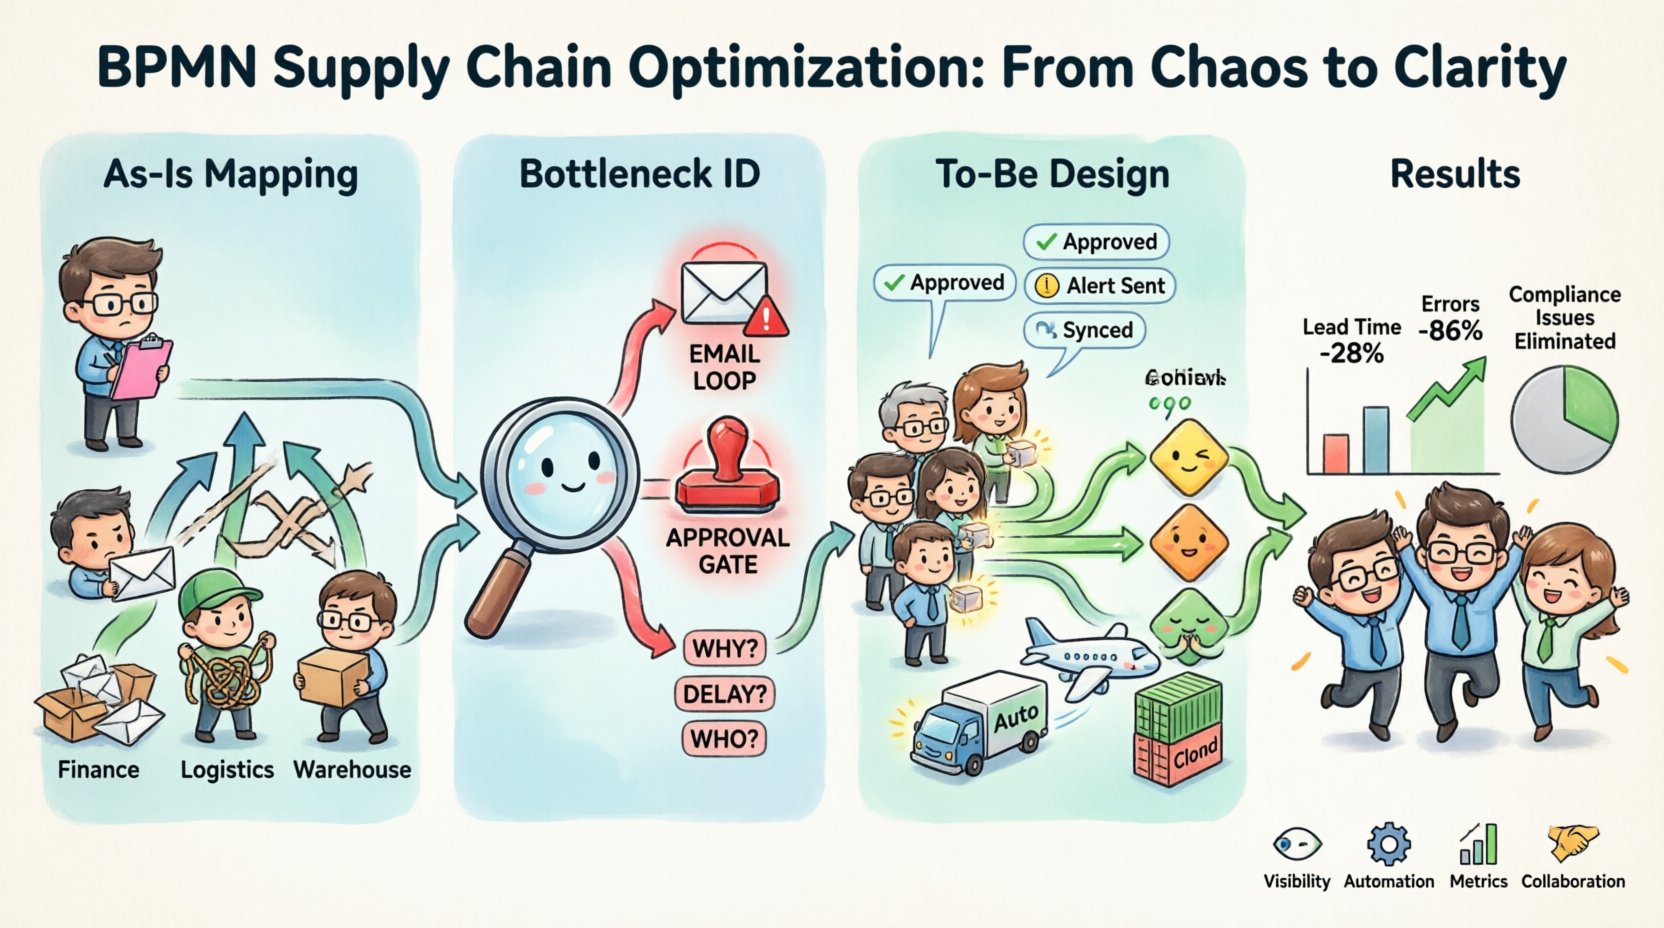
📊 Case Study Results
After six months of operating the optimized BPMN-driven supply chain, Apex Distribution saw measurable improvements.
| Metric | Before Optimization | After Optimization | Change |
|---|---|---|---|
| Average Lead Time | 14 Days | 10 Days | -28% |
| Data Entry Errors | 15% of orders | 2% of orders | -86% |
| Employee Satisfaction | Low (Repetitive tasks) | High (Automated tasks) | Improved |
| Compliance Issues | 4 per month | 0 per month | Eliminated |
The results demonstrate that process modeling is not just about drawing pictures. It is about structuring work to reduce friction.
🧠 Advanced BPMN Concepts for PMs
To handle even more complex scenarios, Project Managers can explore advanced BPMN features.
Sub-Processes
When a process becomes too large, it can be broken down. A Sub-Process allows you to group related tasks into a single box. For example, the “Shipping” lane could contain a Sub-Process for “International Customs Clearance”. This keeps the main diagram clean while allowing detail where needed.
Message Flows
Supply chains often involve external parties. Message Flows (dashed lines) represent communication between different participants or pools. This is essential for modeling interactions with suppliers, carriers, and customers outside the organization.
Event-Based Gateways
These allow the process to wait for a specific event. For instance, a shipment process might wait for a “Tracking Update” event. If the event doesn’t arrive within 24 hours, a timeout event triggers a notification to the PM.
🤝 Collaboration and Governance
Process management is a team effort. Governance ensures the models remain accurate over time.
Best Practices for Governance
- Version Control: Always save a new version when a process changes. Do not overwrite the original model.
- Documentation: Keep a text description alongside the diagram explaining the business rules.
- Access Control: Limit who can edit the model. Only authorized process owners should make changes.
- Training: Ensure the team knows how to read the diagrams. A diagram no one understands is useless.
🛡️ Risk Management in BPMN
One of the greatest strengths of BPMN is its ability to model risk. By explicitly defining where things can go wrong, you prepare for them.
Modeling Failure Points
In the supply chain model, identify where failure is most likely.
- Supplier Failure: What happens if the supplier does not ship?
- System Failure: What happens if the tracking system goes down?
- Human Error: What happens if the wrong data is entered?
For each risk, define a compensating task or an exception path. This proactive approach reduces downtime when incidents occur.
📈 Future Trends in Process Modeling
The field of process management is evolving. Project managers should stay aware of these trends.
- Process Mining: Using data logs to automatically generate process models. This validates if the “As-Is” model matches reality.
- AI Integration: Using artificial intelligence to suggest process improvements or predict bottlenecks.
- Mobile Modeling: Tools that allow stakeholders to view and comment on diagrams from mobile devices.
These technologies do not replace the need for human judgment. They simply provide better data to inform that judgment.
💡 Key Takeaways for Project Managers
Optimizing a supply chain requires more than just better logistics software. It requires a clear understanding of the workflow. BPMN provides that clarity.
By following the steps outlined in this case study, PMs can:
- Visualize complex workflows clearly.
- Identify hidden bottlenecks and inefficiencies.
- Standardize communication across teams.
- Measure performance objectively.
- Build a culture of continuous improvement.
The investment in modeling pays off in reduced waste, faster delivery, and happier stakeholders.
📝 Summary
This case study demonstrated how Business Process Model and Notation can transform a complex supply chain. From mapping the As-Is state to designing the To-Be state, BPMN offers a structured approach to problem-solving. By leveraging standard symbols, gateways, and lanes, project managers can communicate effectively and implement changes with confidence.
The journey from chaos to order is not instantaneous. It requires discipline, data, and the willingness to question how work is currently done. With BPMN as the foundation, Project Managers can navigate complexity and drive real value for their organizations.
Start small. Pick one process. Map it. Improve it. Repeat. The path to efficiency is paved with clear models.
This post is also available in Deutsch, Español, فارسی, Français, English, Bahasa Indonesia, 日本語, Polski, Portuguese, Ру́сский, Việt Nam, 简体中文 and 繁體中文.