


Root Cause Analysis Made Smarter with AI-Powered Documentation

🔍 What Is a Fishbone Diagram?
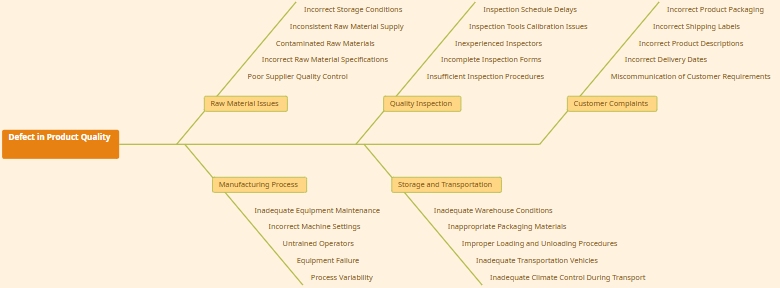
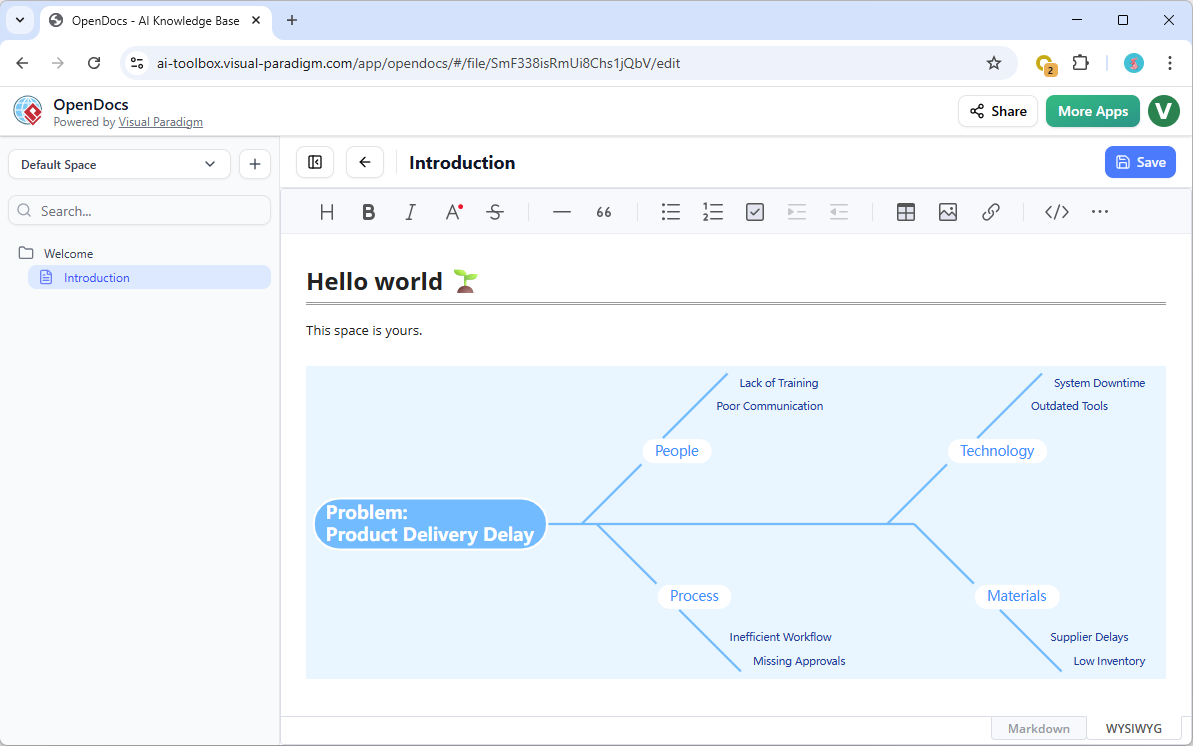
A Fishbone Diagram, also known as an Ishikawa Diagram or Cause-and-Effect Diagram, is a powerful visual tool used for root cause analysis (RCA). It helps teams systematically explore and map out the potential causes of a specific problem — the “effect” — in a structured, hierarchical format.
🐟 Why It’s Called a Fishbone:
-
The diagram resembles a fish skeleton:
-
Head (Fish’s Head): The problem or effect.
-
Spine (Main Axis): The central line leading to the head.
-
Bones (Branches): Major categories of causes (e.g., 6Ms).
-
Sub-Bones: Specific root causes under each category.
-
🧩 Classic 6Ms Framework:
| Category | Meaning |
|---|---|
| Man | Human resources, skills, knowledge, fatigue |
| Machine | Equipment, tools, technology |
| Method | Processes, procedures, standards |
| Material | Raw inputs, supplies, components |
| Measurement | Data collection, metrics, accuracy |
| Mother Nature / Environment | Climate, location, external conditions |
💡 Customize these categories based on context — e.g., “People, Process, Platform, Policy” for software development.
🌐 Why Use Fishbone Diagrams in OpenDocs?
OpenDocs is Visual Paradigm’s AI-powered knowledge management platform that unifies documentation, diagramming, and intelligent content generation in one seamless workspace.
With the official launch of Fishbone Diagram support on February 2, 2026, teams gain a new way to conduct deep, collaborative root cause analysis directly within their documentation environment.
✅ Key Advantages of Using Fishbone in OpenDocs:
| Benefit | Description |
|---|---|
| Integrated Workflow | Perform RCA without switching tools — build, analyze, document, and act—all in one place. |
| Contextual Embedding | Insert diagrams into Markdown pages to support technical reports, post-mortems, or project summaries. |
| Centralized Knowledge | Keep all RCA artifacts (diagrams, notes, action plans) within the same Space, accessible to the whole team. |
| AI-Powered Enhancements | Use AI to generate summaries, suggest causes, create illustrative visuals, or auto-structure content. |
| Multi-Modal Collaboration | Combine Fishbone with Mind Maps, Timelines, and Flowcharts for holistic problem-solving. |
🛠️ Ideal for: Quality Assurance Engineers, DevOps Teams, Project Managers, Product Owners, and Process Improvement Specialists.
📋 Requirements
To use Fishbone Diagrams in OpenDocs, ensure you meet the following:
| Requirement | Details |
|---|---|
| Edition | Visual Paradigm Desktop Professional or Visual Paradigm Online Combo |
| Access | Log in via your licensed workspace: https://ai.visual-paradigm.com/tool/opendocs/ |
| Feature Availability | Available as of February 2, 2026 (v2026.1+) |
| Supported Formats | Exportable to PNG, SVG, PDF; embeddable in Markdown pages |
⚠️ Note: Basic editions do not include Fishbone support. Upgrade your plan if unavailable.
🛠️ How to Create a Fishbone Diagram in OpenDocs
OpenDocs offers two flexible modes for creating Fishbone Diagrams — ideal for different use cases.
📌 Method 1: Embed in a Document Page (Contextual Integration)
Perfect for integrating RCA into reports, post-mortems, or project documentation.
✅ Steps:
-
Open your existing OpenDocs page (e.g., a project summary or incident report).
-
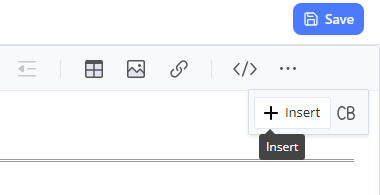
Click the Edit button (top-right corner).
-
Place your cursor in the Markdown editor where you want the diagram to appear.
-
Click the Insert button in the bottom toolbar.
-
From the dropdown menu, select:
➤ Mind Maps > Fishbone Diagram -
The Fishbone Diagram editor opens in full view.
-
Begin building:
-
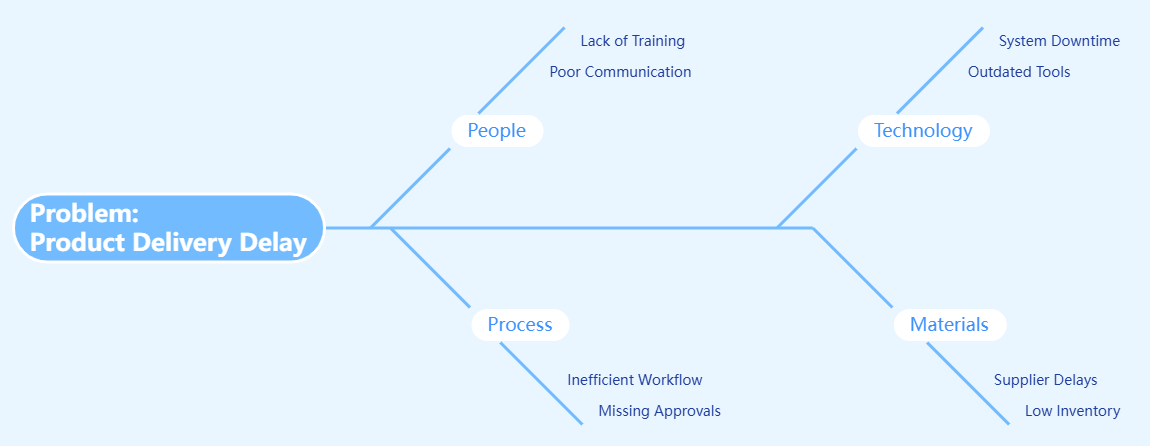
Enter the problem statement in the head (e.g., “Delayed delivery by 30% in Q1”).
-
Add main categories as branches (e.g., Man, Machine, Method).
-
Expand each branch with sub-causes (e.g., “Lack of training,” “Outdated software”).
-
-
Use the drag-and-drop editor to reposition, resize, or style elements.
-
Customize:
-
Colors
-
Fonts
-
Connector styles
-
Icons (via AI-generated suggestions)
-
-
Click Save (top-right) → Close the editor.
-
The diagram appears inline with your text, ready for review and sharing.
📝 Tip: Use this method to link your Fishbone to action items, timelines, or risk registers.
📌 Method 2: Create as a Standalone Component Page (Dedicated Analysis)
Best for deep-dive sessions, team workshops, or standalone RCA documentation.
✅ Steps:
-
In the Table of Contents (sidebar), click the + icon at the top.
-
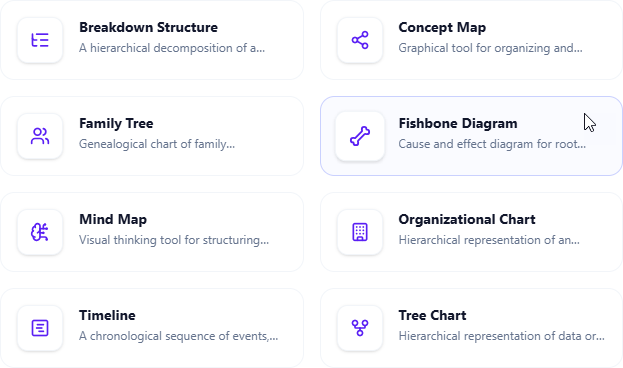
Select New Component Page.
-
Choose Mind Maps > Fishbone Diagram.
-
The full-featured Fishbone editor loads in full-screen mode.
-
Build your diagram step-by-step:
-
Define the effect at the head.
-
Add major cause categories.
-
Drill down into specific root causes using brainstorming.
-
-
Use the AI Assistant (bottom panel) to:
-
Suggest missing categories
-
Generate cause examples
-
Draft a summary of findings
-
Create a visual representation of the diagram
-
-
Once complete, click Save (top-right).
-
The diagram is now a standalone page, automatically linked in your Space.
🔗 You can later link this page from other documents using
[Fishbone: Project Delay]syntax.
🎯 Best Practices for Effective Root Cause Analysis
| Practice | Why It Matters |
|---|---|
| 1. Define the Problem Clearly | Use SMART criteria: Specific, Measurable, Achievable, Relevant, Time-bound. Example: “Customer onboarding failed for 40% of users in January.” |
| 2. Select Relevant Cause Categories | Adapt the 6Ms or use industry-specific frameworks (e.g., 4Ps in marketing: People, Process, Product, Price). |
| 3. Brainstorm Collaboratively | Invite cross-functional team members. Use OpenDocs’ real-time editing and comment threads to collect input. |
| 4. Apply the 5 Whys Technique | For each sub-cause, ask “Why?” repeatedly until you reach a root cause (e.g., Why was the system down? → Because the server crashed. Why? → Because it ran out of memory…). |
| 5. Prioritize High-Impact Causes | Use voting, impact/likelihood scoring, or AI-assisted risk ranking. |
| 6. Link to Action Plans | Create tasks in OpenDocs from identified root causes. Use AI to draft corrective action plans. |
| 7. Review and Iterate | Revisit the diagram after implementing fixes. Update it with new data or insights. |
🔄 Pro Tip: Combine Fishbone with Mind Maps for idea generation and Timelines for tracking resolution progress.
🚀 Additional Enhancements in OpenDocs
OpenDocs isn’t just about diagrams — it’s a smart knowledge ecosystem.
🔧 AI-Powered Features:
-
Auto-Suggest Causes: AI recommends relevant causes based on the problem statement.
-
Generate Summaries: Instantly create executive summaries of your Fishbone findings.
-
Create Visuals: Use AI to generate illustrative images or stylized versions of your diagram.
-
Organize Spaces: Automatically structure your documentation using AI-driven content grouping.
🔄 Seamless Integration:
-
Embed Fishbone in Markdown pages, technical docs, roadmaps, or post-mortem reports.
-
Link to action items, risk registers, or KPI dashboards.
-
Share entire Spaces via secure links — ideal for audits, stakeholder reviews, or onboarding.
📊 Broader Chart Support (v2026.1+):
-
Mind Maps
-
Fishbone Diagrams
-
Timelines
-
Flowcharts
-
Organizational Charts
-
Gantt Charts
-
SWOT Analysis
-
Kanban Boards
-
Decision Trees
💬 Use these tools together to build a complete problem-solving workflow.
📌 Final Tips & Pro Advice
-
Use Color Coding: Assign colors to different categories (e.g., red for high-risk, yellow for medium).
-
Limit Branches: Keep major categories to 5–7 to avoid clutter.
-
Use AI to Validate: Ask: “Are there any missing root causes in this Fishbone?”
-
Export for Presentations: Export as PNG/SVG and insert into PowerPoint or Confluence.
-
Archive Completed Diagrams: Move finalized Fishbones to a “Historical RCA” folder in your Space.
📣 Get Started Today!
🚀 Elevate your problem-solving with AI-powered, documentation-integrated Fishbone Diagrams.
🔗 Start Now:
-
Visit the OpenDocs Landing Page: https://ai.visual-paradigm.com/tool/opendocs/
-
Explore the Fishbone Template Gallery (available in OpenDocs > Templates)
-
Join the Community Forum for tips and templates
📚 Learn More:
-
Read the official announcement: https://updates.visual-paradigm.com/releases/fishbone-diagram-root-cause-analysis-opendocs/
-
Watch the 5-minute tutorial video (available in OpenDocs > Help Center)
🏁 Conclusion
With Fishbone Diagram support officially launched in OpenDocs on February 2, 2026, root cause analysis is no longer a disconnected activity — it’s now fully integrated into your documentation workflow.
By combining structured brainstorming, collaborative editing, and AI-powered assistance, OpenDocs empowers teams to:
-
Solve problems faster
-
Document insights clearly
-
Take action with confidence
🎯 Stop guessing. Start analyzing. Document everything.
-
AI Fishbone Diagram Generator: This page introduces a purpose-built AI tool that automatically generates Fishbone (Ishikawa) diagrams from simple text descriptions to help identify the root causes of complex problems.
-
AI-Powered Fishbone Diagram Generator – Uncover Root Causes in Seconds: An article exploring how AI-driven automation accelerates the creation of fishbone diagrams, streamlining decision-making and root cause analysis workflows.
-
Create Fishbone Diagrams from Text Using Visual Paradigm Smart Board: This free guide demonstrates how to use the Smart Board feature to transform natural language text input directly into structured cause-and-effect diagrams.
-
Fishbone Analysis: Ishikawa Diagram Concepts and AI-Powered Tools: A detailed case study that explores the fundamental concepts of Ishikawa diagrams and highlights the transformative role of AI-powered tools like Visual Paradigm in modern analysis.
-
Announcement: AI Fishbone Diagram Generator Launch: Official release notes detailing the launch of the platform’s specialized AI generator designed to simplify technical problem-solving through automated modeling.
-
AI Chart Generator | Create Stunning Charts with AI: A resource explaining how the AI Fishbone Diagram Generator sits alongside other automated tools to help users visualize ideas and improve overall workflow efficiency.
-
Unraveling Complex Issues: The Power of Cause and Effect Analysis with Fishbone Diagrams: A comprehensive guide explaining how structured analysis using these diagrams helps solve business and operational problems by organizing AI-driven insights.
-
How to Create a Fishbone Diagram: A Step-by-Step Guide: A tutorial that teaches the core methodology for building these diagrams, which provides the foundation for using the platform’s AI-assisted creation tools.
-
Free Fishbone Diagram Tool – Create Diagrams Instantly: An overview of the web-based, collaborative environment where users can leverage AI capabilities to build professional fishbone diagrams without manual drawing.
-
Visualizing Complex Ideas with AI-Powered Tree Diagrams: This resource explores how generative AI helps teams break down intricate concepts into structured visual representations, including hierarchical formats similar to fishbone structures.
This post is also available in Deutsch, Español, فارسی, Français, English, Bahasa Indonesia, 日本語, Polski, Portuguese, Ру́сский, Việt Nam, 简体中文 and 繁體中文.