


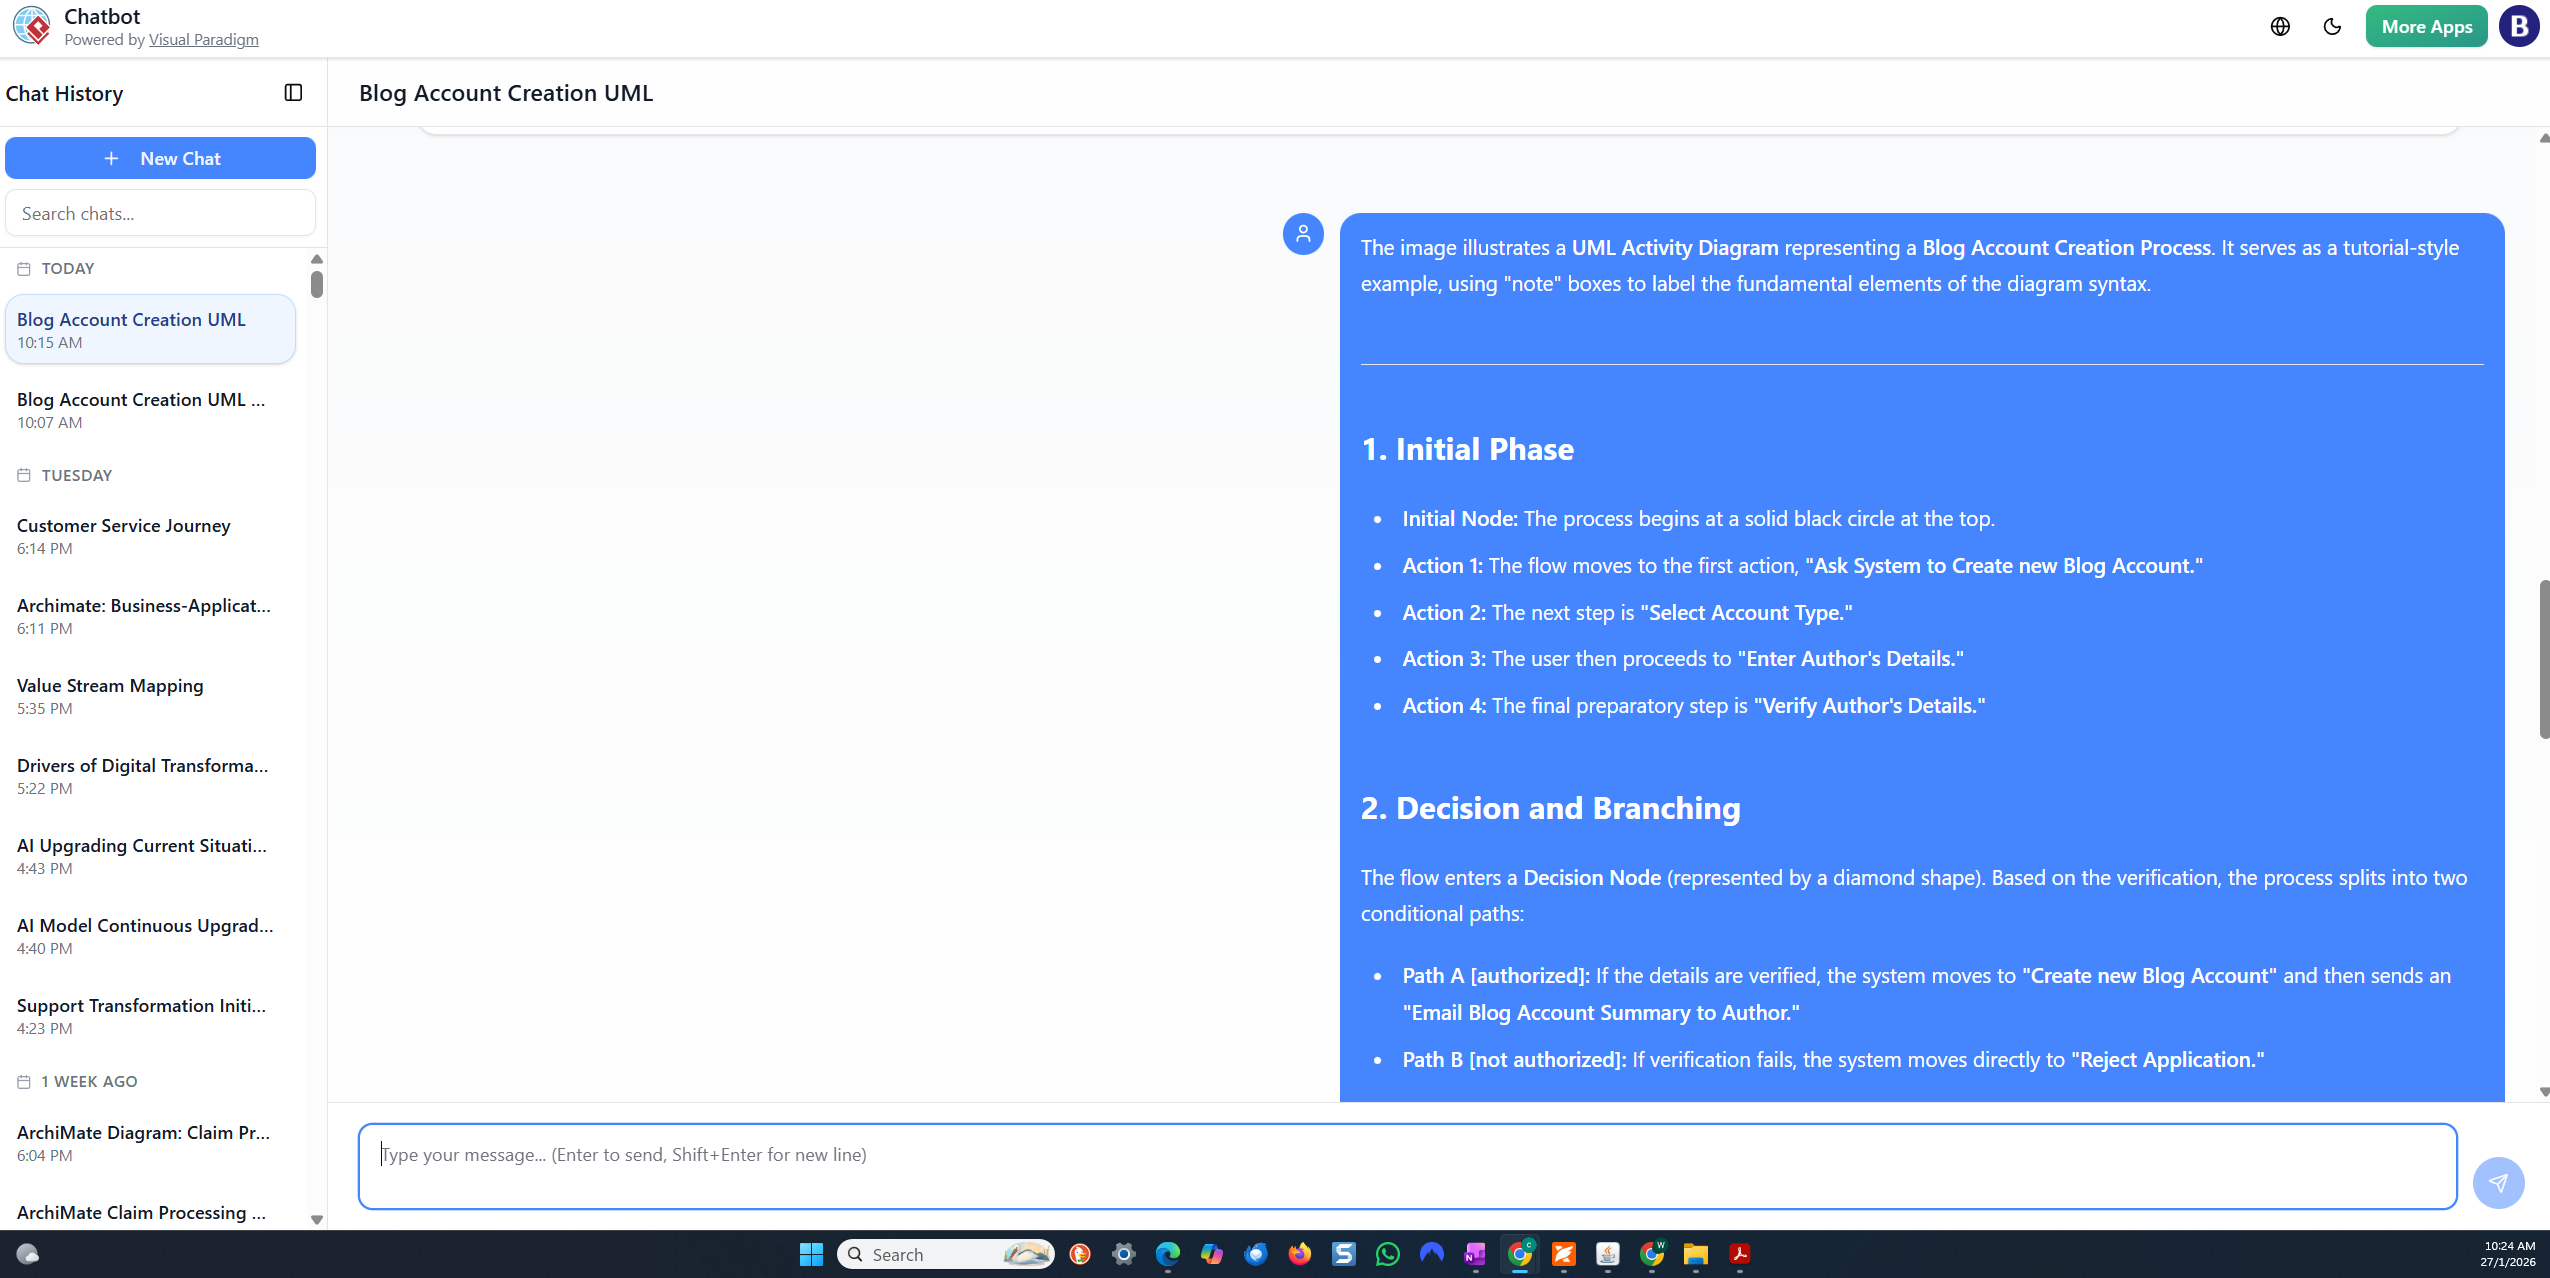
एक UML गतिविधि आरेख निम्नलिखित में से एक व्यवहारात्मक आरेख है एकीकृत मॉडलिंग भाषा (UML). यह एक अनुक्रम (या समानांतर सेट) के क्रियाकलाप के रूप में कार्यप्रवाह, व्यावसायिक प्रक्रियाएँ, उपयोग केस वास्तविकीकरण या एल्गोरिदम तर्क के रूप में एक प्रणाली के गतिशील पहलुओं को दर्शाता है। फ्लोचार्ट्स (जो इसके समान हैं) के विपरीत, गतिविधि आरेख विशेष रूप से UML संदर्भों के लिए डिज़ाइन किए गए हैं, जो वस्तु प्रवाह, समानांतरता (फॉर्क्स/जॉइन्स के माध्यम से), संरचित नियंत्रण (निर्णय/मर्ज), और अन्य UML आरेखों (जैसे उपयोग केस या अनुक्रम आरेख) के साथ एकीकरण का समर्थन करते हैं।
इस अध्ययन में दिए गए उदाहरण — ब्लॉग खाता निर्माण प्रक्रिया — एक वास्तविक, शुरुआती उपयोगकर्ता के लिए उपयुक्त उदाहरण के रूप में उपयोग किया गया है ताकि मुख्य अवधारणाएँ और UML गतिविधि आरेखों के मूल तत्वों को समझाया जा सके।
अध्ययन: ब्लॉग खाता निर्माण प्रक्रिया
परिदृश्य एक ब्लॉगिंग प्लेटफॉर्म नए लेखकों के पंजीकरण की अनुमति देता है। प्रक्रिया में खाता निर्माण के लिए अनुरोध करना, प्रकार चुनना (जैसे मुफ्त या प्रीमियम), व्यक्तिगत विवरण दर्ज करना, उनकी पुष्टि करना, और या तो खाता बनाना (पुष्टि ईमेल भेजने के बाद) या अनुरोध को अस्वीकार करना शामिल है। कार्यप्रवाह हमेशा सफलता या विफलता के बाद समाप्त होता है।
इस प्रक्रिया को एक UML गतिविधि आरेख में मॉडल किया गया है, जो नोटेशन के लगभग सभी मूल तत्वों को संक्षिप्त और वास्तविक तरीके से दर्शाता है।
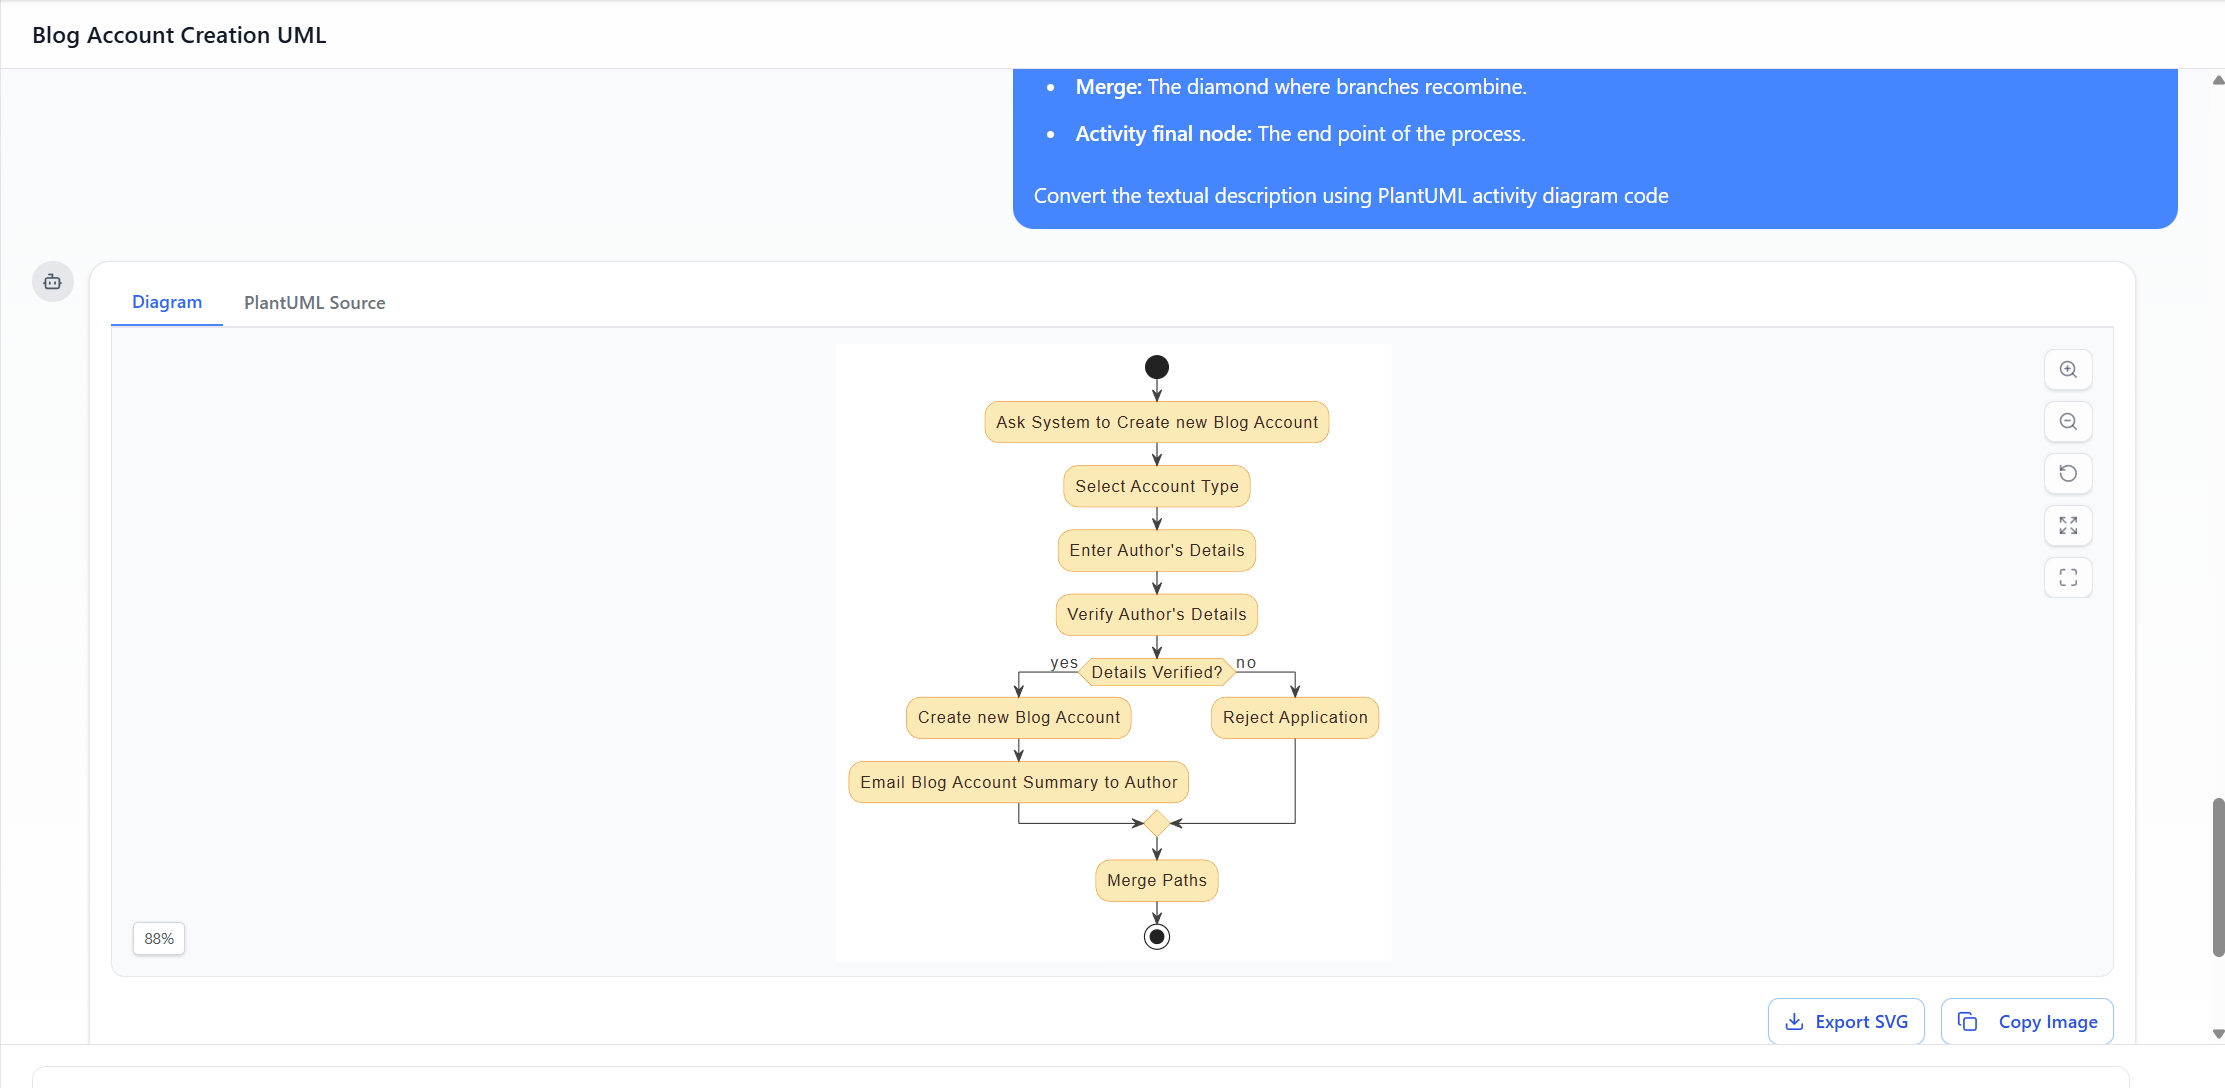
आरेख प्रवाह सारांश (वर्णित आरेख पर आधारित)
- शुरुआत → प्रणाली से नया ब्लॉग खाता बनाने के लिए पूछें
- → खाता प्रकार चुनें
- → लेखक के विवरण दर्ज करें
- → लेखक के विवरण की पुष्टि करें
- → निर्णय: “विवरण पुष्टि किए गए?”
- [हाँ] → नया ब्लॉग खाता बनाएं → लेखक को ब्लॉग खाता सारांश ईमेल करें
- [नहीं] → आवेदन अस्वीकार करें
- दोनों मार्ग → मर्ज
- → समाप्ति
आरेख में व्याख्यात्मक भी शामिल हैनोटसिंटैक्स (प्रारंभिक नोड, एज, एक्शन, निर्णय, मर्ज, एक्टिविटी अंतिम नोड) को लेबल करने वाले तत्व, जो इसे एक उत्कृष्ट ट्यूटोरियल उदाहरण बनाते हैं।
यूएमएल एक्टिविटी आरेख की मुख्य अवधारणाएँ और तत्व (उदाहरण द्वारा चित्रित)
- प्रारंभिक नोड
- प्रतीक: ठोस काला भरा गोला (●)
- उद्देश्य: पूर्ण गतिविधि का एकमात्र प्रारंभिक बिंदु (अधिकांश मामलों में प्रत्येक गतिविधि आरेख के लिए एक ही होता है।)
- उदाहरण में: प्रक्रिया ऊपरी काले गोले पर शुरू होती है। कोई आने वाला किनारा अनुमत नहीं है — यह कार्यप्रवाह के ट्रिगर या उद्घाटन का प्रतिनिधित्व करता है (उदाहरण के लिए, लेखक “साइन अप” पर क्लिक करता है।)
- क्रिया (या क्रिया नोड)
- प्रतीक: गोलाकार आयत (लगभग लंबाकार)
- उद्देश्य: एकल चरण, कार्य, संचालन या गणना का प्रतिनिधित्व करता है जो क्रियान्वित किया जाता है।
- उदाहरण में: लगभग हर चरण एक क्रिया है:
- “सिस्टम से नए ब्लॉग खाता बनाने के लिए कहें”
- “खाता प्रकार चुनें”
- “लेखक के विवरण दर्ज करें”
- “लेखक के विवरण की पुष्टि करें”
- “नया ब्लॉग खाता बनाएं”
- “लेखक को ब्लॉग खाता सारांश ईमेल करें”
- “आवेदन को अस्वीकार करें” ये स्पष्ट रूप से कार्य के परमाणु इकाइयों को दर्शाते हैं।
- नियंत्रण प्रवाह (किनारा)
- प्रतीक: नोड्स को जोड़ने वाली तीर (→)
- उद्देश्य: एक नोड से दूसरे नोड तक अनुक्रमिक या शर्तीय प्रगति को दर्शाता है।
- उदाहरण में: तीर प्रत्येक चरण को क्रम में जोड़ते हैं, मुख्य मार्ग और शाखा मार्ग बनाते हैं।
- निर्णय नोड
- प्रतीक: हीरे के आकार (◇)
- उद्देश्य: एक शाखा बिंदु का प्रतिनिधित्व करता है जहां प्रवाह एक (या अधिक) बाहरी मार्ग का चयन एक शर्त (गार्ड) के आधार पर करता है।
- गार्ड: बाहरी किनारों पर बूलियन व्यंजक (उदाहरण के लिए, [हां], [नहीं], [विवरण सत्यापित?], [अन्य])।
- उदाहरण में: चिह्नित आयत “विवरण सत्यापित?” प्रवाह को विभाजित करता है:
- हां मार्ग → खाता निर्माण
- नहीं मार्ग → अस्वीकृति यह गतिविधि आरेखों में शर्ती तर्क को मॉडल करने का सबसे आम तरीका है।
- मर्ज नोड
- प्रतीक: हीरे के आकार (निर्णय नोड के समान)
- उद्देश्य: दो या अधिक आगमन विकल्पीय प्रवाहों को एकल बाहरी प्रवाह में संयोजित करता है। यह नहीं प्रतीक्षा/समन्वयित नहीं करता — यह आने वाले किसी भी टोकन को तुरंत आगे बढ़ा देता है।
- उदाहरण में: सफलता (ईमेल) और विफलता (अस्वीकृति) मार्गों के बाद दूसरा हीरा। यह प्रवाहों को फिर से संयोजित करता है ताकि प्रक्रिया का एकल तार्किक अंत हो।महत्वपूर्ण अंतर: निर्णय = बाहरी शाखा, मर्ज = आगमन संघनन। वे एक ही प्रतीक साझा करते हैं लेकिन आगमन/बाहरी किनारों की संख्या में भिन्न होते हैं।
- गतिविधि अंतिम नोड
- प्रतीक: बुल्सआई (आंतरिक ठोस वृत्त के साथ वृत्त) या कभी-कभी मोटे किनारे वाला वृत्त
- उद्देश्य: पूरी गतिविधि के समापन को चिह्नित करता है। इस नोड तक पहुंचने से गतिविधि में सभी टोकन/प्रवाह समाप्त हो जाते हैं।
- उदाहरण में: मर्ज के बाद अंतिम बुल्सआई चिह्न। खाता बनाया गया या अस्वीकृत किया गया, प्रक्रिया यहीं समाप्त होती है।
- नोट / टिप्पणी
- प्रतीक: ऊपरी दाहिने कोने में मुड़ा हुआ आयत, बिंदीदार रेखा द्वारा जुड़ा हुआ
- उद्देश्य: स्पष्टीकरण पाठ, परिभाषाएँ या टिप्पणियाँ प्रदान करता है (अनौपचारिक)।
- उदाहरण में: कई नोट तत्वों को चिह्नित करते हैं (उदाहरण के लिए, “प्रारंभिक नोड: शुरुआती बिंदु।”, “निर्णय: तार्किक शाखाओं के स्थान पर ही हीरा।”)। इससे आरेख स्व-दस्तावेजीकृत हो जाता है और UML सिंटैक्स सिखाने के लिए उत्तम होता है।
अतिरिक्त मुख्य अवधारणाएँ (मूल उदाहरण के बाहर)
जबकि ब्लॉग खाता आरेख अनुक्रमिक प्रवाह + सरल शाखाओं पर ध्यान केंद्रित करता है, वास्तविक दुनिया के गतिविधि आरेख अक्सर शामिल करते हैं:
- फॉर्क / जॉइन (समानांतरता के लिए): एक आगमन → बहुत आउटगोइंग (फॉर्क) या बहुत आगमन → एक आउटगोइंग (जॉइन)। यहाँ उपलब्ध नहीं है।
- वस्तु नोड्स / पिन्स (डेटा प्रवाह के लिए): क्रियाओं के बीच पारित वस्तुओं को दिखाने वाले आयत।
- स्विमलेन / विभाजन (ऊर्ध्वाधर/क्षैतिज लेन): प्रत्येक क्रिया किस अभिनेता/प्रणाली/भाग द्वारा की जाती है, यह दिखाने के लिए।
- एक्सपेंशन क्षेत्र: लूप या आवृत्तियों के लिए।
- अंतराल वाले क्षेत्र / त्रुटि संभाल: त्रुटि मार्गों के लिए उन्नत निर्माण।
इस उदाहरण को शिक्षण के लिए उत्तम क्यों माना जाता है
- सरलता — केवल सबसे मौलिक तत्वों का उपयोग करता है (कोई समानांतरता नहीं, कोई वस्तुएँ नहीं, कोई स्विमलेन नहीं)।
- वास्तविकता — एक सामान्य वास्तविक दुनिया के पंजीकरण प्रवाह का प्रतिनिधित्व करता है।
- शैक्षिक टिप्पणियाँ — प्रत्येक मुख्य प्रतीक को स्पष्ट रूप से चिह्नित करता है, जिससे आरेख एक छोटा ट्यूटोरियल बन जाता है।
- नियंत्रण नोड्स को दर्शाता है — निर्णय बनाम मर्ज के बीच स्पष्ट अंतर दिखाता है (एक ही आकृति, अलग अर्थ)।
- पूर्ण जीवनचक्र — प्रारंभिक नोड से शुरू होता है, अंतिम नोड पर समाप्त होता है, दोनों सफलता और असफलता के मार्गों को संभालता है।
ब्लॉग खाता उदाहरण में मुख्य तत्वों की सारांश सारणी
| तत्व | प्रतीक | उदाहरण में उपयोग किया गया? | आरेख में भूमिका |
|---|---|---|---|
| प्रारंभिक नोड | ठोस काला वृत्त | हां | प्रारंभिक ट्रिगर |
| क्रिया | गोलाकार आयत | हां (बहुल) | व्यक्तिगत चरण/कार्य |
| नियंत्रण प्रवाह | तीर | हां | क्रम और शाखाएं |
| निर्णय नोड | हीरा | हां | सत्यापन शाखा ([हां]/[नहीं]) |
| मर्ज नोड | हीरा | हां | सफलता/असफलता के मार्गों को फिर से जोड़ता है |
| गतिविधि अंतिम नोड | बुल्सआई | हां | प्रक्रिया समाप्ति (सफलता या असफलता) |
| नोट | मुड़ा हुआ आयत | हाँ (बहुल) | UML सिंटैक्स की व्याख्या करता है |
यह केस स्टडी ब्लॉग खाता निर्माण एक्टिविटी डायग्राम के उपयोग से स्पष्ट रूप से दर्शाती है कि UML एक्टिविटी डायग्राम आवश्यकताओं (उदाहरण के लिए, उपयोग केस) और कार्यान्वयन के बीच किस तरह ब्रिज बनाते हैं, जो प्रक्रियात्मक तर्क की स्पष्ट, दृश्य विवरण प्रदान करते हैं — यह नोटेशन की मूल शक्ति है सॉफ्टवेयर इंजीनियरिंग, व्यापार प्रक्रिया मॉडलिंग और सिस्टम विश्लेषण में।
चरण-दर-चरण ट्यूटोरियल: विजुअल पैराडाइग्म AI चैटबॉट के साथ UML एक्टिविटी डायग्राम बनाना
यहाँ विजुअल पैराडाइग्म AI चैटबॉट (जिसे एआई-संचालित विजुअल मॉडलिंग चैटबॉट के रूप में भी जाना जाता है) के उपयोग के लिए स्पष्ट, चरण-दर-चरण ट्यूटोरियल है, जो ब्लॉग खाता निर्माण प्रक्रिया जैसे एक पाठ्य विवरण से UML एक्टिविटी डायग्राम बनाने के लिए है। यह 2025–2026 में उपकरण के काम करने के तरीके पर आधारित है, जैसा कि आपके स्क्रीनशॉट में दिखाया गया है (चैट.विजुअल-पैराडाइग्म.com इंटरफेस, प्लांटयूएमएल स्रोत उत्पादन, डायग्राम प्रीव्यू, निर्यात विकल्प और आवर्धित सुधार)।
- AI चैटबॉट तक पहुंचें
- जाएँ https://chat.visual-paradigm.com/ (या समाकलित AI टूलबॉक्स पर https://ai-toolbox.visual-paradigm.com/app/chatbot/ यदि पूर्ण प्लेटफॉर्म का उपयोग कर रहे हैं)।
- विजुअल पैराडाइग्म खाते के साथ साइन इन करें (मुफ्त परीक्षण उपलब्ध है; कुछ विशेषताओं के असीमित उपयोग/निर्यात के लिए सदस्यता आवश्यक है)।
- शुरू करें एक नया चैट (नीले “+ नया चैट” बटन पर क्लिक करें)।
- इसे एक विवरणात्मक शीर्षक दें, उदाहरण के लिए, “ब्लॉग खाता निर्माण UML एक्टिविटी डायग्राम”।
- एक स्पष्ट पाठ्य विवरण प्रदान करें (प्रारंभिक प्रॉम्प्ट)
- नीचे चैट इनपुट बॉक्स में, प्रक्रिया का विस्तृत प्राकृतिक भाषा विवरण टाइप करें।
- उदाहरण प्रॉम्प्ट (कॉपी-पेस्ट करें या अपने पिछले विवरण से अनुकूलित करें):
पाठ
ब्लॉग खाता निर्माण प्रक्रिया के लिए UML एक्टिविटी डायग्राम बनाएं। प्रारंभिक नोड से शुरू करें। फिर: सिस्टम से नया ब्लॉग खाता बनाने के लिए कहें → खाता प्रकार चुनें → लेखक के विवरण दर्ज करें → लेखक के विवरण की पुष्टि करें। फिर एक निर्णय नोड: “विवरण पुष्टि किए गए?” के साथ हाँ/नहीं शाखाएं। यदि हाँ: नया ब्लॉग खाता बनाएं → लेखक को ब्लॉग खाता सारांश ईमेल करें। यदि नहीं: आवेदन अस्वीकार करें। दोनों मार्ग एक मर्ज नोड पर मिलते हैं, फिर एक्टिविटी फाइनल नोड पर समाप्त होते हैं। UML तत्वों जैसे प्रारंभिक नोड, क्रिया, निर्णय, मर्ज और अंतिम नोड की व्याख्या करने वाले नोट अनोटेशन शामिल करें। - एंटर/भेज दबाएं। AI इसे प्रसंस्कृत करता है (प्रगति बार दिखाई दे सकता है, उदाहरण के लिए, 80–90%)।
- उत्पन्न डायग्राम की समीक्षा करें
- चैटबॉट तुरंत डायग्राम को दृश्य रूप में प्रदर्शित करता है (प्लांटयूएमएल के पीछे काम करते हुए)।
- टैब दिखाई देते हैं: डायग्राम (दृश्य पूर्वावलोकन) और प्लांटयूएमएल स्रोत (संपादित करने योग्य कोड)।
- सही होने की जांच करें: क्रियाएं गोलाकार आयत के रूप में, निर्णय/मर्ज के लिए हीरे के आकार, प्रवाह के लिए तीर, गार्ड्स जैसे [हाँ]/[नहीं], शुरुआत (काला वृत्त), अंत (बुल्सआई)।
- चर्चा के माध्यम से आवर्धन और सुधार करें
- यदि कुछ गायब/गलत है, तो उसी चैट में प्रतिक्रिया दें:
- “उपयोगकर्ता और प्रणाली के लिए स्विमलेन जोड़ें।”
- “मर्ज नोड के लेबल को ‘मार्ग मर्ज’ में बदलें।”
- “‘विवरण सत्यापित हुआ?’ लेबल वाले निर्णय हीरे को अधिक प्रमुख बनाएं।”
- “रंग जोड़ें: क्रियाकलाप के लिए नीला, सफलता के मार्ग के लिए हरा।”
- “स्पष्टीकरण वाले नोट शामिल करें: प्रारंभिक नोड, किनारा, क्रियाकलाप, निर्णय, मर्ज, गतिविधि अंतिम नोड।”
- AI आरेख और PlantUML कोड को वास्तविक समय में अद्यतन करता है (अंतर देखने के लिए “पिछले के साथ तुलना” का उपयोग करें)।
- संतुष्ट होने तक जारी रखें।
- यदि कुछ गायब/गलत है, तो उसी चैट में प्रतिक्रिया दें:
- शैली को कस्टमाइज़ करें (वैकल्पिक)
- चैट में अनुरोध करें:
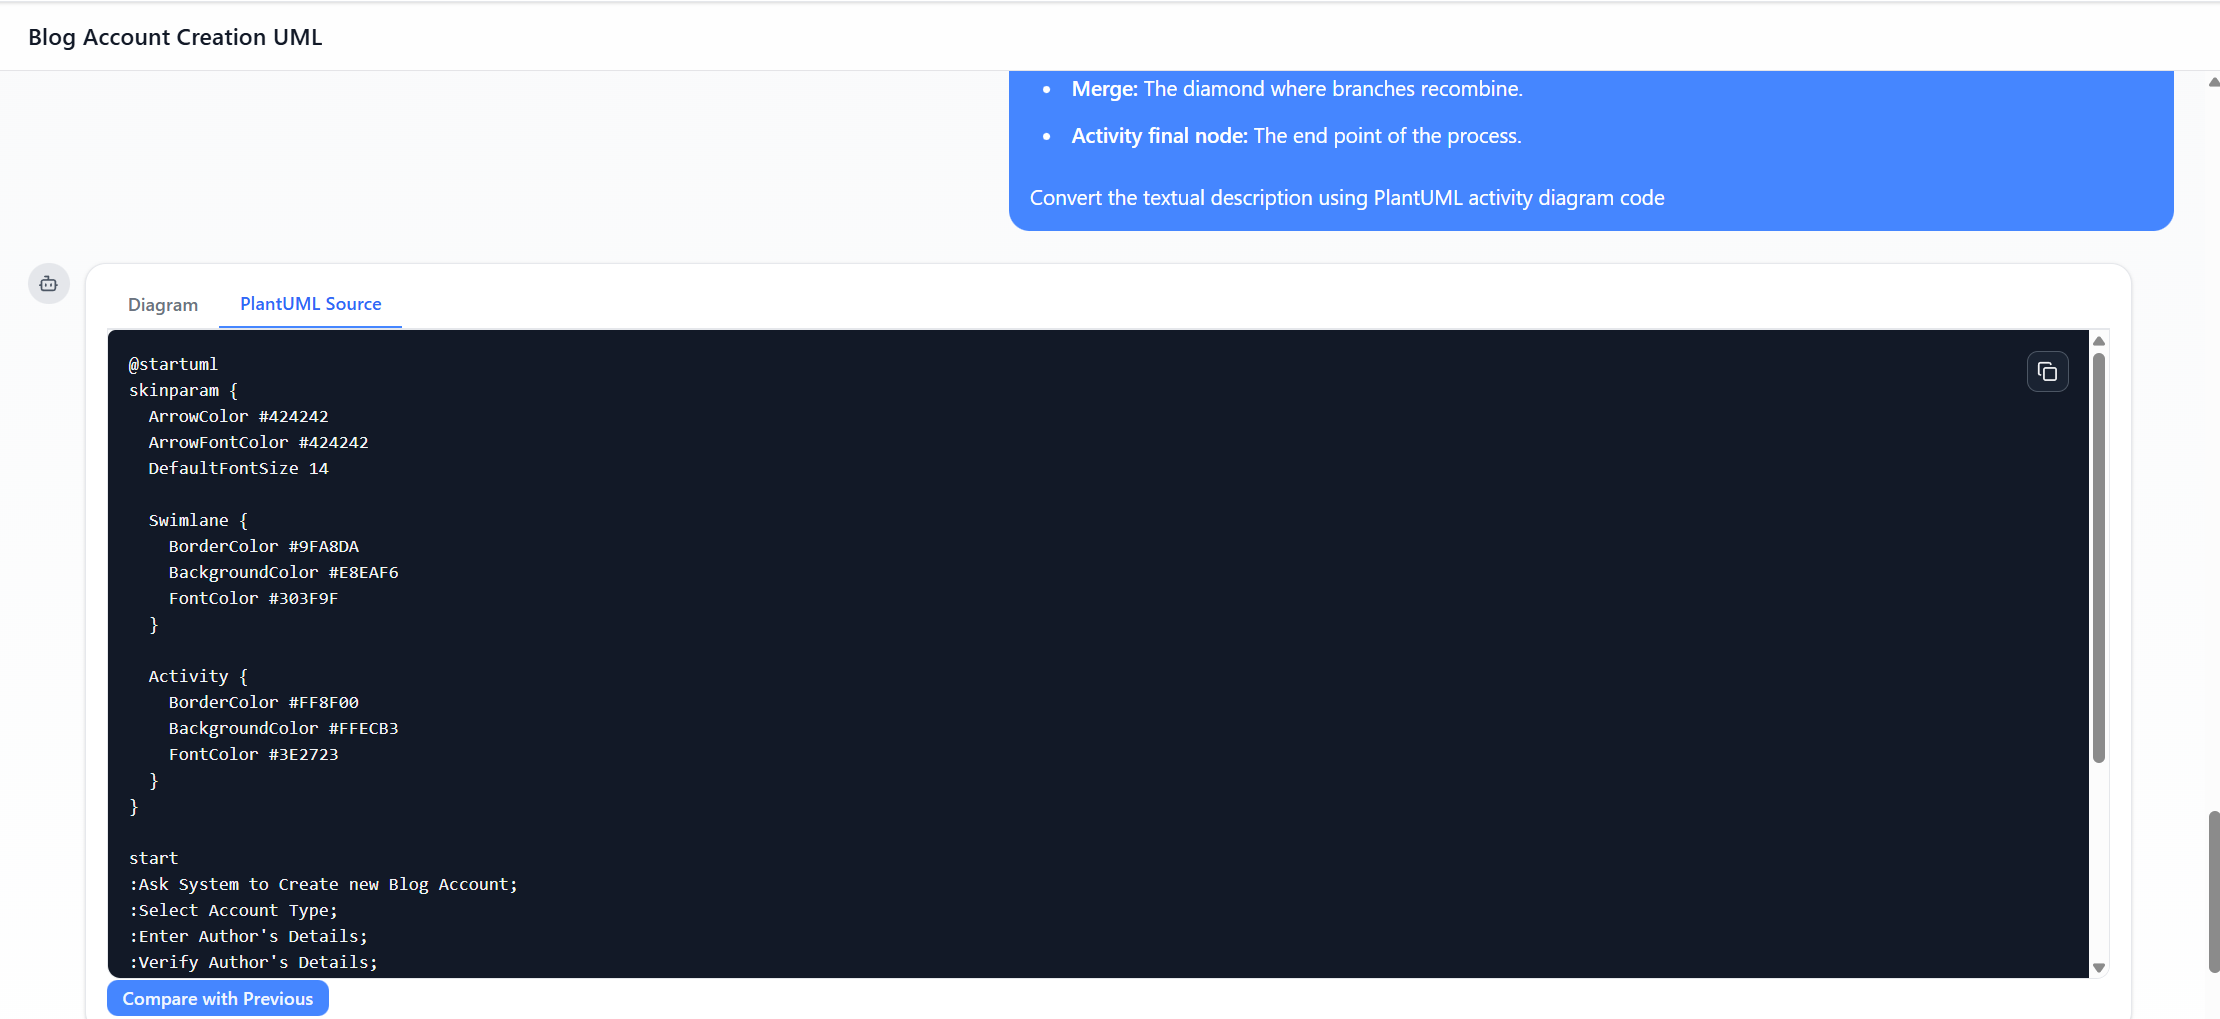
- “बेहतर रंगों के लिए skinparam लागू करें: तीर रंग #424242, पृष्ठभूमि रंग #E8EAF6।”
- या “PlantUML स्रोत” टैब में सीधे PlantUML स्रोत संपादित करें (उदाहरण के लिए, @startuml … @enduml ब्लॉक, skinparam सेटिंग्स जोड़ें)।
- चैट में अनुरोध करें:
- आरेख को निर्यात करें और उपयोग करें
- क्लिक करें SVG निर्यात करें (या PNG/JPG) छवियों के लिए।
- छवि कॉपी करें त्वरित पेस्ट के लिए।
- उन्नत संपादन/सहयोग के लिए: Visual Paradigm डेस्कटॉप में निर्यात करें (लाइसेंस/सदस्यता की आवश्यकता है) या चैट लिंक साझा करें।
- बाद में उपयोग के लिए सत्र को सहेजें (चैट इतिहास बना रहता है)।
सर्वोत्तम परिणाम के लिए टिप्स
- प्रॉम्प्ट में स्पष्ट हों (चरणों को क्रमानुसार सूचीबद्ध करें, शाखाओं/गार्ड्स का स्पष्ट उल्लेख करें)।
- UML सीखने के लिए अनुसरण प्रश्नों का उपयोग करें, जैसे “यहाँ मर्ज नोड का उपयोग करने का कारण बताएं।”
- परीक्षण मोड में सीमाएँ हैं (उदाहरण के लिए, उपयोग प्रतिशत दिखाया जाता है); पूर्ण निर्यात/असीमित चैट के लिए सदस्यता लें।
तुलना: AI चैटबॉट दृष्टिकोण बनाम पारंपरिक आरेख निर्माण प्रक्रिया
| पहलू | पारंपरिक हस्तचालित निर्माण (उदाहरण के लिए, Visual Paradigm डेस्कटॉप, Lucidchart, Draw.io, Visio में) | AI चैटबॉट दृष्टिकोण (Visual Paradigm AI) |
|---|---|---|
| प्रारंभिक बिंदु | खाली आरेख खोलें → हाथ से आकृतियों को खींचें/छोड़ें (प्रारंभिक नोड, क्रियाएँ, हीरे के आकार, तीर) | प्राकृतिक भाषा वर्णन टाइप करें → AI सेकंडों में पूरा आरेख उत्पन्न करता है |
| पहला ड्राफ्ट बनाने में समय | 10–45 मिनट (जटिलता और उपयोगकर्ता कौशल के आधार पर) | 10–60 सेकंड |
| UML/व्याकरण ज्ञान आवश्यक | उच्च — सटीक प्रतीकों का ज्ञान आवश्यक है (उदाहरण के लिए, क्रिया के लिए गोल किनारे वाला आयत, निर्णय/मर्ज के लिए हीरा, किनारों पर गार्ड) | कम — सरल अंग्रेजी में वर्णन करें; AI सही नोटेशन का ध्यान रखता है |
| त्रुटि का जोखिम | उच्च — गलत तीर, गलत आकृतियाँ, गायब मर्ज, असंगत शैली | कम — AI UML मानकों को लागू करता है (लेकिन अभी भी आउटपुट की समीक्षा करनी चाहिए) |
| पुनरावृत्ति/परिवर्तन | आइटम को हाथ से खींचें, आकार बदलें, फिर से जोड़ें; बड़े परिवर्तनों के लिए थकाऊ | संवादात्मक: बस “स्विमलेन जोड़ें” या “लेबल बदलें” टाइप करें → तुरंत अपडेट |
| सीखना/अन्वेषण | धीमा — UML सीखते समय प्रयोग और त्रुटि | तेज — उत्पन्न करें → पूछें “मर्ज नोड की व्याख्या करें” या “फॉर्क/जॉइन के साथ विकल्प दिखाएं” |
| स्थिरता और मानक | उपयोगकर्ता के विशेषज्ञता पर निर्भर करता है | उच्च — UML विनिर्देशों पर प्रशिक्षित; स्थिर आउटपुट |
| सहयोग | फ़ाइल साझा करें; कुछ उपकरणों में ही रियल-टाइम | चैट URL साझा करें; अन्य इतिहास और आरेख देख सकते हैं; प्रॉम्प्ट के माध्यम से चरणबद्ध सह-संपादन |
| सबसे अच्छा उपयोग | सटीक पिक्सेल-परफेक्ट नियंत्रण, जटिल कस्टम लेआउट, बड़े पैमाने के प्रोजेक्ट | त्वरित प्रोटोटाइपिंग, UML सीखना, त्वरित पुनरावृत्ति, अनुभवहीन उपयोगकर्ता, विचार बाजार |
| सीमाएँ | समय लेने वाला सेटअप; शुरुआती उपयोगकर्ताओं के लिए तीखा वक्र | यदि प्रॉम्प्ट अस्पष्ट है तो सुधार की आवश्यकता हो सकती है; प्रयोग सीमाएँ; हाथ से खींचने की तुलना में कम विस्तृत नियंत्रण |
अंतिम निष्कर्ष द AI चैटबॉट बहुत तेजी से शुरुआती चरणों को तेज करता है — विचारों को लगभग तुरंत दृश्य UML एक्टिविटी डायग्राम में बदल देता है — जिससे यह ट्यूटोरियल, त्वरित प्रूफ-ऑफ-कॉन्सेप्ट, शिक्षा, या जब आपके पास समय कम हो, के लिए उपयुक्त बन जाता है। पारंपरिक हाथ से बनाना अंतिम रूप देने, बहुत विशिष्ट/जटिल डायग्राम, या जब पूरी ग्राफिकल नियंत्रण आवश्यक हो, के लिए बेहतर रहता है। कई उपयोगकर्ता दोनों का संयोजन करते हैं: AI के साथ तेजी से उत्पन्न करें → विजुअल पैराडाइग्म डेस्कटॉप में हाथ से आयात/संशोधित करें।
इस दृष्टिकोण (आपके स्क्रीनशॉट में देखे गए के रूप में) मॉडलिंग को अधिक उपलब्ध और कार्यक्षम बनाता है जबकि UML विश्वसनीयता को बनाए रखता है।
यह पोस्ट Deutsch, English, Español, فارسی, Français, Bahasa Indonesia, 日本語, Polski, Portuguese, Ру́сский, Việt Nam, 简体中文 और 繁體中文 में भी उपलब्ध है।