


Fault Tree Analysis was introduced in 1962 by Bell Laboratories and is one of the most widely used to solve a wide variety of problems ranging from safety to management issues.
Fault tree analysis (FTA) is a top-down deductive fault analysis in which Boolean logic is used in conjunction with a series of low-level events to analyze the unexpected states of the system. This analysis method is primarily used in safety engineering and reliability engineering to understand how systems fail, determine the best way to reduce risk, and determine (or feel) the event rate of safety incidents or specific system-level (functional) failures.
Purpose of Fault Tree Analysis?
The main purpose of fault tree analysis is to help identify the potential causes of system faults before faults occur. You can also use analytical or statistical methods to evaluate the probability of top events. These calculations include quantitative reliability and maintainability information of the system, such as failure probability, failure rate and repair rate. After completing FTA, you can focus on improving the security and reliability of the system.
Typical fault tree analysis starts with a potential fault, and then works backwards through a visual representation called fault tree diagram to determine the possible influencing factors. The fault tree adopts a top-down approach, starts with the result (a potential fault condition), and then evaluates the factors that may lead to the fault.
Who fault tree analysis
FTA is applied to aerospace, nuclear power, chemical, pharmaceutical, petrochemical and other high-risk industries; It is also used for debugging purposes in software engineering, which is closely related to the cause elimination technology used to detect bugs.
FTA Notation
A Fault Tree Analysis uses a few basic symbols to outline various points, causes, and effects in a process. There are many symbols, but here are some of the basics to help you get started designing a fault tree diagram.
Symbols are used to represent various events and describe relationships:
Gate Symbols

And gate — represents a condition in which all the events shown below the gate (input gate) must be present for the event shown above the gate (output event) to occur. This means the output event will occur only if all of the input events exist simultaneously.
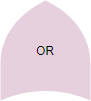
Or gate — represents a situation in which any of the events shown below the gate (input gate) will lead to the event shown above the gate (output event). The event will occur if only one or any combination of the input events exists.
Event symbols
There are five types of event symbols:
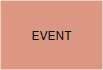
Rectangle — The rectangle is the main building block for the analytical tree. It represents the negative event and is located at the top of the tree and can be located throughout the tree to indicate other events capable of being broken down further. This is the only symbol that will have a logic gate and input events below it.

Circle — A circle represents a base event in the tree. These are found on the bottom tiers of the tree and require no further development or breakdown. There are no gates or events below the base event.
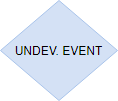
Diamond — The diamond identifies an undeveloped terminal event. Such an event is not fully developed because of a lack of information or significance. A fault tree branch can end with a diamond. For example, most projects require personnel, procedures, and hardware. The tree developer may decide to concentrate on the personnel aspect of the procedure and not the hardware or procedural aspects. In this case, the developer would use diamonds to show “procedures” and “hardware” as undeveloped terminal events.

Oval — An oval symbol represents a special situation that can only happen if certain circumstances occur. This is spelled out in the oval symbol. An example of this might be if switches must be thrown in a specific sequence before an action takes place.

Triangle — The triangle signifies a transfer of a fault tree branch to another location within the tree. Where a triangle connects to the tree with an arrow, everything shown below the connection point transfers to another area of the tree. This area is identified by a corresponding triangle that is connected to the tree with a vertical line. Letters, numbers or figures identify one set of transfer symbols from another. To maintain the simplicity of the analytical tree, the transfer symbol should be used sparingly.
Generic Fault Tree Diagram Illustration

Fault tree development steps
To do a comprehensive FTA, follow these steps:
- Define the system. This includes the scope of the analysis including defining what is considered a failure. This becomes important when a system may have an element fail or a single function fails and the remainder of the system still operates.
- Define top-level faults. Define the fault condition, and write down the top-level failure.
- Identify causes for top-level fault. Using technical information and professional judgments, determine the possible reasons for the failure to occur. Remember, these are level two elements because they fall just below the top-level failure in the tree.
- Identify the next level of events. Continue to break down each element with additional gates to lower levels. Consider the relationships between the elements to help you decide whether to use an “and” or an “or” logic gate.
- Add probabilities to events. If possible, evaluate the probability of occurrence for each of the lowest level elements and calculate the statistical probabilities from the bottom up.
- Finalize and review the complete diagram. The chain can only be terminated in a basic fault: human, hardware or software.
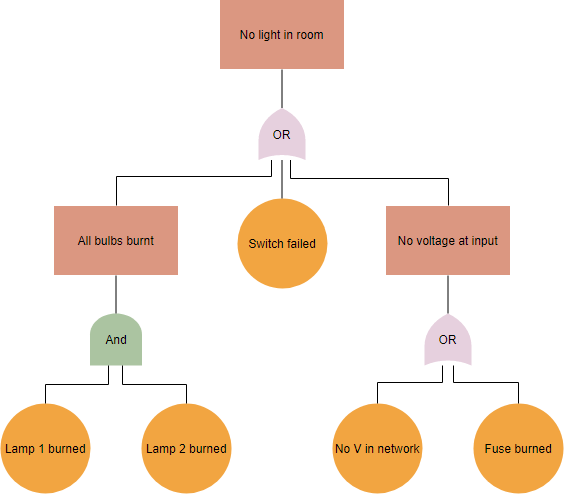
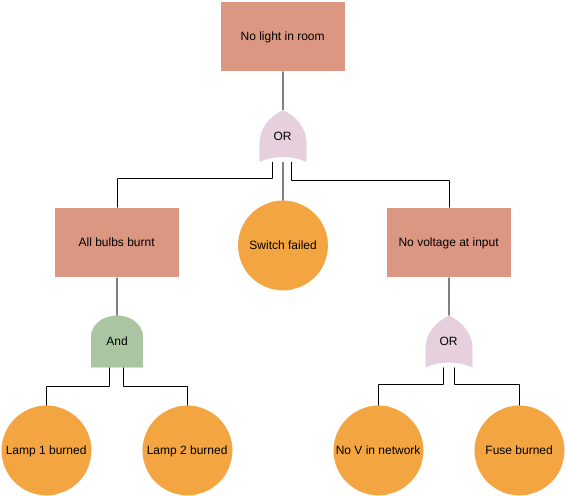
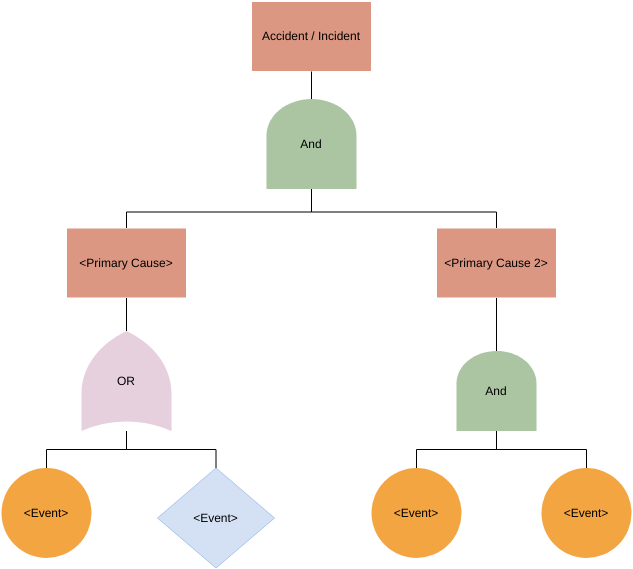
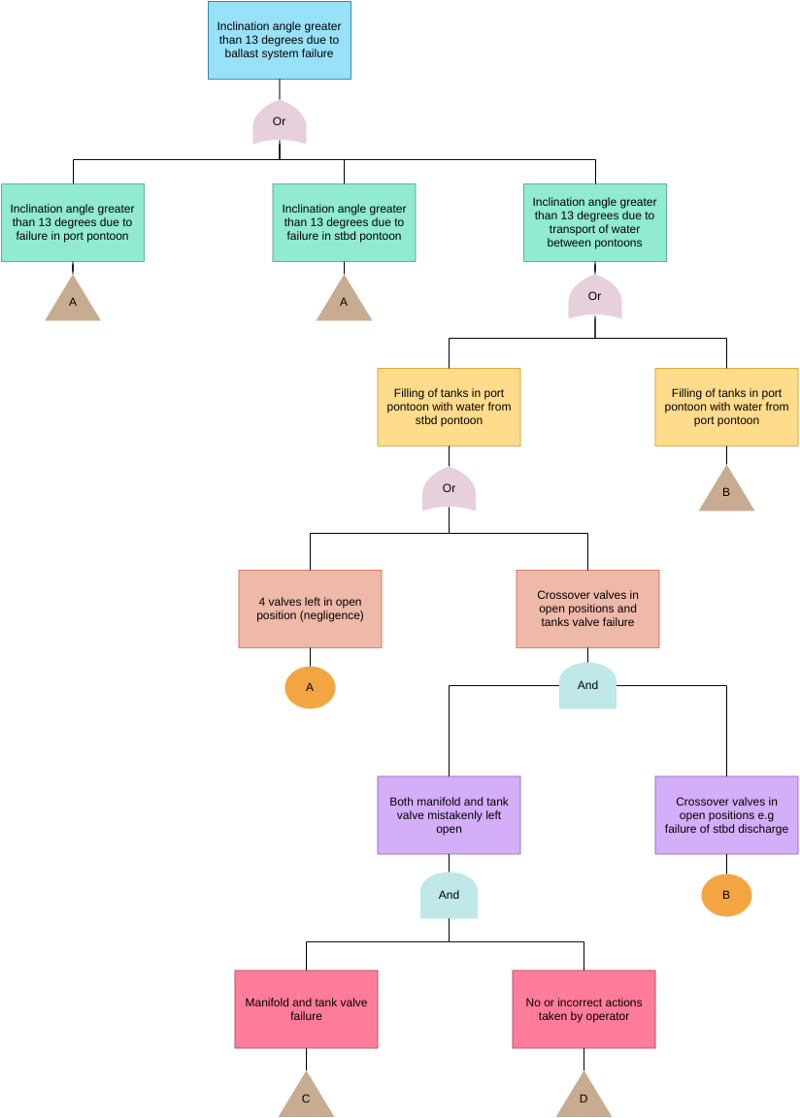
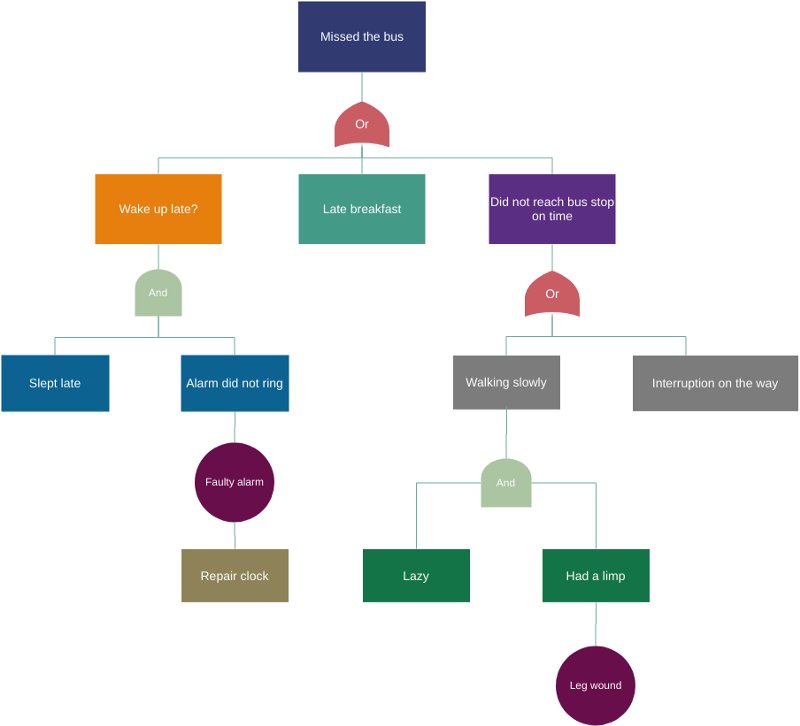
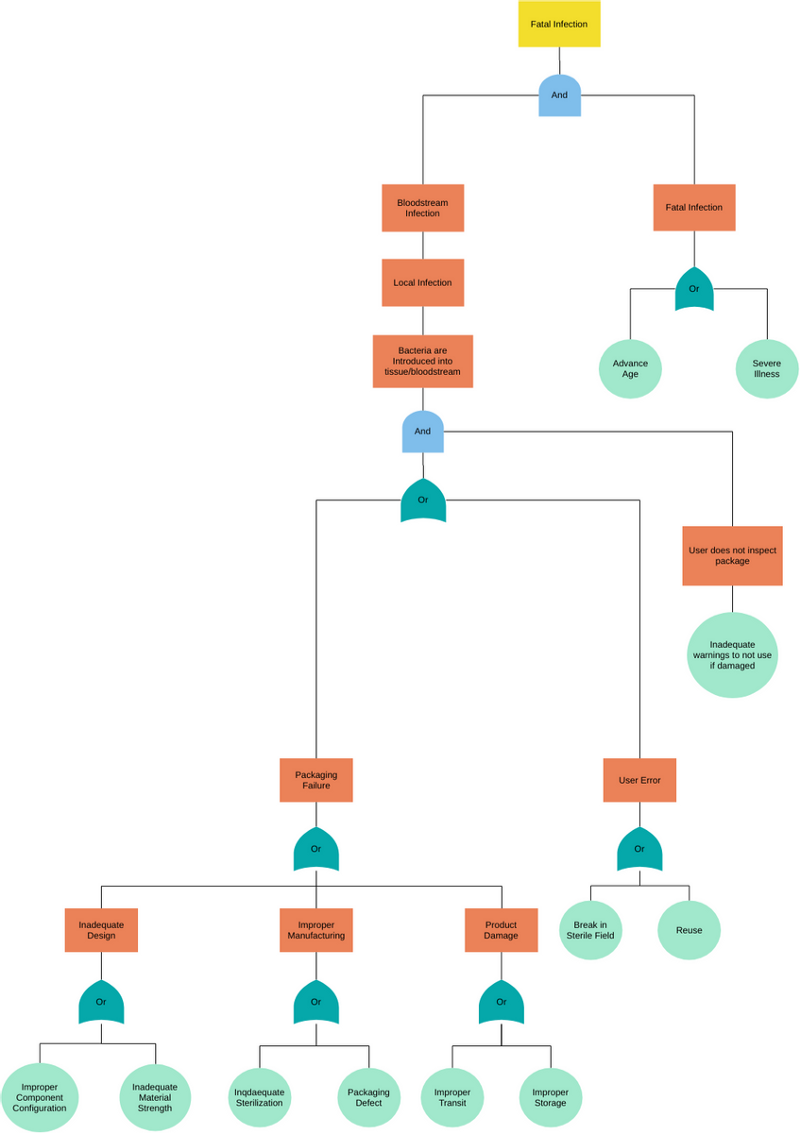
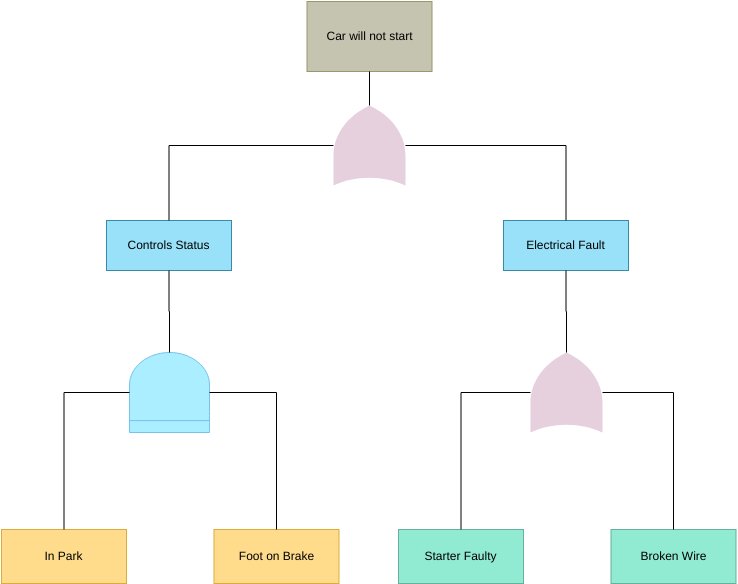
Fault Tree Diagram Example — Light cannot turn on
Let’s look at an example of a basic fault tree analysis: You flip a switch to turn on a light, but the light does not turn on. The fault condition is “No light in the room,” so that’s the beginning of the diagram
Next, what are the potential reasons the light didn’t turn on?
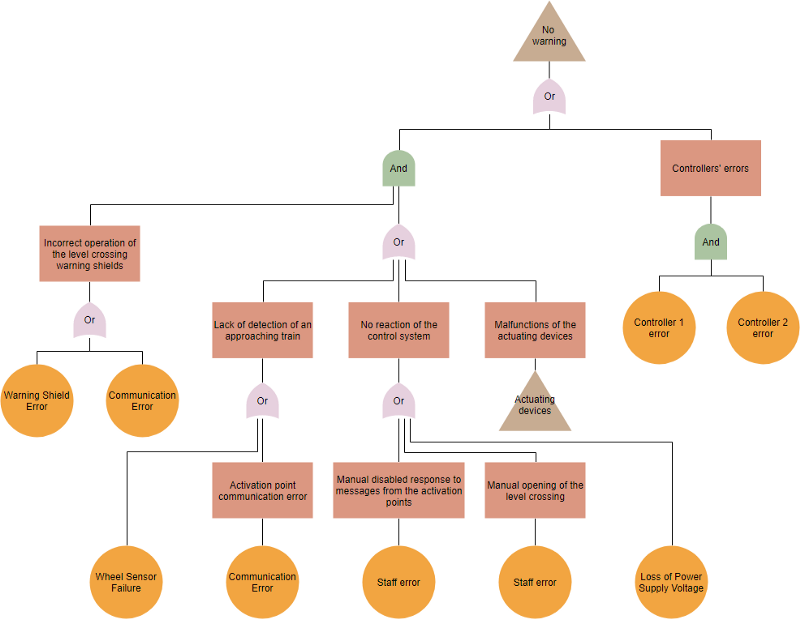
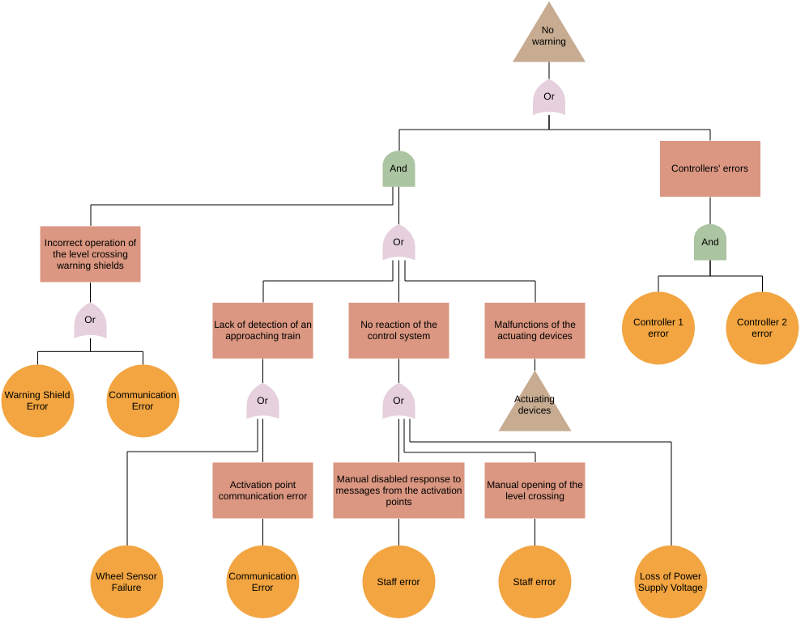
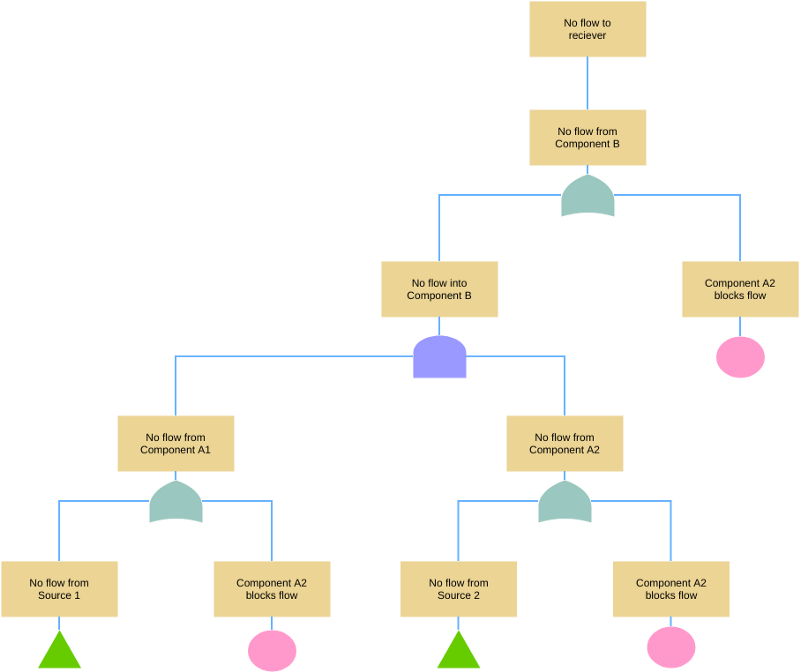
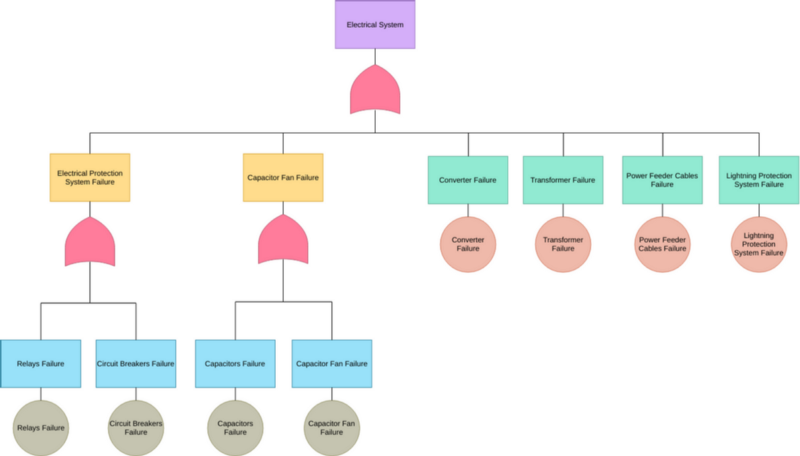
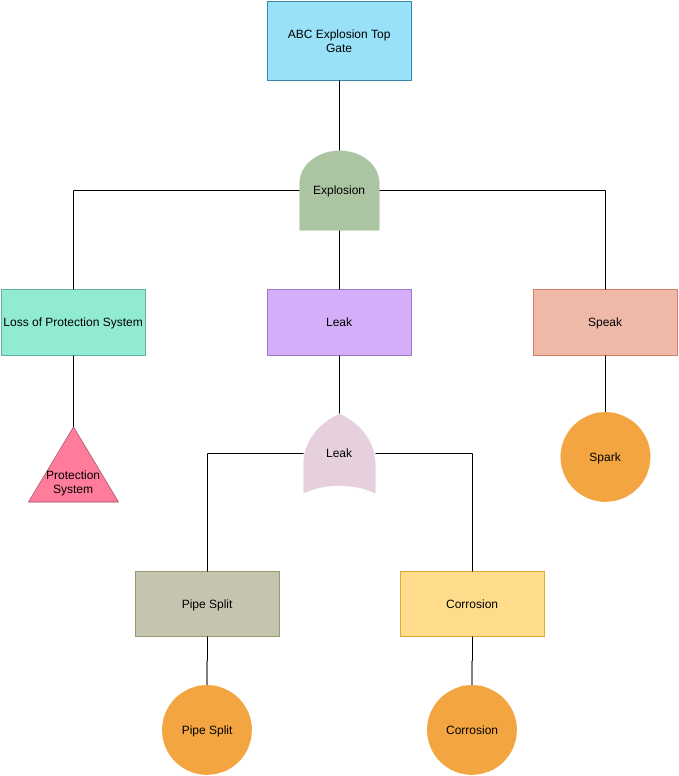
Fault Tree Example — System no Warning Template
Online Fault Tree Maker
Visual Paradigm Online is one of the few software on the market today that supports fault tree analysis software. Whether you are a beginner or a professional, drawing fault tree analysis is simple and intuitive using VP Online’s rich set of fault tree analysis symbols and templates. VP Online is an Online charting software that runs on any device, in any browser.
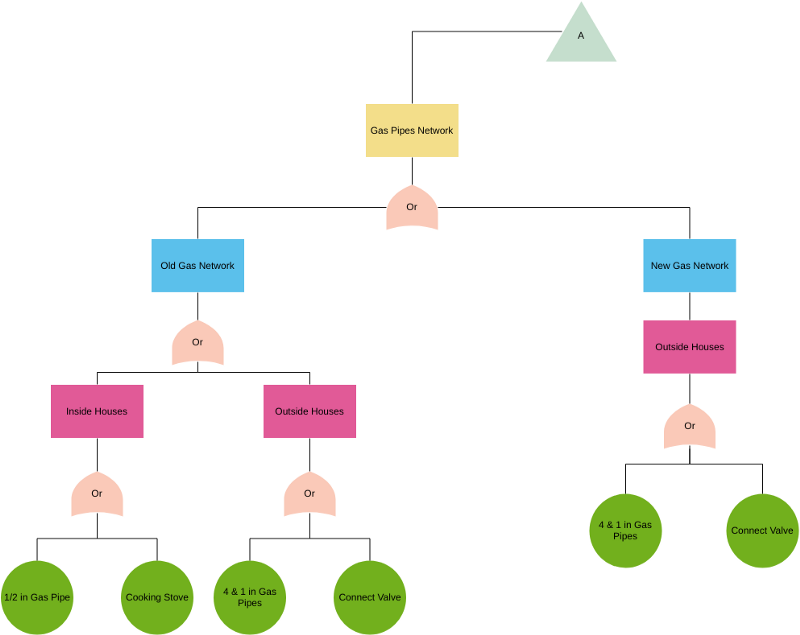
Learn by Example: Fault tree Template
A set of fault tree analysis templates is available. Whether you need to develop a fault tree analysis, or just to get some ideas and modify the template to suit your needs.
This post is also available in Deutsch, Español, فارسی, Français, English, Bahasa Indonesia, 日本語, Polski, Portuguese, Ру́сский, Việt Nam, 简体中文 and 繁體中文.