


T chart and Y-Chart
Both T-charts and Y-charts help to graphically organize and record ideas, feelings and information, while identifying and focusing on what teachers / students already know, understand, value and can do. It enables students / teachers / teachers to compare and contrast ideas, feelings and information in various context.
What is a Y-Chart
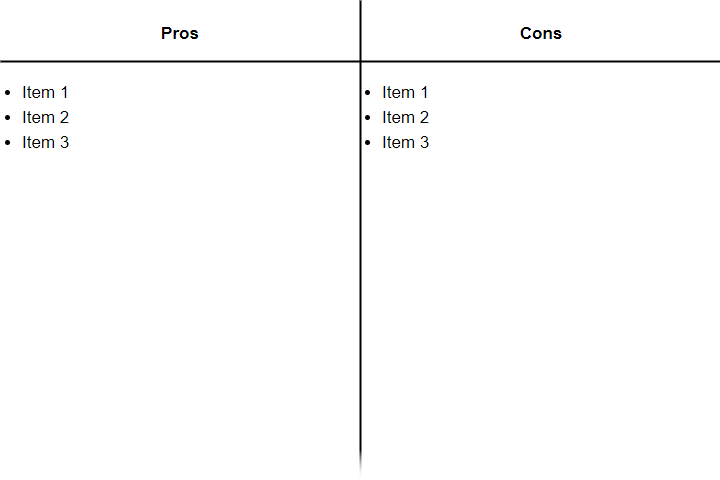
T-Chart is a graphic organizer that examines two facets of a topic, like the pros and cons associated with it, its advantages and disadvantages, facts vs. opinions, etc. By listing the topics as headings for the 2 columns, and writing down several facets that are valid for both options, it’s easy to make a comparison. In one form, it can be a list of positive and negative attributes surrounding a particular choice that ensures that both the positive and negative aspects of each direction or decision will be taken into account. Once you complete the overview, you will see you can come up with a solution to your problem. And this is important to make the final decision.
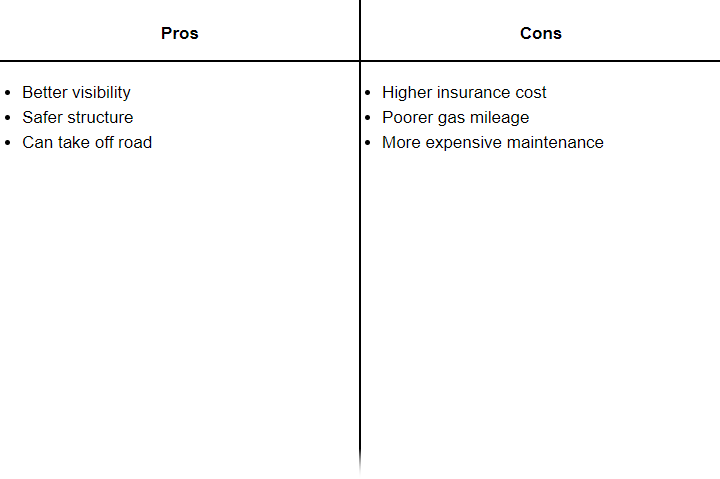
Example: what are the pros and cons of deciding to buy a sport utility vehicle?
When to Use a T-Chart?
For example, a student can use a T-chart to help graphically organize thoughts about:
- Record Information About Any Two Characteristics Of A Topic
- Evaluating The Pros And Cons Of A Topic
- Making A Decision By Comparing The Resulting Advantages And Disadvantages
- Listing Facts Vs. Opinions Of A Theme
- Enumerating The Problems And Solutions Associated With An Action
- Explaining The Strengths And Weaknesses Of A Topic
What is a Y Chart?
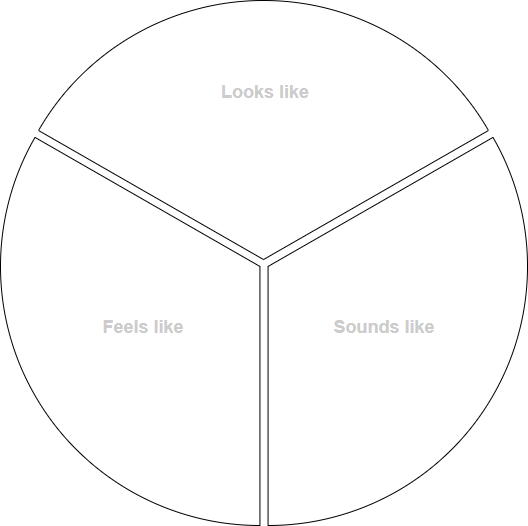
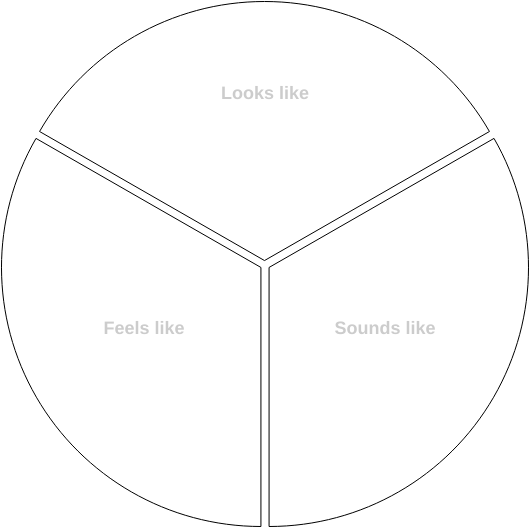
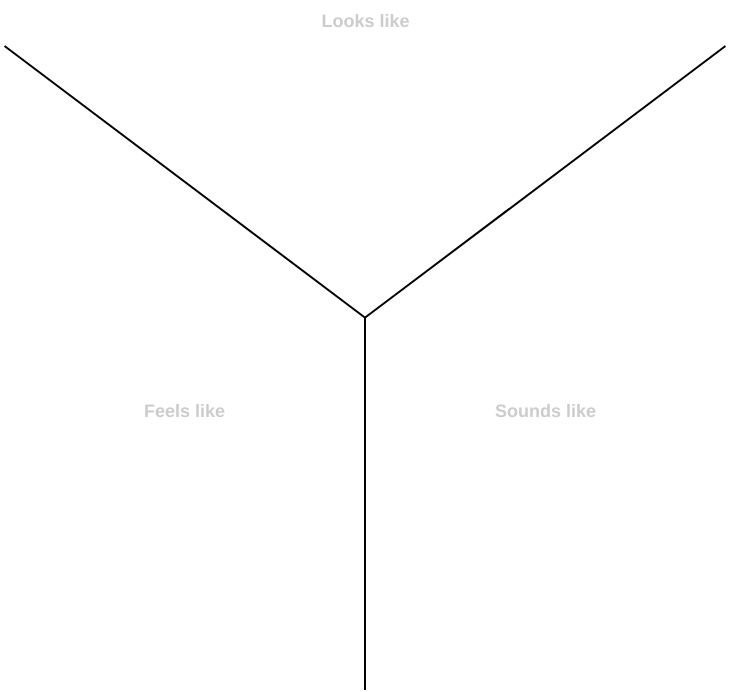
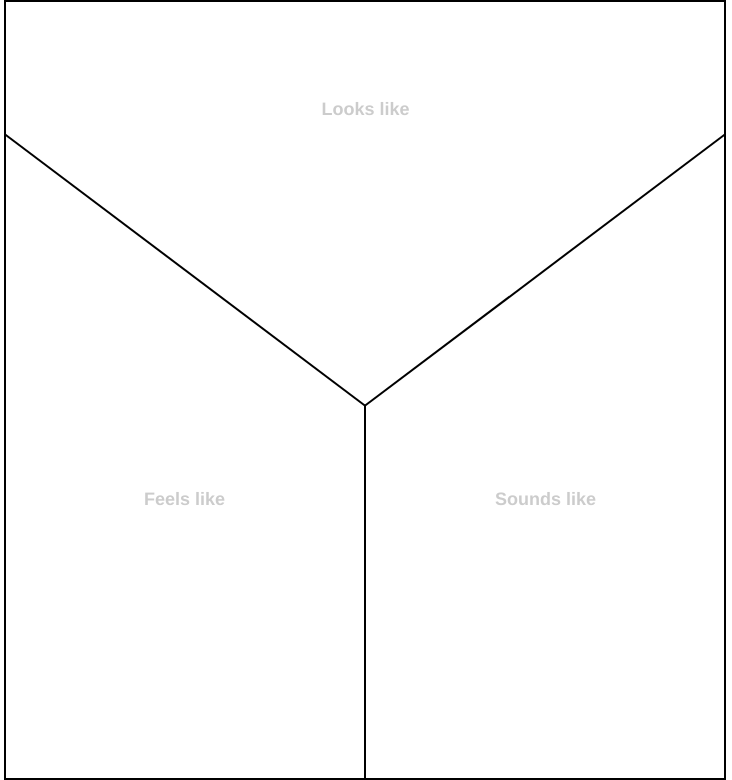
The Y Chart is a three-part graphic organizer that organizes the brainstorming of a topic around three dimensions:
- What Does It Look Like?
- What Does It Feel Like?
- What Does It Sound Like?
Traditionally, teachers have been using the Y Chart as an effective tool in the classroom for many years. It serves as an analytical tool since students and teachers strive to discover more and more about a topic using the sensate approach of what does this topic Look, Sound and Feel like.
T-Chart is usually completed as a pre-product stage or a brainstorming exercise from which one can start creating a product such as a written report, bubble maps, Powerpoints, and interviews. This process encourages participants to be critical thinkers and identify appropriate behaviors for achieving this.
Steps for Creating a Y-Chart?
- Decide on the topic/social skill you wish to explore with your students
- Organize students into small groups, allocating tasks to each group member such as recorder, reporter, time-keeper, organizer
- Team members create a Y Chart with the heading Looks like, sounds like and feels like in each third of the chart
- Have the team brainstorm as many possibilities as they can within a specific time limit
- Each group reports back
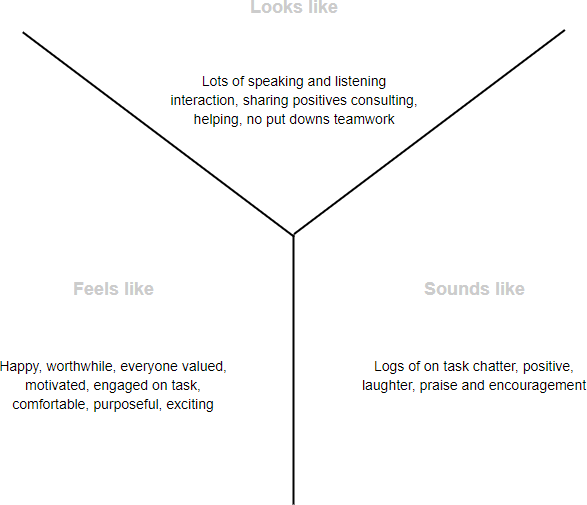
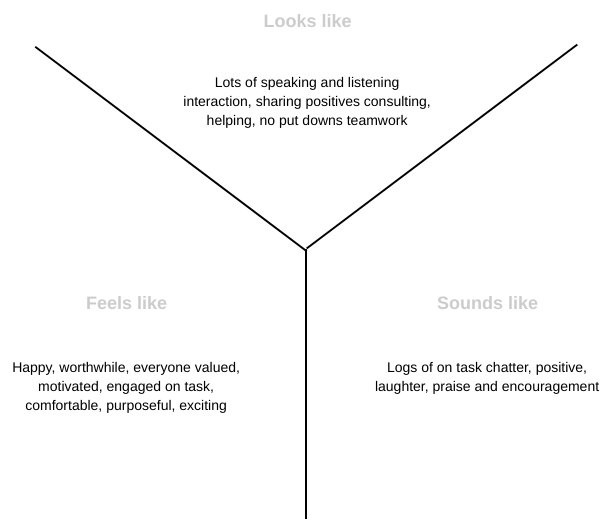
Example — what does a team forming meeting look like, feel like, and sound like.
T-Chart Templates
This post is also available in Deutsch, Español, فارسی, Français, English, Bahasa Indonesia, 日本語, Polski, Portuguese, Ру́сский, Việt Nam, 简体中文 and 繁體中文.