Introduction
Swimlane activity diagrams are a type of UML (Unified Modeling Language) diagram used to model the workflow of a system, highlighting the responsibilities of different participants or components. These diagrams are particularly useful for visualizing complex processes and understanding how different parts of a system interact.

Key Concepts
- Partition:
- Definition: A partition represents a participant or a component in the system.
- Purpose: It helps in organizing the activities and showing who is responsible for what.
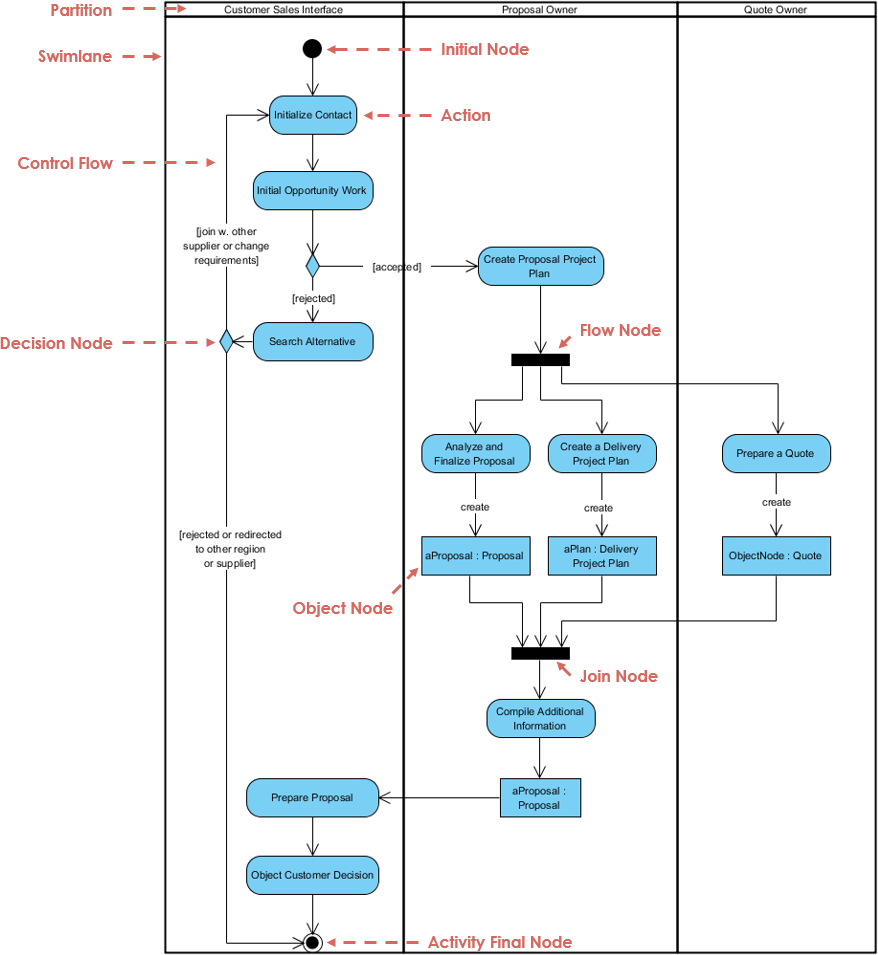
- Example: In the diagram, partitions are labeled as “Customer Sales Interface,” “Proposal Owner,” and “Quote Owner.”
- Swimlane:
- Definition: A swimlane is a visual representation of a partition, often depicted as a vertical or horizontal lane.
- Purpose: It separates the activities of different participants, making the diagram easier to read.
- Example: The diagram has three swimlanes, each corresponding to a different role in the sales process.
- Control Flow:
- Definition: Control flow represents the sequence of activities.
- Purpose: It shows the order in which activities are performed.
- Example: The arrows connecting the activities indicate the control flow.
- Action:
- Definition: An action is a fundamental unit of activity.
- Purpose: It represents a single step in the process.
- Example: “Initialize Contact,” “Initial Opportunity Work,” and “Create Proposal Project Plan” are actions.
- Decision Node:
- Definition: A decision node represents a point where the control flow branches based on a condition.
- Purpose: It shows alternative paths in the process.
- Example: The decision node after “Initial Opportunity Work” determines whether to join with another supplier or change requirements.
- Object Node:
- Definition: An object node represents an object involved in the process.
- Purpose: It shows the data or objects that are created, used, or modified.
- Example: “aProposal : Proposal” and “aPlan : Delivery Project Plan” are object nodes.
- Flow Node:
- Definition: A flow node represents a point in the process where the control flow can merge or split.
- Purpose: It helps in managing the flow of activities.
- Example: The flow node after “Create Proposal Project Plan” splits the process into three parallel activities.
- Join Node:
- Definition: A join node represents a point where multiple control flows merge.
- Purpose: It synchronizes the process by waiting for all incoming flows to complete.
- Example: The join node before “Compile Additional Information” merges the flows from “Analyze and Finalize Proposal,” “Create a Delivery Project Plan,” and “Prepare a Quote.”
- Activity Final Node:
- Definition: An activity final node represents the end of the process.
- Purpose: It indicates the completion of the workflow.
- Example: The activity final node at the bottom of the diagram signifies the end of the sales process.
Learning by Example
Let’s break down the following swimlane activity diagram step by step:

- Initialize Contact:
- Partition: Customer Sales Interface
- Description: The process starts with initializing contact with the customer.
- Initial Opportunity Work:
- Partition: Customer Sales Interface
- Description: Initial work is done to identify the opportunity.
- Decision Node:
- Partition: Customer Sales Interface
- Description: A decision is made whether to join with another supplier or change requirements.
- Outcome: If accepted, the process moves to “Create Proposal Project Plan.” If rejected, it goes to “Search Alternative.”
- Create Proposal Project Plan:
- Partition: Proposal Owner
- Description: A proposal project plan is created.
- Flow Node:
- Partition: Proposal Owner
- Description: The process splits into three parallel activities: “Analyze and Finalize Proposal,” “Create a Delivery Project Plan,” and “Prepare a Quote.”
- Analyze and Finalize Proposal:
- Partition: Proposal Owner
- Description: The proposal is analyzed and finalized.
- Object Node: “aProposal : Proposal”
- Create a Delivery Project Plan:
- Partition: Proposal Owner
- Description: A delivery project plan is created.
- Object Node: “aPlan : Delivery Project Plan”
- Prepare a Quote:
- Partition: Quote Owner
- Description: A quote is prepared.
- Object Node: “ObjectNode : Quote”
- Join Node:
- Partition: Proposal Owner
- Description: The process waits for all three parallel activities to complete before moving to “Compile Additional Information.”
- Compile Additional Information:
- Partition: Proposal Owner
- Description: Additional information is compiled.
- Object Node: “aProposal : Proposal”
- Prepare Proposal:
- Partition: Customer Sales Interface
- Description: The proposal is prepared.
- Object Customer Decision:
- Partition: Customer Sales Interface
- Description: The customer makes a decision.
- Activity Final Node:
- Partition: Customer Sales Interface
- Description: The process ends.
Recommendation: Visual Paradigm for UML
Visual Paradigm is a powerful UML modeling tool that supports swimlane activity diagrams. It offers a user-friendly interface and a wide range of features to help you create and manage your diagrams efficiently. Some of its key features include:
- Drag-and-Drop Interface: Easily create and modify diagrams with a simple drag-and-drop interface.
- Collaboration Tools: Work with your team in real-time, sharing and collaborating on diagrams.
- Integration: Integrate with other tools and platforms for seamless workflow management.
- Templates and Examples: Access a library of templates and examples to get started quickly.
By using Visual Paradigm, you can effectively model and visualize complex processes, making it easier to understand and communicate your system’s workflow.
Conclusion
Swimlane activity diagrams are essential for modeling and understanding the workflow of a system, especially when multiple participants are involved. By using tools like Visual Paradigm, you can create detailed and accurate diagrams that help in analyzing and improving your processes.

