Introduction
In today’s fast-paced business environment, complexity is the enemy of execution. Whether you’re designing a new software feature, optimizing a supply chain, or simply planning your weekly routine, unclear processes lead to miscommunication, errors, and wasted time. The human brain processes visual information 60,000 times faster than text, making visual diagrams an indispensable tool for turning abstract workflows into concrete, actionable plans.
While traditional flowcharts have long been the go-to solution for simple process mapping, modern product development and systems engineering demand more robust notation. This is where UML (Unified Modeling Language) Activity Diagrams come in—offering the simplicity of basic flowcharts while providing advanced capabilities for modeling parallel processes, decision logic, and complex system interactions.
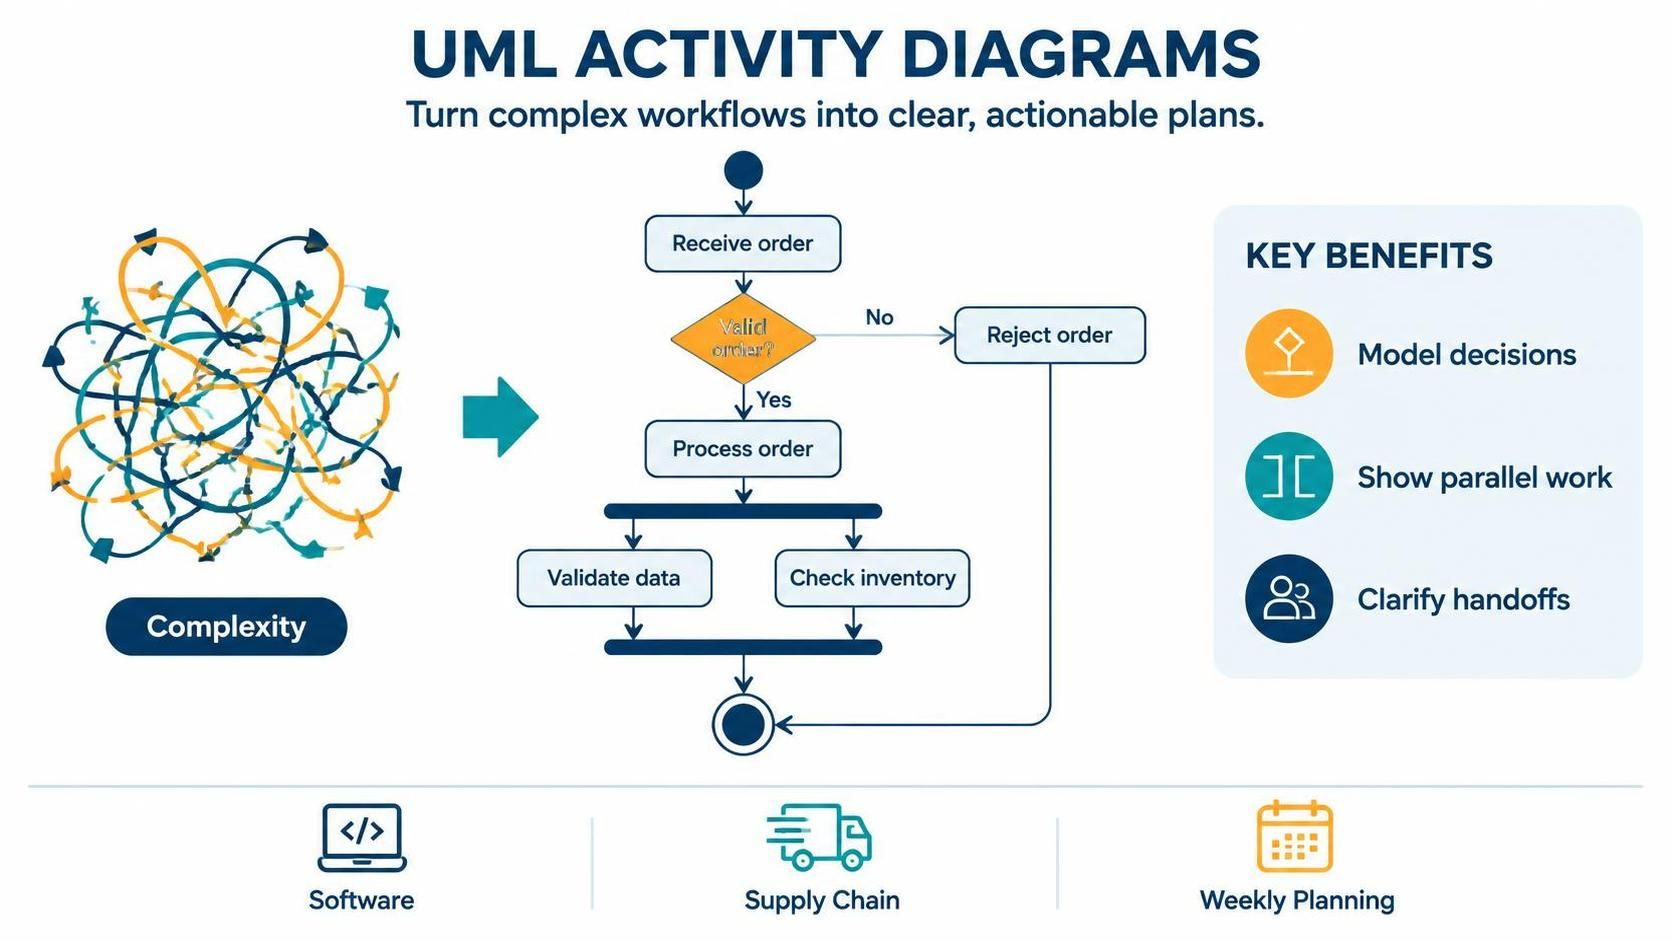
This guide will walk you through the fundamentals of process visualization, demonstrate how to evolve from simple flowcharts to sophisticated UML Activity Diagrams, and show you how to leverage modern tools like Visual Paradigm and PlantUML to create “diagrams as code” that are both maintainable and collaborative.
What Is a Flowchart?
A flowchart is a diagrammatic representation of a process, showing the steps as boxes of various kinds, and their order by connecting them with arrows. It provides a visual snapshot of how a process flows from start to finish, making it easier to understand, analyze, and improve.
Key Concepts
-
Sequential Logic: Shows the order of operations
-
Decision Points: Highlights where choices branch the process
-
Start/End States: Clearly defines boundaries of the process
Example: Simple Login Process
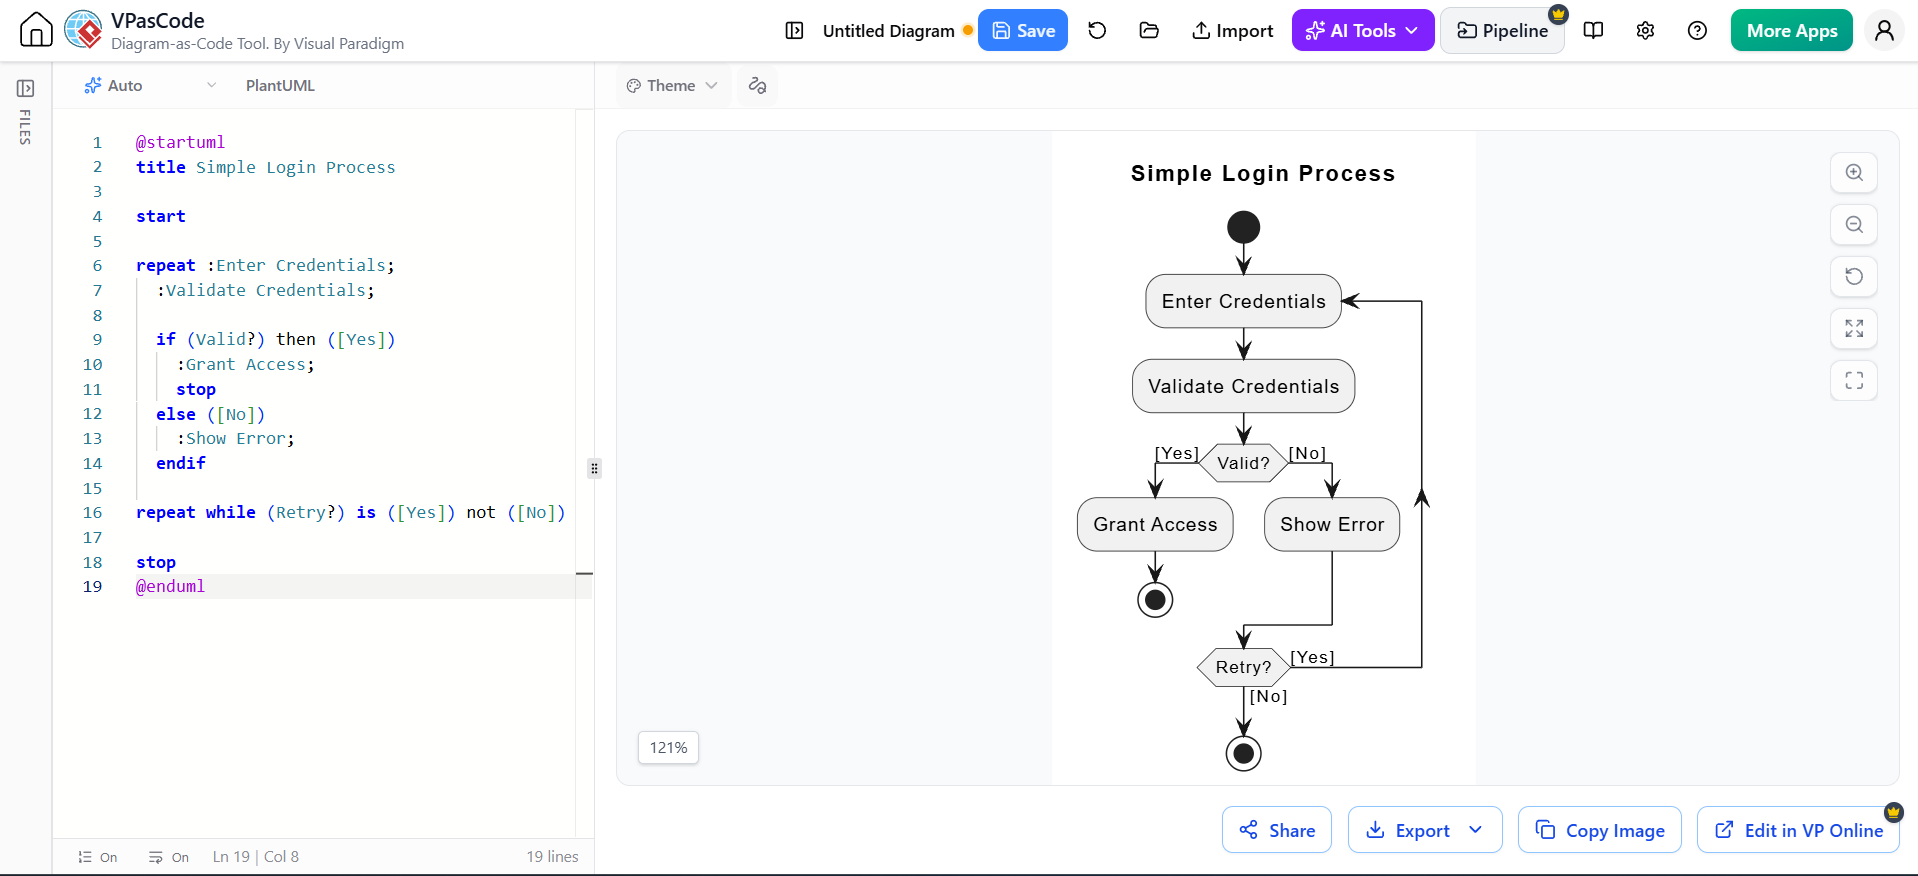
@startuml
title Simple Login Process

start

repeat :Enter Credentials;
  :Validate Credentials;

  if (Valid?) then ([Yes])
    :Grant Access;
    stop
  else ([No])
    :Show Error;
  endif

repeat while (Retry?) is ([Yes]) not ([No])

stop
@endumlWhy Visualizing a Process Helps
1. Identifies Bottlenecks
Visual maps make it obvious where delays occur. For instance, if five approval steps cluster in one section, you’ve found a potential bottleneck.
2. Improves Communication
A shared visual reference eliminates ambiguity. Stakeholders from different backgrounds can align on the same understanding without lengthy explanations.
3. Facilitates Optimization
Once mapped, you can ask: “Can we remove this step?” “Can these two steps happen in parallel?” Visual clarity enables critical thinking.
4. Documents Knowledge
Processes documented visually survive employee turnover. New team members can onboard faster by studying existing diagrams.
The Building Blocks: Symbols and Arrows
Basic Flowchart Symbols
| Symbol | Name | Purpose |
|---|---|---|
| ○ | Terminator | Start or end of process |
| ▭ | Process | Action or operation |
| ◇ | Decision | Yes/No or True/False branch |
| ▱ | Input/Output | Data entering or leaving system |
| → | Arrow | Direction of flow |
UML Activity Diagram Extensions
UML Activity Diagrams extend basic flowchart notation with additional symbols for advanced modeling:
| Symbol | Name | Purpose |
|---|---|---|
| ● | Initial Node | Starting point |
| ⬤ | Final Node | End point |
| ─●─ | Fork/Join | Parallel processing split/merge |
| ◆ | Decision/Merge | Branching and converging paths |
| ⏳ | Activity | Action or task |
| 📦 | Object Node | Data or artifact passing between activities |
How to Turn a Messy Process into a Clear Diagram
Step 1: Define the Scope
What’s the starting point? What’s the desired outcome? Draw clear boundaries.
Step 2: List All Steps
Brainstorm every action, decision, and participant involved. Don’t worry about order yet.
Step 3: Identify Relationships
Which steps depend on others? Where do decisions branch? Map dependencies.
Step 4: Choose Your Notation
-
Simple linear process? Use basic flowchart symbols.
-
Parallel tasks, complex decisions, or system interactions? Use UML Activity Diagrams.
Step 5: Draft and Iterate
Start rough, then refine. Remove redundancies, clarify ambiguous steps, and validate with stakeholders.
A Worked Example: Planning a Weekend Trip
Let’s transform a chaotic weekend trip planning process into a clear UML Activity Diagram.
The Messy Reality
-
Check weather
-
Book hotel if needed
-
Invite friends
-
Decide on activities based on who’s coming
-
Pack bags
-
Drive to destination
-
Handle cancellations
The Clean UML Activity Diagram (PlantUML Code)
Render the Flowchart with VPasCode Tool using PlantUML Code
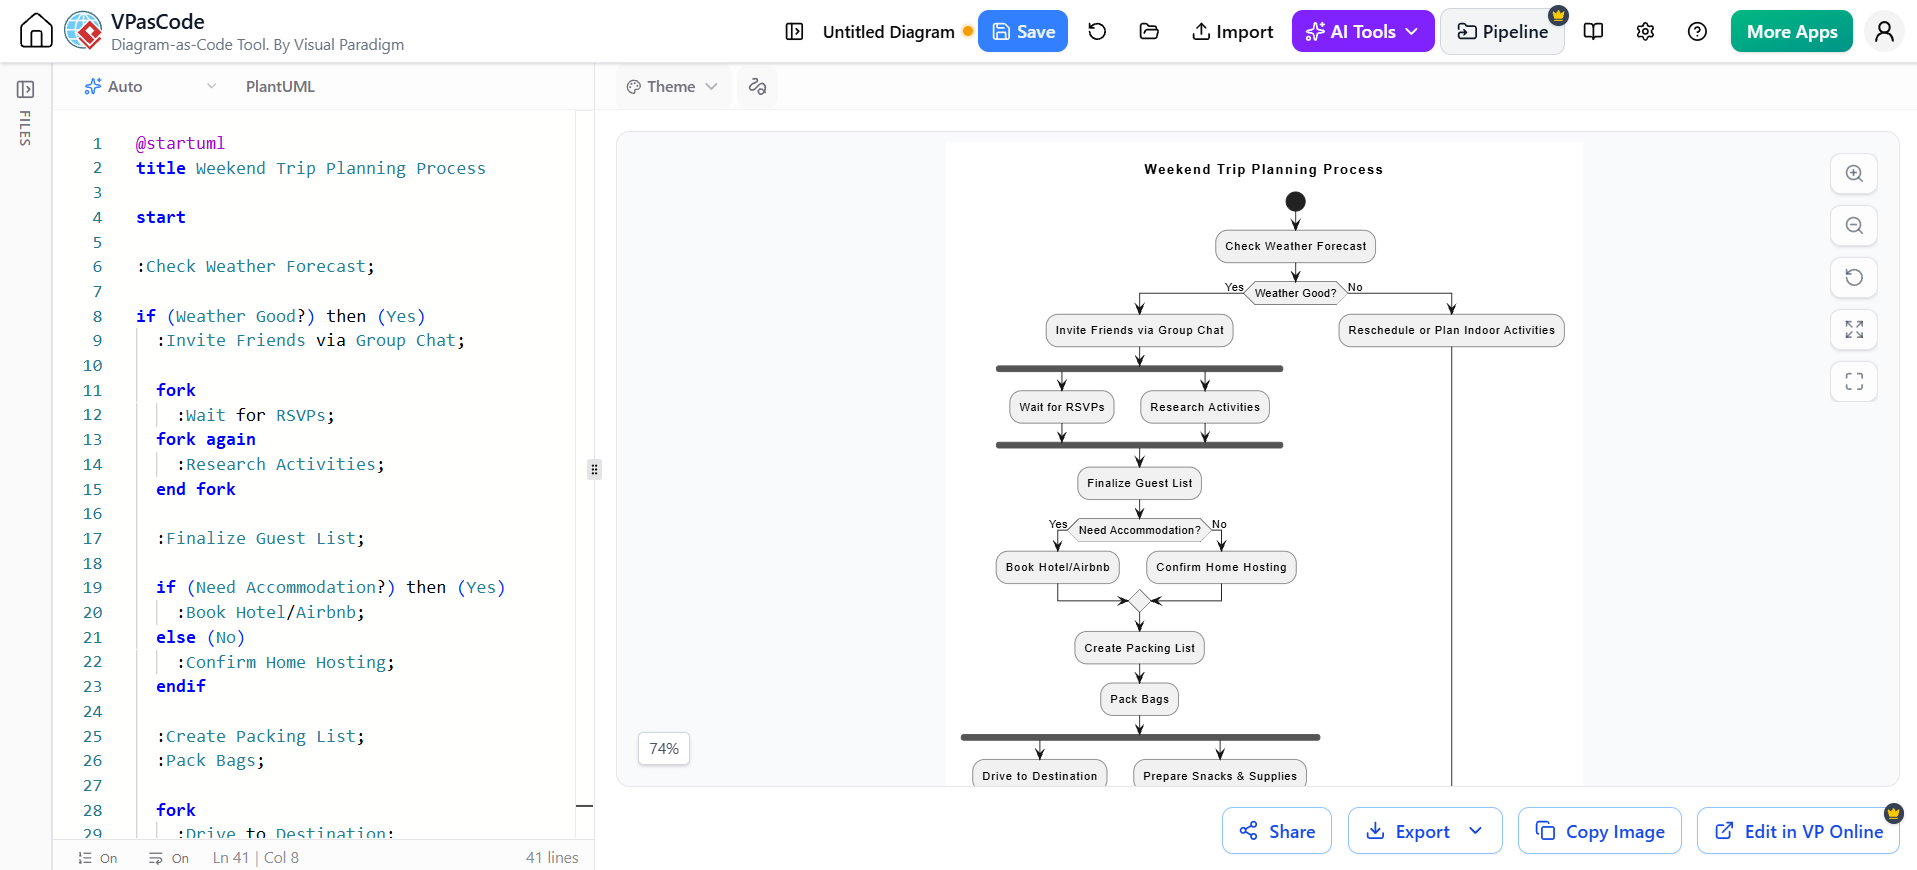
@startuml
title Weekend Trip Planning Process

start

:Check Weather Forecast;

if (Weather Good?) then (Yes)
  :Invite Friends via Group Chat;

  fork
    :Wait for RSVPs;
  fork again
    :Research Activities;
  end fork

  :Finalize Guest List;

  if (Need Accommodation?) then (Yes)
    :Book Hotel/Airbnb;
  else (No)
    :Confirm Home Hosting;
  endif

  :Create Packing List;
  :Pack Bags;

  fork
    :Drive to Destination;
  fork again
    :Prepare Snacks & Supplies;
  end fork

  :Enjoy Weekend!;

else (No)
  :Reschedule or Plan Indoor Activities;
endif

stop
@enduml
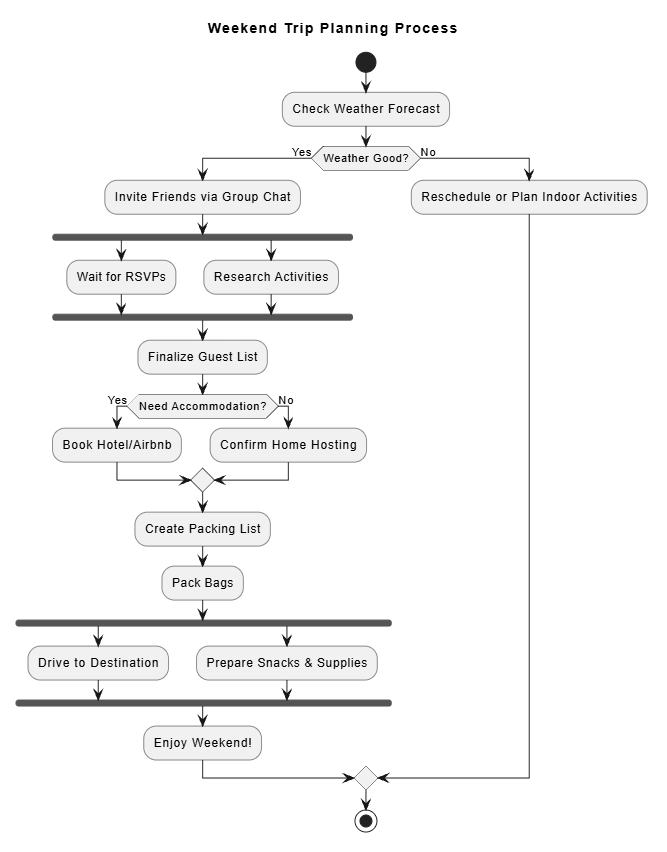
What This Shows
-
Parallel Processing: Inviting friends and researching activities happen simultaneously (fork/join)
-
Decision Logic: Weather check determines path; accommodation need creates another branch
-
Clear Start/End: Defined boundaries make scope explicit
Common Flowchart Mistakes—and How to Avoid Them
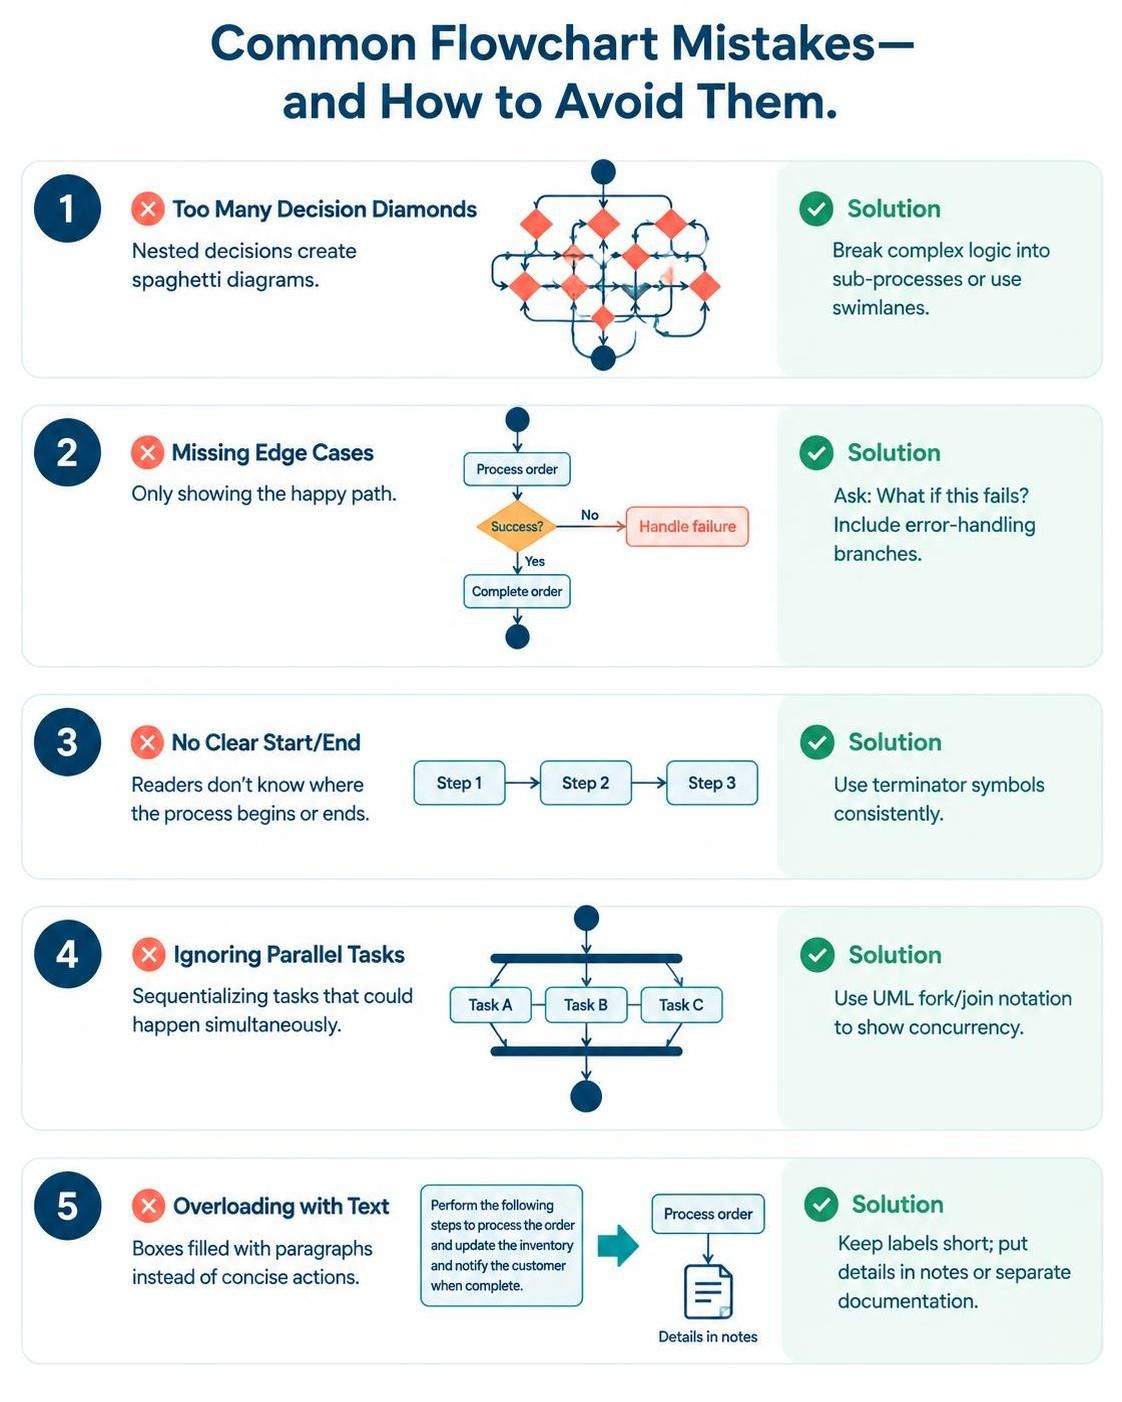
❌ Mistake 1: Too Many Decision Diamonds
Problem: Nested decisions create spaghetti diagrams.
Solution: Break complex logic into sub-processes or use swimlanes.
❌ Mistake 2: Missing Edge Cases
Problem: Only showing the “happy path.”
Solution: Always ask, “What if this fails?” Include error handling branches.
❌ Mistake 3: No Clear Start/End
Problem: Readers don’t know where the process begins or ends.
Solution: Use terminator symbols (circles) consistently.
❌ Mistake 4: Ignoring Parallel Tasks
Problem: Sequentializing tasks that could happen simultaneously.
Solution: Use fork/join notation in UML Activity Diagrams to show concurrency.
❌ Mistake 5: Overloading with Text
Problem: Boxes filled with paragraphs instead of concise actions.
Solution: Keep labels short. Use notes or separate documentation for details.
Choosing a Tool: Paper, Whiteboard, or Software?
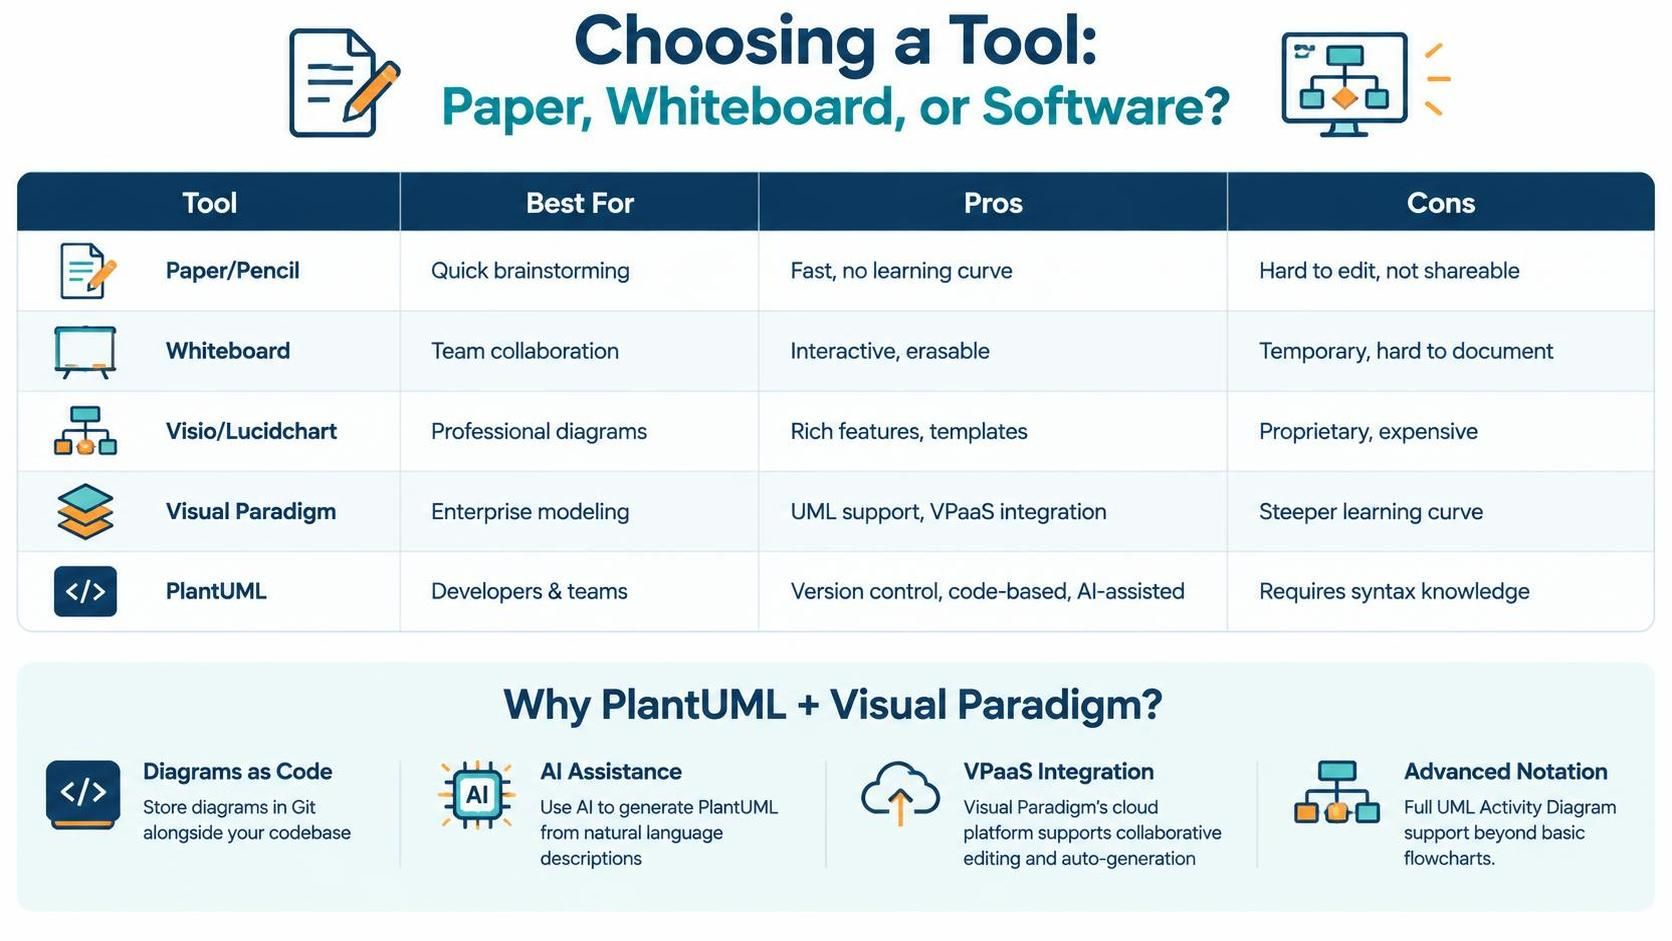
| Tool | Best For | Pros | Cons |
|---|---|---|---|
| Paper/Pencil | Quick brainstorming | Fast, no learning curve | Hard to edit, not shareable |
| Whiteboard | Team collaboration | Interactive, erasable | Temporary, hard to document |
| Visio/Lucidchart | Professional diagrams | Rich features, templates | Proprietary, expensive |
| Visual Paradigm | Enterprise modeling | UML support, VPaaS integration | Steeper learning curve |
| PlantUML | Developers & teams | Version control, code-based, AI-assisted | Requires syntax knowledge |
Why PlantUML + Visual Paradigm?
-
Diagrams as Code: Store diagrams in Git alongside your codebase
-
AI Assistance: Use AI to generate PlantUML from natural language descriptions
-
VPaaS Integration: Visual Paradigm’s cloud platform supports collaborative editing and auto-generation
-
Advanced Notation: Full UML Activity Diagram support beyond basic flowcharts
When a Flowchart Isn’t the Right Choice
Flowcharts excel at sequential logic, but consider alternatives when:
-
Modeling State Changes: Use State Machine Diagrams instead
-
Showing System Architecture: Use Component or Deployment Diagrams
-
Capturing User Journeys: Use User Story Maps or Journey Maps
-
Complex Data Flows: Use Data Flow Diagrams (DFD)
-
Time-Critical Processes: Use Gantt Charts or Timeline Views
Your First Flowchart: A Quick Start Checklist
✅ Define the goal: What process are you mapping?
✅ Identify stakeholders: Who needs to understand this?
✅ Choose notation: Basic flowchart or UML Activity Diagram?
✅ List steps: Brainstorm all actions and decisions
✅ Map relationships: Connect steps logically
✅ Add parallel paths: Use fork/join where applicable
✅ Validate: Walk through with a colleague
✅ Iterate: Refine based on feedback
✅ Document: Add notes for complex steps
✅ Share: Export as image or embed in documentation
Conclusion
Transforming chaos into clarity isn’t just about drawing pretty diagrams—it’s about creating shared understanding, identifying inefficiencies, and enabling better decision-making. While basic flowcharts serve well for simple processes, UML Activity Diagrams provide the expressive power needed for modern, complex systems.
By leveraging tools like Visual Paradigm and PlantUML, you gain the ability to treat diagrams as living documentation—version-controlled, collaboratively edited, and easily maintained. The shift from static images to “diagrams as code” represents a fundamental improvement in how teams communicate and preserve institutional knowledge.
Start small. Map one process this week. Share it with your team. Iterate based on feedback. Before long, you’ll find that visual thinking becomes second nature, and the chaos that once overwhelmed your projects will give way to clarity, confidence, and control.
Suggested Article Titles
-
Best AI Flowchart Generator: Visual Paradigm: An in-depth guide covering how AI flowchart generation works across VP Desktop (for advanced editing and offline work) and OpenDocs (for embedding live, editable diagrams directly in documents).
-
AI Flowchart Generator in OpenDocs: Create Flowcharts from Text: A release announcement detailing the AI flowchart feature within OpenDocs, highlighting text-to-diagram conversion, full editing capabilities, and use cases for business analysts and project managers.
-
How to Generate Flowcharts with AI in Visual Paradigm: A video walkthrough and guide explaining the benefits of automated flowchart creation, practical use cases (SOPs, software logic, troubleshooting), and a step-by-step tutorial for generating diagrams from text in VP Desktop.
-
Next-Gen AI Flowchart Generator: Clearer Process Workflows Made Simple: A product update introducing a rebuilt flowchart generation engine that applies standardized shapes (terminators, processes, decisions) and integrates with VPasCode for real-time code-based editing and export.
-
Introduce Stepwise Flowcharts: AI-Powered Process Mapping: An article announcing the “Stepwise Flowchart” feature in the AI Chatbot, designed to break complex workflows into logical phases or clusters for clearer macro-level process visualization.
-
Mapping Support Ticket Workflows Using a Professional AI Flowchart Generator: A focused tutorial showing how to use the AI flowchart generator in VP Desktop to transform a text description of a customer support ticket system into a structured, editable visual diagram.