


Introduction
In today’s increasingly complex software and hardware ecosystems, understanding the precise temporal behavior of systems has become critical. Whether designing embedded microcontrollers for automotive safety systems, orchestrating distributed cloud services with strict latency requirements, or modeling real-time communication protocols, engineers need powerful visualization tools to reason about time-dependent interactions. UML Timing Diagrams serve as an essential instrument in this domain, providing a standardized visual language to map state transitions, message exchanges, and temporal constraints across system components.

This case study explores the comprehensive capabilities of UML Timing Diagrams within the Visual Paradigm modeling platform. We examine foundational concepts, practical implementation workflows, and the transformative impact of AI-powered automation on timing diagram creation. By bridging theoretical UML specifications with hands-on tooling features—including native AI generation, interactive waveform manipulation, and Open API integration—this guide empowers system architects, embedded engineers, and product teams to model time-critical behaviors with unprecedented clarity and efficiency. Whether you are validating hardware signal sequences or optimizing cloud service timeout strategies, the techniques presented here provide a robust framework for mastering temporal system design.
What is Timing Diagram?
Timing diagrams are UML interaction diagrams used to show interactions when a primary purpose of the diagram is to reason about time.
Timing diagrams focus on conditions changing within and among lifelines along a linear time axis. Timing Diagrams describe behavior of both individual classifiers and interactions of classifiers, focusing attention on time of occurrence of events causing changes in the modeled conditions of the Lifelines.
Time Diagram at a Glance
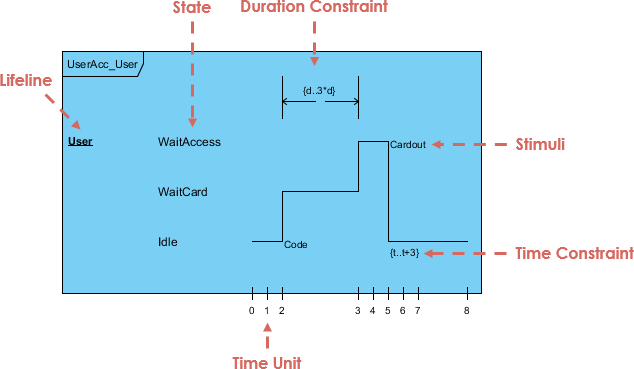
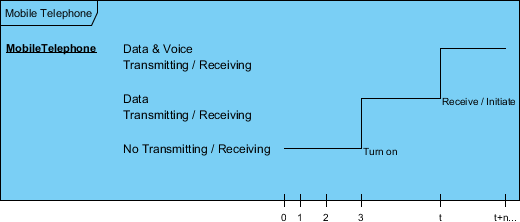
State Timeline Representation
Changes from one state to another are represented by a change in the level of the lifeline. For the period of time when the object is a given state, the timeline runs parallel to that state. A change in state appears as a vertical change from one level to another. The cause of the change, as is the case in a state or sequence diagram, is the receipt of a message, an event that causes a change, a condition within the system, or even just the passage of time.
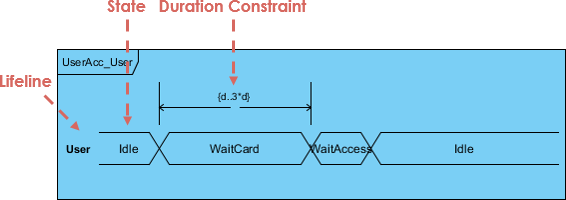
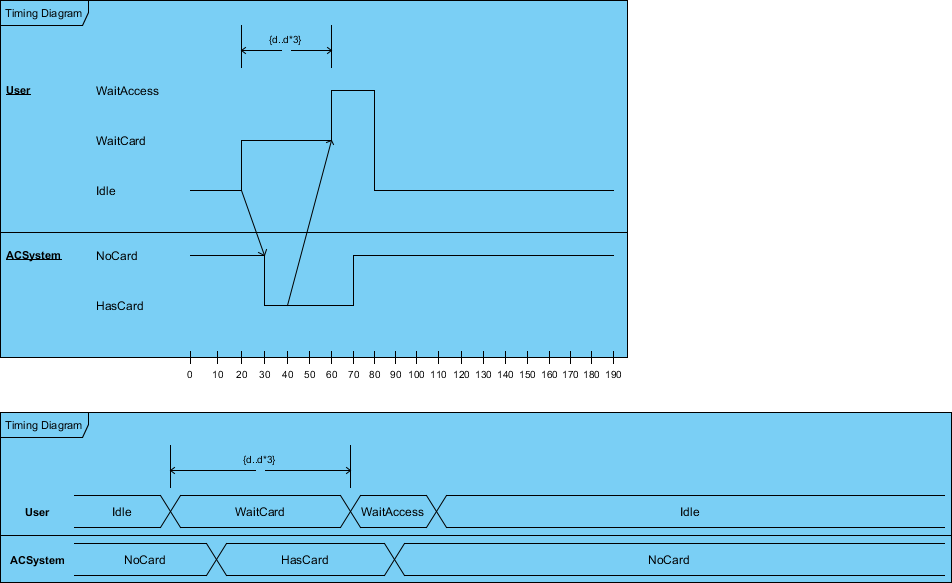
Value lifeline Representation
The figure below shows an alternative notation of UML Timing diagram. It shows the state of the object between two horizontal lines that cross with each other each time the state changes.
Basic Concepts of Timing Diagrams
Major elements of timing UML diagram – lifeline, timeline, state or condition, message, duration constraint, timing ruler.
Lifeline
A lifeline in a Timing diagram forms a rectangular space within the content area of a frame. Lifeline is a named element which represents an individual participant in the interaction. It is typically aligned horizontally to read from left to right.

Multiple lifelines may be stacked within the same frame to model the interaction between them.
State Timeline in Timing Diagram
A state or condition timeline represents the set of valid states and time. The states are stacked on the left margin of the lifeline from top to bottom.
The cause of the change, as is the case in a state or sequence diagram, is the receipt of a message, an event that causes a change, a condition within the system, or even just the passage of time.
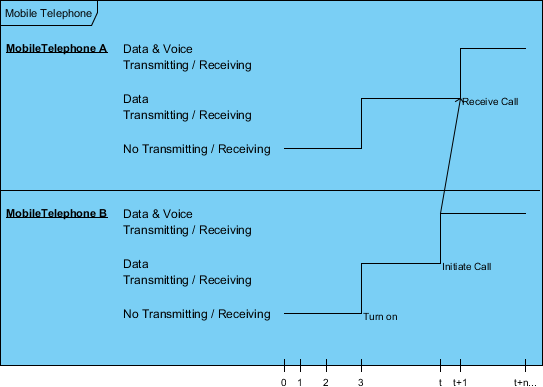
Multiple Compartments
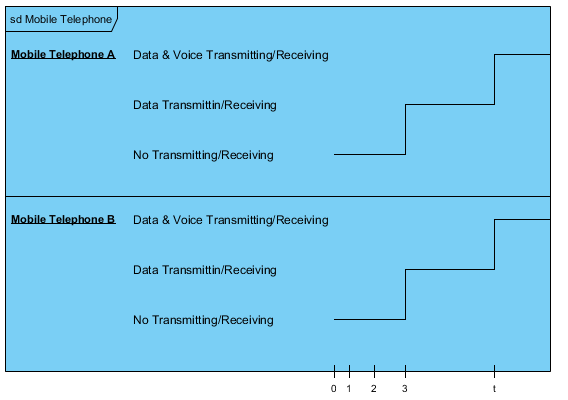
It is possible to stack several life lines of different objects in the same timing diagram. One life line above the other. Messages sent from one object to another can be depicted using simple arrows. The start and the end points of each arrow indicate when each message was sent and when it was received.
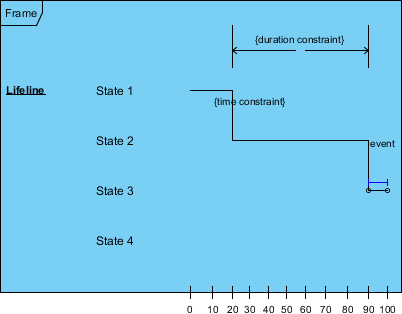
State Lifeline
A state lifeline shows the change of state of an item over time. The X-axis displays elapsed time in whatever units are chosen while the Y-axis is labelled with a given list of states. A state lifeline is shown below:
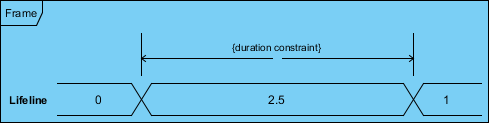
Value Lifeline
A value lifeline shows the change of value of an item over time. The X-axis displays elapsed time in whatever units are chosen, the same as for the state lifeline. The value is shown between the pair of horizontal lines which crosses over at each change in value.
Timeline and Constraints
We can use the length of a timeline to indicate how long the object remains in a particular state by reading it from left to right. To associate time measurements, you show tick marks online the bottom part of the frame.
The example below shows that the Login event is received three time units after the start of the sequence. To show relative times, you can mark a specific instance in time using a variable name. The figure marks the time the sendMail event is received as time
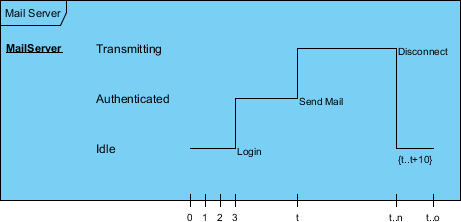
You can use relative time marks in constraints to indicate that a message must be received within a specified amount of time.
State and Value Lifeline Side-by-Side
State and Value Lifelines can be put one after the other in any combination. Messages can be passed from one lifeline to another. Each state or value transition can have a defined event, a time constraint which indicates when an event must occur, and a duration constraint which indicates how long a state or value must be in effect for.
Model Consistency among Interaction Diagrams
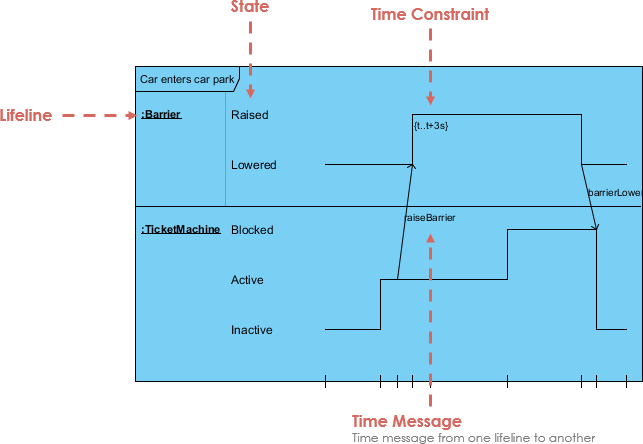
Timing diagram should always be consistent with the relevant sequence diagram and state machine. To do this we can attach states in the lifeline for each of the objects in the sequence diagram. We can then derive the corresponding timing diagram much easier by inspecting the message passing between the objects against the states attached in the lifeline. The Carpark example below shows the model consistency between two interaction diagrams.
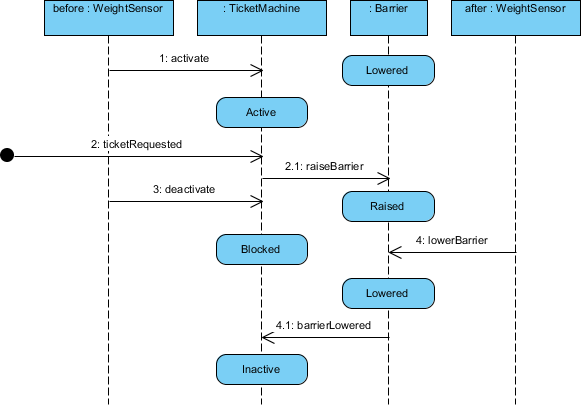
The figure above shows a sequence diagarm of the car park example, while the figure below presents the corresponding timing diagram of the car park example. The various parts of the timing diagram refer to the content of sequence diagram.
How to Draw a Timing Diagram in UML?
The UML timing diagrams focus on the specific timing in which the messages are sent from one object to another and on the specific timing in which objects change their state. Timing diagrams are common when dealing with real time systems.
Steps to develop a Timing Diagram
The steps below outline the major steps to take in creating a UML Timing Diagram.
-
Stack several life lines of different objects in the same timing diagram.
-
Put one life line with a number of possible states above the other vertically, and the passage of time (say in seconds) horizontally.
-
Each object has a set of possible states. The state will be changed over time indicated by the timeline.
-
Model the messages sent from one object to another can be depicted using simple arrows.
-
Remind that the start and the end points of each arrow indicate when each message was sent and when it was received.
Timing Diagram at a glance
Developing a Timing Diagram
-
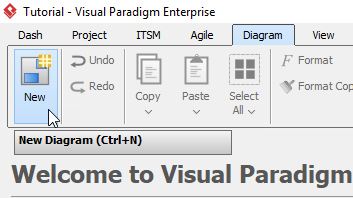
Click Diagram > New from the toolbar.
-
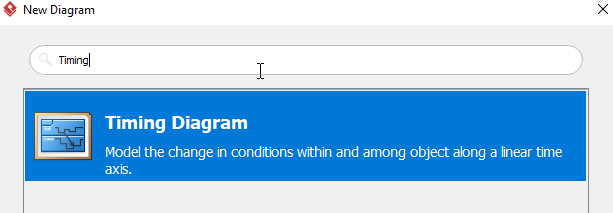
In the New Diagram window, choose Timing Diagram, then Click Next. You can use the search bar to find the diagram.
-
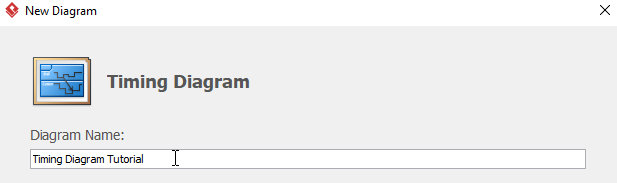
Name the diagram then click OK. We will name the diagram Select Timing Diagram in this tutorial.
-
You will then see an empty diagram
-
Select Timing Frame, then click or drag on the diagram to create a timing frame.
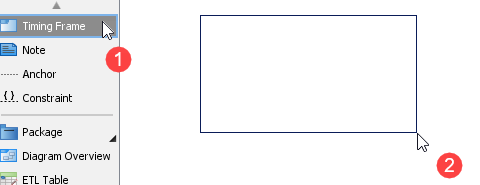
-
Double click the word Frame on the timing frame to rename the frame.
-
Right click the frame and select Add Lifeline to create a lifeline.
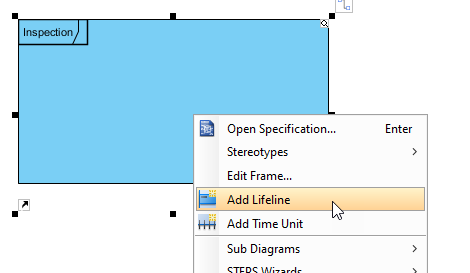
-
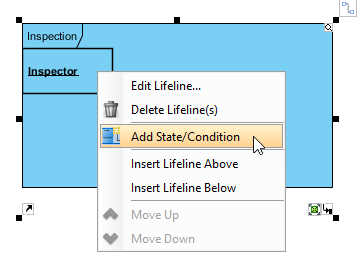
Double click Lifeline and rename the lifeline to Inspector. Right click Inspector and select Add State/ Condition to create a new state or condition.
-
Double click State/Condition and rename the state or condition. In this tutorial, we will be renaming this state to Idle.
-
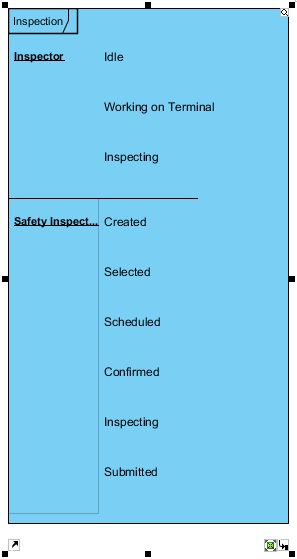
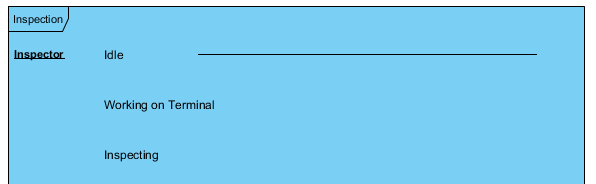
Repeat step 7 to 9 for creating more lifelines and state or conditions.
-
You should see a diagram like this after adding lifelines and states:
-
Right click on any empty space in the timing frame, and click Add Time Unit. We will then see a tiny vertical line (the time unit) appear at the bottom of the frame.
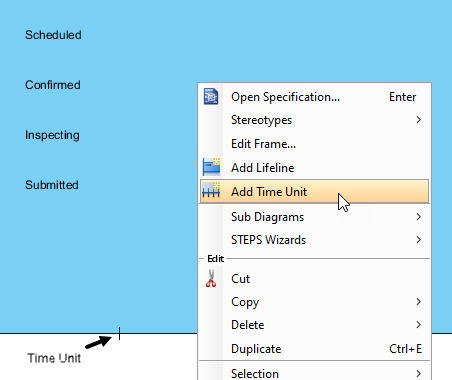
-
Double click the time unit to add a caption.
-
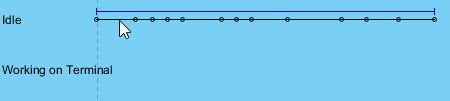
Repeat step 12 and 13 for more time units. Except the leftmost time unit, you can drag and relocate all time units. When you are adding more time units, you can see a line appears on every lifeline.
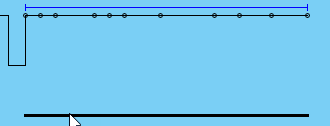
-
When you move your cursor near the line mentioned on step 13, you will see the line being separated by dots and a blue line above.
-
You can either move the a single segment to different state/condition by click-dragging the separated line…
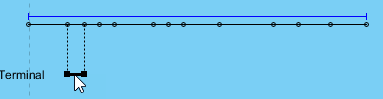
Or move the connected lines on the same stage/condition by click-dragging the blue line.
-
You can get something like this after moving the lines:
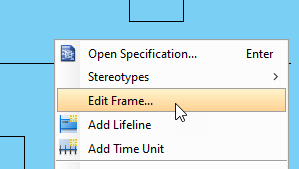
-
Right click on any empty space in the time frame, then click Edit Frame.
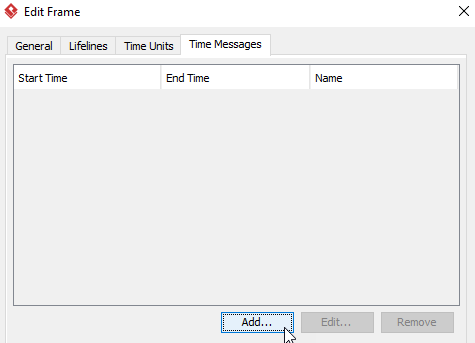
-
In the Edit Frame window, click Time Mesages > Add.
-
In the Add Time Message window, name the time message, and set up the desire Start/End lifeline and time.
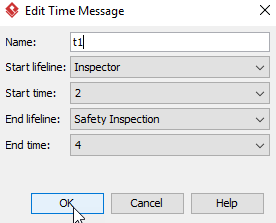
-
Repeat step 19 and 20 for more time messages
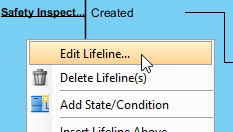
-
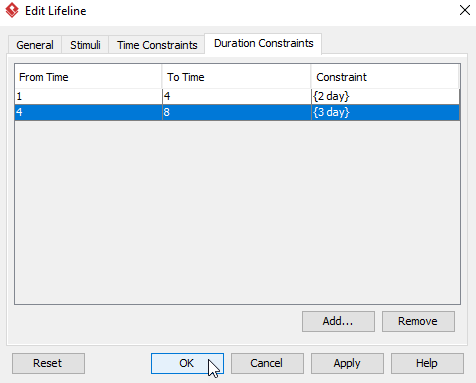
Right click the Safety Inspector lifeline, then select Edit Lifeline.
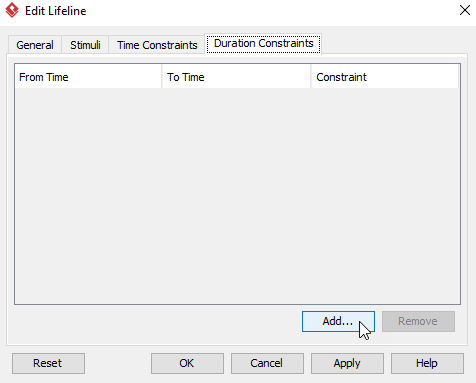
-
In the Edit Lifeline window, select Duration Constraints > Add.
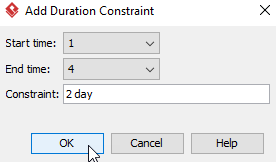
-
In the Add Duration Constraint, select the Start/End time and set up the duration of the constraint, then click OK.
-
Repeat step 23 and 24 for more duration constraints.
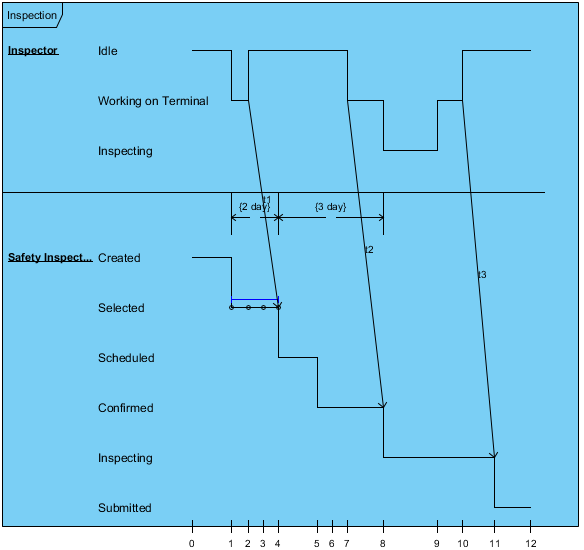
-
After adding duration constraints, click OK on the Edit Lifeline window.
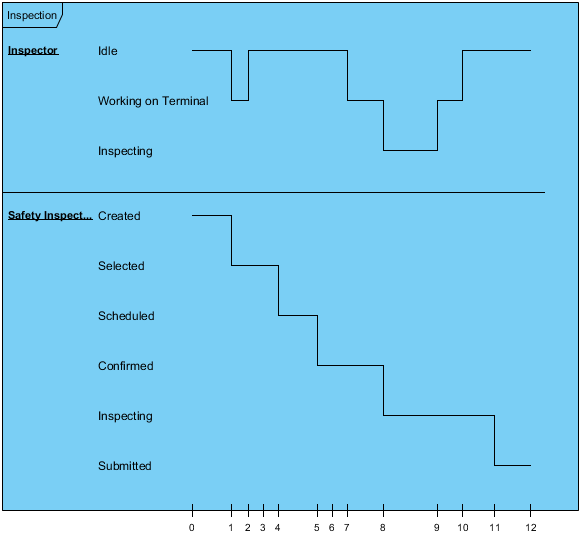
-
You should get something similar when you are finishing the diagram:
The AI-Powered Timing Diagram Approach
Visual Paradigm features a dedicated, native AI-Powered Timing Diagram Generator alongside its core UML 2.x timing suite. Historically considered one of the most tedious modeling layouts to draw manually due to tight horizontal time axes and complex waveforms, the platform uses generative AI to dramatically simplify real-time and embedded hardware system designs.
Visual Paradigm integrates state-of-the-art language processing to turn raw temporal constraints directly into properly aligned time-domain wave transitions.
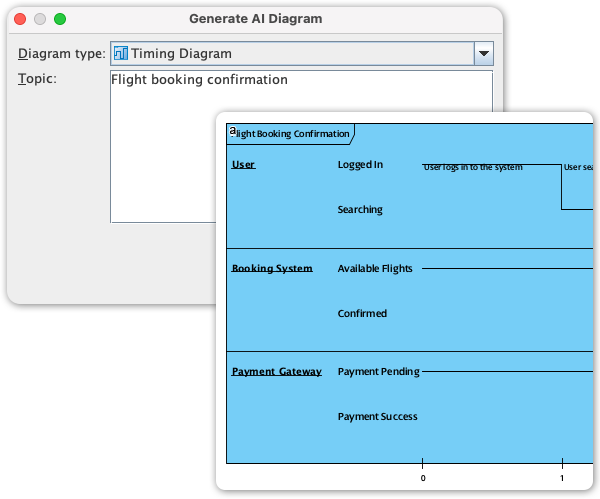
-
Text-to-Waveform Generation: You can input explicit, plain-language sequences to populate a timeline. For example: “Draw a timing diagram for a smart microwave. The Magnetron stays Idle for 2 seconds, goes to High Power for 30 seconds, then drops to Off. The Door Sensor transitions from Closed to Open at second 15, causing an instant safety event.” The AI analyzes these events, builds the discrete horizontal ticks, sets up separate vertical lifelines, and constructs the wave transitions.
-
Automatic Scaling & Constraint Alignment: Rather than manually formatting spacing, the AI handles precise geometric alignment based on numerical metrics specified in your text. It handles initial time tick placement, scales waveforms, and groups system parameters into separate rows automatically.
-
Natural Language Refactoring: Once the initial waveform is rendered, you can talk directly to the AI chatbot to alter timelines. Commands like “Shift the sensor timeout delay back by 50ms” or “Inject an error exception message arrow from lifeline A to lifeline B at t=5” will automatically adjust the visual timing segments on the canvas.
Core Technical Modeling Capabilities
Once the AI generates your structural baseline, Visual Paradigm allows deep customization using standard UML 2.0 interaction specifications:
-
Dual Notation Support: Modeled components support both State Timeline views (a continuous waveform stepping up and down between stacked text conditions) and Value Timeline views (horizontal blocks indicating when cross-system values change over time).
-
Interactive Waveform Manipulation: You can click and grab individual line segments directly on the timeline. Dragging a line segment up or down shifts its state/condition, while moving a boundary left or right dynamically compresses or expands that state’s duration.
-
Timing & Duration Constraints: Precision indicators let you apply relative and absolute time bounds. You can easily define duration constraints (e.g., d..3d) and time markers directly along the horizontal margin to ensure technical hardware compliance.
-
Inter-Lifeline Messages: Draw directional communication arrows between stacked vertical compartments. These specify exactly when a state change on one lifeline issues a message or trigger to modify an adjacent lifeline’s behavior.
Open API Automation & Log Visualization
For engineering teams working with physical hardware or simulation systems, Visual Paradigm includes programmatic hooks for timing data:
-
Simulation Log Parser: Using Visual Paradigm’s Open API, developers can feed raw text simulation outputs, logic analyzer logs, or embedded code traces directly into the software.
-
Automated Regression Visuals: This converts live log files straight into clean UML Timing Diagrams, allowing engineers to visually overlay and compare actual vs. expected runtime hardware behaviors to isolate bugs immediately.
Are you using timing diagrams to map out embedded hardware/microcontrollers, or are you designing distributed cloud network timeouts? Let me know, and I can generate an AI prompt sequence custom-built for your timing project!
Conclusion
UML Timing Diagrams represent a powerful, standardized approach to modeling time-dependent system behavior—a capability that grows increasingly vital as systems become more distributed, real-time, and safety-critical. Through this case study, we have explored both the foundational theory and practical application of timing diagrams within Visual Paradigm’s comprehensive modeling environment.
The integration of AI-powered generation transforms what was once a manually intensive, error-prone process into an intuitive, conversational workflow. Engineers can now describe temporal requirements in natural language and receive professionally structured diagrams instantly, accelerating design iterations and reducing specification ambiguity. Meanwhile, advanced features like dual notation support, interactive waveform editing, and Open API automation ensure that generated diagrams remain fully customizable and integrable into existing engineering pipelines.
Whether validating embedded firmware sequences, optimizing microservice timeout strategies, or documenting hardware-software handshakes, mastering UML Timing Diagrams equips teams with the clarity needed to build reliable, time-aware systems. By combining UML’s rigorous semantics with Visual Paradigm’s intelligent tooling, organizations can bridge the gap between abstract temporal requirements and concrete, verifiable system designs—ultimately delivering higher-quality products with greater confidence and efficiency.
References
- Visual Paradigm Timing Diagram Gallery: Showcases examples and templates of UML timing diagrams for real-time system modeling.
- AI Diagram Generation for Timing Diagrams: Release notes detailing Visual Paradigm’s AI-powered timing diagram generation capabilities.
- How to Draw Timing Diagram in UML: Step-by-step tutorial for creating UML timing diagrams using Visual Paradigm.
- Comprehensive Guide to Visual Paradigm’s AI Ecosystem: Explores how artificial intelligence transforms visual modeling workflows in Visual Paradigm.
- What is Timing Diagram?: Comprehensive guide explaining UML timing diagrams, their purpose, and core concepts.
- Case Study: Enhancing System Modeling Efficiency with AI-Powered Chatbot: Real-world example of using Visual Paradigm’s AI chatbot to improve modeling productivity.
- Harnessing Visual Paradigm’s AI for Diagram Generation: The Ultimate 2026 Guide: Advanced strategies for leveraging AI-powered diagram generation in Visual Paradigm.
- AI Activity Diagram Example: Hotel Booking Process: Demonstrates AI-generated activity diagrams for complex business processes.
- Mastering UML Timing Diagrams: A Practical Review of Visual Paradigm’s Approach to Real-Time System Modeling: In-depth analysis of timing diagram best practices and Visual Paradigm’s implementation.
- UML Timing Diagram Tutorial Video: Video walkthrough demonstrating timing diagram creation and usage in Visual Paradigm.
- Advanced Timing Diagram Techniques: Extended tutorial covering advanced features and customization options for UML timing diagrams.
- What is Timing Diagram? (Traditional Chinese): Traditional Chinese language guide to UML timing diagrams and their applications.
- Open API: Highlight Element: Documentation for using Visual Paradigm’s Open API to programmatically manipulate diagram elements.
- Visual Paradigm Open API Demonstration: Video tutorial showing how to use Visual Paradigm’s Open API for automated diagram generation and manipulation.
- Create Timing Diagram using Open API – Visual Paradigm Know-how: Technical documentation for programmatically generating timing diagrams via Visual Paradigm’s Open API.
This post is also available in Deutsch, Español, فارسی, Français, English, Bahasa Indonesia, 日本語, Polski, Portuguese, Ру́сский, Việt Nam, 简体中文 and 繁體中文.