


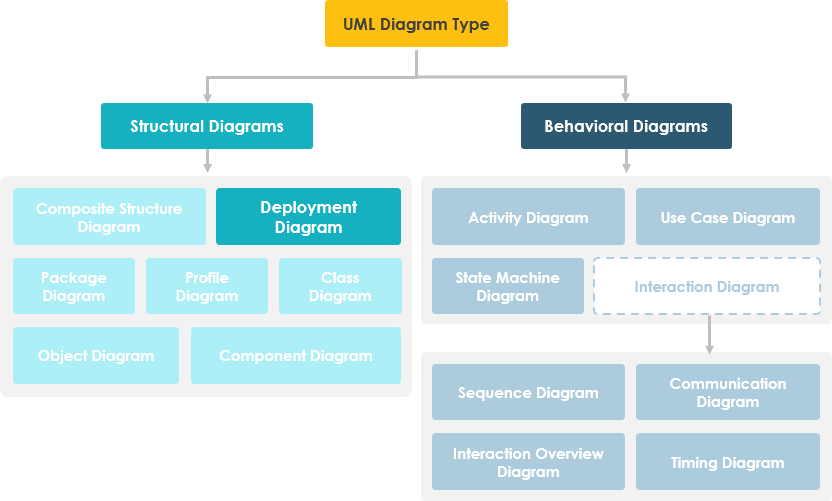
Introduction
In today’s rapidly evolving technological landscape, designing robust, scalable, and secure system architectures has become both a critical challenge and a competitive advantage. As organizations transition from monolithic applications to distributed, cloud-native, and IoT-enabled systems, the need for clear, actionable visualizations of physical infrastructure has never been more urgent. UML Deployment Diagrams serve as the essential bridge between software design and real-world infrastructure, enabling architects, developers, and operations teams to collaboratively plan, document, and communicate how software components map to hardware nodes, execution environments, and network topologies.

This case study explores the practical application of UML Deployment Diagrams through the lens of modern AI-powered tooling. We examine how teams can leverage conversational AI to accelerate infrastructure modeling, reduce architectural ambiguity, and create living documentation that evolves alongside production systems. Whether you are designing an embedded medical device, a client/server enterprise application, or a globally distributed microservices platform, this guide provides actionable insights, visual examples, and step-by-step methodologies to transform abstract requirements into deployable, maintainable system architectures.
What is a Deployment Diagram?
A UML deployment diagram is a diagram that shows the configuration of run time processing nodes and the components that live on them. Deployment diagrams is a kind of structure diagram used in modeling the physical aspects of an object-oriented system. They are often be used to model the static deployment view of a system (topology of the hardware).
When to Use Deployment Diagram
-
What existing systems will the newly added system need to interact or integrate with?
-
How robust does system need to be (e.g., redundant hardware in case of a system failure)?
-
What and who will connect to or interact with system, and how will they do it
-
What middleware, including the operating system and communications approaches and protocols, will system use?
-
What hardware and software will users directly interact with (PCs, network computers, browsers, etc.)?
-
How will you monitor the system once deployed?
-
How secure does the system needs to be (needs a firewall, physically secure hardware, etc.)?
Purpose of Deployment Diagrams
-
They show the structure of the run-time system
-
They capture the hardware that will be used to implement the system and the links between different items of hardware.
-
They model physical hardware elements and the communication paths between them
-
They can be used to plan the architecture of a system.
-
They are also useful for Document the deployment of software components or nodes
Deployment Diagram at a Glance
Deployment diagrams are important for visualizing, specifying, and documenting embedded, client/server, and distributed systems and also for managing executable systems through forward and reverse engineering.
A deployment diagram is just a special kind of class diagram, which focuses on a system’s nodes. Graphically, a deployment diagram is a collection of vertices and arcs. Deployment diagrams commonly contain:
Nodes
-
3-D box represents a node, either software or hardware
-
HW node can be signified with <>
-
Connections between nodes are represented with a line, with optional <>
-
Nodes can reside within a node
Other Notations
-
Dependency
-
Association relationships.
-
May also contain notes and constraints.
AI-Powered Physical Architecture Planning
Mapping software artifacts to physical hardware nodes is a critical step in deployment planning. Visual Paradigm’s AI tools help you visualize complex network topologies and hardware configurations, transforming your system requirements into precise Deployment Diagrams.
VP Desktop: Professional Modeling
Leverage AI within the Desktop environment to generate initial deployment views. Use the professional modeler to define 3D nodes, specify communication paths (TCP/IP, etc.), and manage artifact manifestations with industry-standard precision.
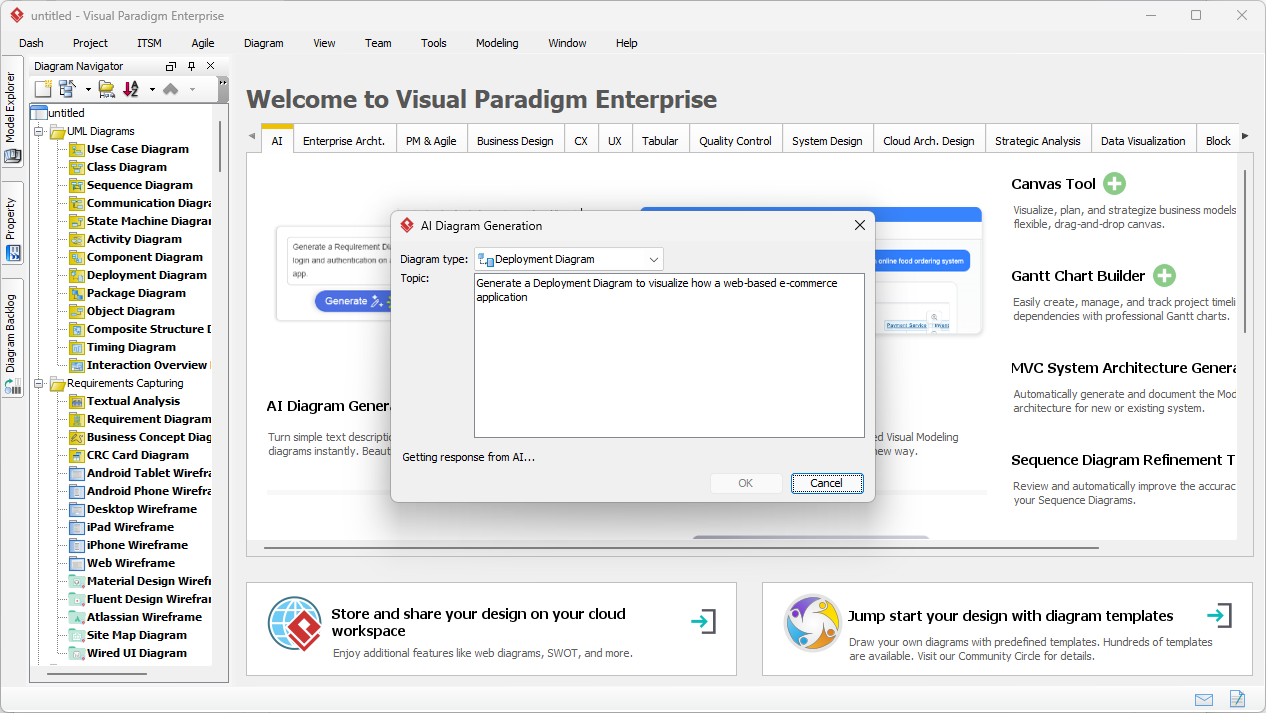
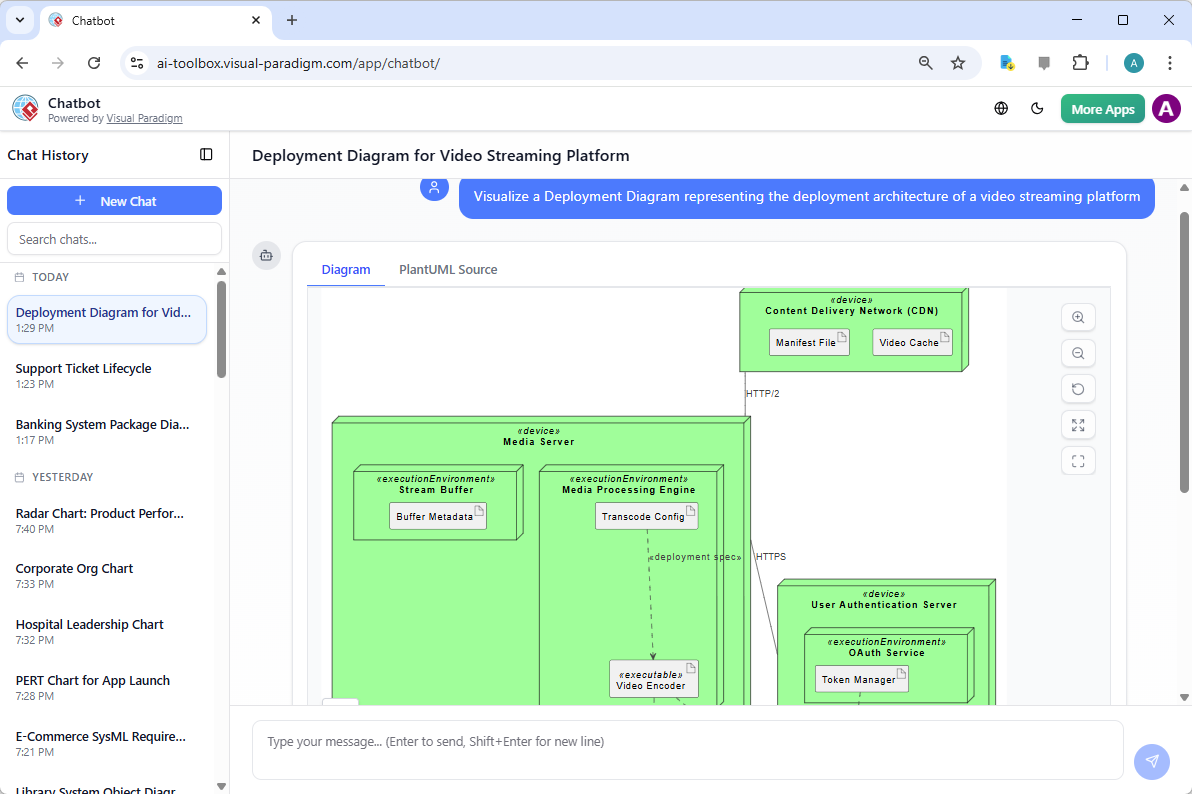
AI Chat: Conversational Planning
Describe your server clusters, cloud platforms, or embedded hardware to the AI Chatbot. Instantly generate editable diagrams that visualize how your software components are distributed across your physical infrastructure.
AI Deployment Capabilities: • Identify hardware nodes & devices • Model communication protocols • Visualize artifact distribution • Plan system installation topology.
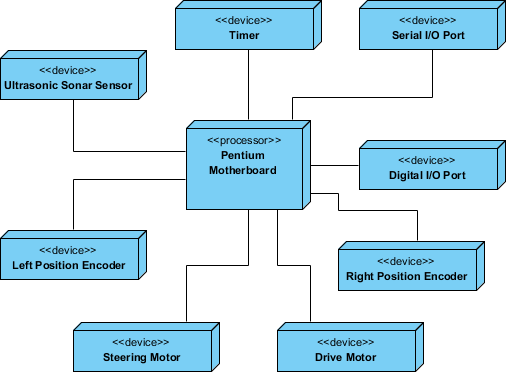
Steps for Modeling an Embedded System
-
Identify the devices and nodes that are unique to your system.
-
Provide visual cues, especially for unusual devices, by using the UML’s extensibility mechanisms to define system-specific stereotypes with appropriate icons. At the very least, you’ll want to distinguish processors (which contain software components) and devices (which, at that level of abstraction, don’t directly contain software).
-
Model the relationships among these processors and devices in a deployment diagram. Similarly, specify the relationship between the components in your system’s implementation view and the nodes in your system’s deployment view.
-
As necessary, expand on any intelligent devices by modeling their structure with a more detailed deployment diagram.
Steps for Modeling a Client/Server System
-
Identify the nodes that represent your system’s client and server processors.
-
Highlight those devices that are germane to the behavior of your system. For example, you’ll want to model special devices, such as credit card readers, badge readers, and display devices other than monitors, because their placement in the system’s hardware topology are likely to be architecturally significant.
-
Provide visual cues for these processors and devices via stereotyping.
-
Model the topology of these nodes in a deployment diagram. Similarly, specify the relationship between the components in your system’s implementation view and the nodes in your system’s deployment view.
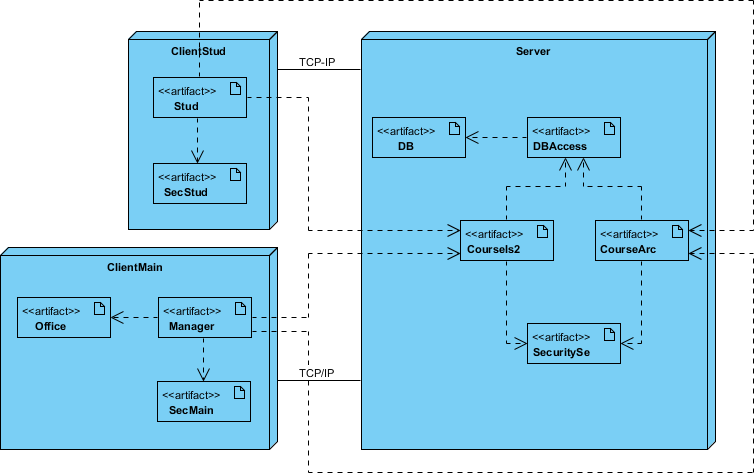
The example shows the topology of a human resources system, which follows a classical client/server architecture.
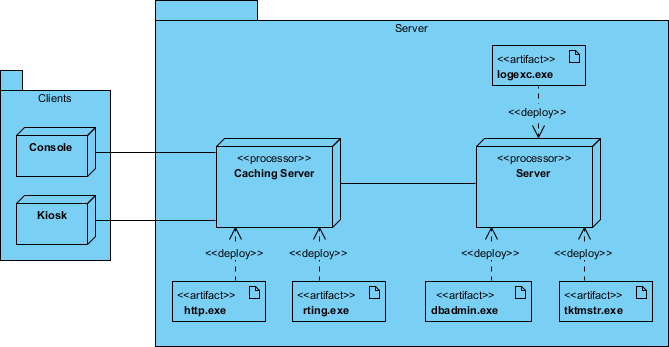
TCP/IP Client / Server Example
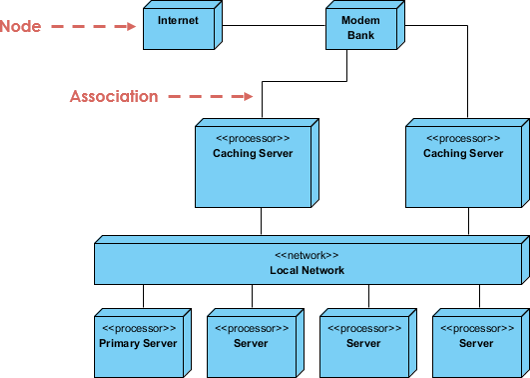
Deployment Diagram Example – Modeling a Distributed System
-
Identify the system’s devices and processors as for simpler client/server systems.
-
If you need to reason about the performance of the system’s network or the impact of changes to the network, be sure to model these communication devices to the level of detail sufficient to make these assessments.
-
Pay close attention to logical groupings of nodes, which you can specify by using packages.
-
Model these devices and processors using deployment diagrams. Where possible, use tools that discover the topology of your system by walking your system’s network.
-
If you need to focus on the dynamics of your system, introduce use case diagrams to specify the kinds of behavior you are interested in, and expand on these use cases with interaction diagrams.
-
When modeling a fully distributed system, it’s common to reify the network itself as an node. i.e. Internet, LAN, WAN as nodes
The Example shows the topology of a fully distributed system.
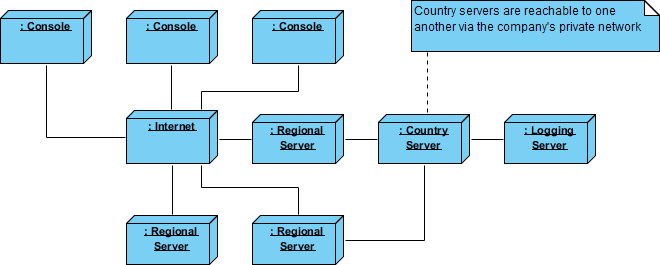
Deployment Diagram Example – Corporate Distributed System
Deployment Planning Checklist
When you are drafting a deployment planning for your company, you may find that you do not know where to start or what you should focus on. The following checklist may give you some ideas with planning for deployment:
-
How will your system be installed?
-
Who will install it? How long should it take to install?
-
Where the installation possibly fail?
-
How do you back out if the installation fails? How long does it take to back out?
-
What is your installation window (during what time period can you install your system)?
-
What backups do you need before installation?
-
Do you need to do a data conversion?
-
How do you know that the installation was successful?
-
-
If different versions of the system will be in production at the same time, how will you resolve differences?
-
What physical sites do you need to deploy to and in what order?
-
How will you train your support and operations staff?
-
Do you need to deploy a production support system so that the support staff uses their own environment to simulate problems?
-
-
How will you train your users?
-
What documentation, and in what formats and languages, do your users, and support and operation staff need?
-
How will updates to documentation be deployed?
-
How to Draw a Deployment Diagram in UML?
Deployment Diagram describes what existing systems will system need to interact or integrate with, such as:
-
What and who will connect to or interact with system, and how will they do it?
-
What middle-ware, including the operating system and communications approaches and protocols, will system use?
-
What hardware and software will users directly interact with (PCs, network computers, browsers, etc.)?
How to develop Deployment Diagrams?
The steps below outline the major steps to take in creating a UML Deployment Diagram.
-
Decide on the purpose of the diagram
-
Add nodes to the diagram
-
Add communication associations to the diagram
-
Add other elements to the diagram, such as components or active objects, if required
-
Add dependencies between components and objects, if required
Developing a Deployment Diagram
-
Click Diagram > New from the toolbar.
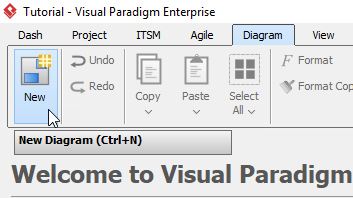
-
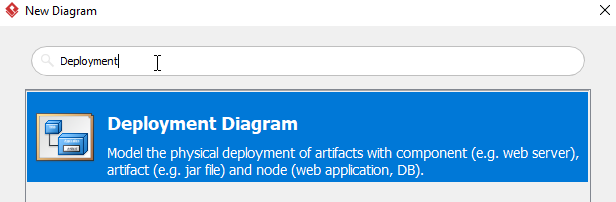
In the New Diagram window, choose Deployment Diagram then click Next. The search bar can help you searching the diagram.
-
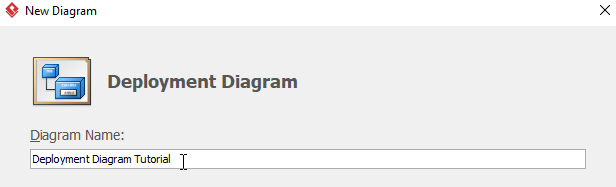
Name the diagram, then click OK. In this tutorial, we will name the diagram Deployment Diagram Tutorial.
-
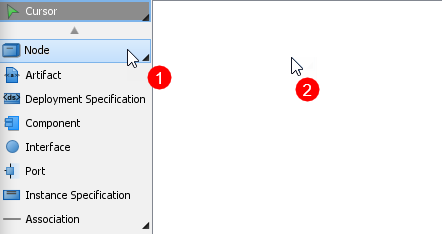
To create the first node, choose Node from the menu on the left, then click on any empty space on the diagram. Rename the node by double clicking the name.
-
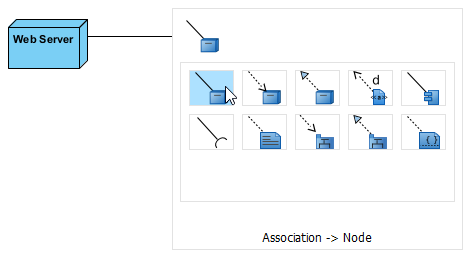
To create a node which associates with other nodes, click on the node (Web Server in this case), then click drag the resource icon Resource Catalog.
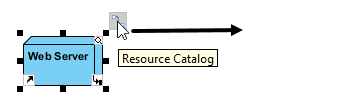
When you release the cursor, a popup menu will appear. Select Association -> Node form the menu, a new node will be created.
-
Repeat step 5 to generate more nodes.
-
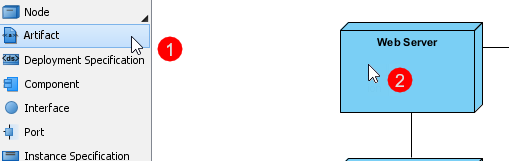
To create an artifact for a node, click Artifact from the menu on the left, then click the desire node. Rename the artifact by double clicking the name.
-
Repeat step 7 for more artifacts.
-
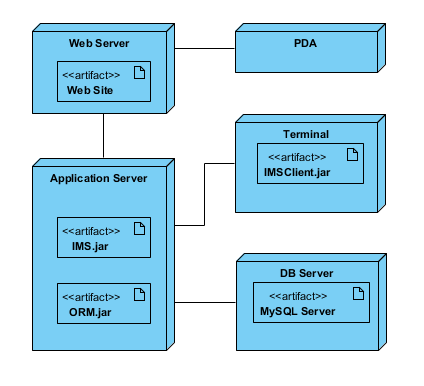
You should have a diagram similar to this:
The AI-Powered Approach to Deployment Diagrams
The platform integrates its conversational generative AI directly into Visual Paradigm OpenDocs, VP Online, and the Desktop platform. This changes infrastructure modeling from manual node placement to conversational system design:
-
Natural Language Infrastructure Prompts: You can generate highly specific network and physical layouts by writing a descriptive prompt. For example, typing: “Draw a deployment diagram for a microservices cluster with an API gateway, redundant AWS EC2 application instances, and a multi-AZ PostgreSQL database cluster” instantly renders the physical nodes and communication paths.
-
Conversational Refactoring via AI Chatbot: If the initially generated layout needs to be modified, you can type direct commands to the Visual Paradigm AI Chatbot. You can say, “Move the authentication service out of the API gateway cluster” or “Add a rate-limiting load balancer in front of the application nodes,” and the AI will automatically re-render the infrastructure blocks and paths.
-
Hybrid Cloud & C4 Visualization: The AI engine understands context beyond standard UML shapes. It can effortlessly blend or pivot deployment concepts to produce C4 Model Container/Deployment views or native Elastic Cloud Architecture diagrams (e.g., AWS or Azure specific shapes) depending on your needs.
-
Ask Your Infrastructure: Once generated, the diagram acts as a knowledge asset. You can use the chat interface to ask questions like, “Where is the single point of failure in this cluster?” or “Explain how traffic routes from the client to the database,” and the AI will analyze the diagram to explain the network paths.
Core Technical UML Deployment Features
Once the AI sets up your physical topology, advanced CASE modeling tools let you define deep architectural properties:
-
Nodes and Execution Environments: Differentiate between physical hardware devices (e.g., specific app servers, IoT sensors) and software execution environments (e.g., Docker containers, JVMs, WebLogic servers).
-
Artifact Manifestation: Explicitly map which exact compiled software components or database schemas (artifacts like .jar, .war, or .exe files) are hosted inside which physical execution nodes.
-
Communication Paths & Protocols: Define physical connection lines with explicit networking attributes. You can document the specific protocols (e.g., HTTPS, TCP/IP, gRPC, JDBC) used across paths.
-
Nested Node Topologies: Model complex internal architectures by nesting execution environments inside hardware boundaries to clearly delineate security or hosting zones.
Enterprise Integration and the Downstream Pipeline
A major advantage of using AI-driven deployment planning is its continuity with enterprise engineering workflows:
-
Smooth Tool Promotion: You can rapidly sketch and iterate your infrastructure ideas using the quick web-based AI generator, and then instantly import the layout directly into professional desktop modeling environments for formal compliance checks and deep model-level mapping.
-
Model-Level Synchronization: Components and systems tracked in your Use Case, Component, or Sequence diagrams can be bound directly to the artifacts on your Deployment diagram, keeping the entire software blueprint synchronized.
-
Auto-Generated Infrastructure Documentation: You can instruct the AI to read your infrastructure diagram and automatically draft a Software Architecture Document (SAD), complete with node definitions, connection protocol tables, and security perimeter breakdowns.
Are you mapping out an on-premise corporate server network, a cloud-native AWS/Azure environment, or a distributed IoT edge network? Let me know, and I can give you a tailored AI prompt to get your deployment blueprint started!
Conclusion
UML Deployment Diagrams remain a foundational artifact in systems engineering, providing the critical link between abstract software design and tangible infrastructure reality. As system architectures grow increasingly complex—spanning cloud platforms, edge devices, microservices, and hybrid environments—the value of clear, maintainable deployment visualizations has never been higher.
The integration of AI-powered tooling transforms this discipline from a manual, error-prone exercise into an interactive, conversational design experience. By describing infrastructure requirements in natural language, teams can rapidly prototype deployment topologies, iterate on architectural decisions, and generate living documentation that evolves with the system. Whether modeling a simple client/server application or a globally distributed IoT ecosystem, the combination of UML semantics and AI assistance empowers architects to design with confidence, communicate with clarity, and deploy with precision.
As organizations continue to embrace digital transformation, the ability to visualize, validate, and version physical architecture will be a key differentiator. By adopting AI-enhanced deployment modeling practices, engineering teams can reduce time-to-market, improve system reliability, and build infrastructure that scales with business ambition.
References
- AI Deployment Diagram Generator in OpenDocs: Release notes and feature overview for generating deployment diagrams using AI within Visual Paradigm OpenDocs.
- AI Deployment Diagram: Online Learning Platform: Example walkthrough of generating a deployment diagram for an online learning platform using AI prompts.
- UML Deployment Diagram Handbook: Comprehensive guide to deployment diagram concepts, notation, and best practices in software design.
- AI Deployment Diagram: IoT Home Automation: Case example showing AI-generated deployment topology for an IoT-based home automation system.
- AI Radar Chart Generator: Product Comparison: Guide to using AI for generating comparative visualizations, including deployment architecture assessments.
- AI Deployment Diagram Generation in Visual Paradigm: Article exploring how AI accelerates deployment diagram creation and infrastructure planning workflows.
- AI Deployment Diagram: Online Ticketing System: Practical example of modeling a high-availability ticketing platform using conversational AI.
- AI Class Diagram Generator by Visual Paradigm: Resource on AI-powered class diagram generation, complementary to deployment modeling workflows.
- AI Diagram to OpenDocs Pipeline: Technical overview of exporting AI-generated diagrams into collaborative documentation environments.
- AI Deployment Diagram: Online Learning Platform (Duplicate): Additional example of AI-assisted deployment modeling for educational technology systems.
- Deployment Diagram for Microservices Architecture: Practical guide to modeling microservices deployments with UML and AI assistance.
- YouTube Tutorial: AI Deployment Diagrams: Video demonstration of creating deployment diagrams using Visual Paradigm’s AI features.
- Visual Paradigm AI Chatbot Features: Overview of conversational AI capabilities for diagram generation and system design assistance.
- AI Diagram Generation Features: Product page detailing AI-powered diagram creation across UML, C4, and cloud architecture types.
- Visual Paradigm AI Diagram Generator: Comprehensive Guide: Independent review and tutorial covering AI diagram generation workflows and use cases.
- AI Deployment Diagram: Real-Time Stock Trading Platform: High-performance system example demonstrating AI modeling of low-latency financial infrastructure.
- Visual Paradigm AI Chat Interface: Entry point to the conversational AI assistant for diagram generation and architecture planning.
- Visual Paradigm User Guide: Deployment Diagrams: Official documentation for creating and managing deployment diagrams in Visual Paradigm Desktop.
- AI Deployment Diagram: Online Auction Platform: Example of modeling scalable e-commerce infrastructure with AI assistance.
- UML Deployment Diagram Research Publication: Academic resource discussing theoretical foundations and applications of deployment diagrams in system modeling.
- Mastering AI-Powered UML Modeling: Comprehensive guide to leveraging generative AI tools for enterprise-grade UML modeling and architecture design.
- Hands-On Review: AI-Powered Deployment Diagram Generator: Practical evaluation of AI deployment diagram features within Visual Paradigm OpenDocs.
- How to Visualize System Infrastructure with AI: Step-by-step tutorial for using AI to create infrastructure visualizations from natural language descriptions.
- Visual Paradigm Official Website: Main product portal for Visual Paradigm’s suite of modeling, collaboration, and AI-powered design tools.
This post is also available in Deutsch, Español, فارسی, Français, English, Bahasa Indonesia, 日本語, Polski, Portuguese, Ру́сский, Việt Nam, 简体中文 and 繁體中文.