


Introduction to Visual Paradigm’s AI-Powered Value Stream Mapping Editor
In today’s fast-paced business environment, understanding and optimizing how value flows from suppliers to customers is essential for eliminating waste, reducing lead times, and boosting efficiency. Traditional Value Stream Mapping (VSM)—a cornerstone of Lean methodology—has long helped teams visualize material and information flows, spot bottlenecks, and identify non-value-adding activities. However, creating these maps manually often requires significant time, expertise, and iteration.
This tool merges classic Lean value stream mapping techniques with artificial intelligence to help users rapidly create, visualize, edit, analyze, and optimize business processes—uncovering waste, bottlenecks, and improvement opportunities in minutes rather than days.
1. Launching the Editor – Choose Your Starting Point
When you open the AI-Powered Value Stream Mapping Editor, you are greeted with a clean startup screen offering three main ways to begin your diagram.
- AI-Guided Flow Detection — Describe your process or challenge in natural language; the AI builds the map automatically.
- Industry Template — Select a ready-made template tailored to common industries or standard Lean scenarios (e.g., manufacturing, retail, logistics).
- Manual Creation — Pick an initial number of process blocks and build the diagram step-by-step yourself.
For most users—particularly when mapping real-world or unfamiliar processes—the AI-Guided Flow Detection option delivers the quickest and most insightful starting point.
2. Creating a Map with AI-Guided Flow Detection
Choose AI-Guided Flow Detection to harness the tool’s intelligence.
You will see a text box where you enter a detailed description of the process, problem, or scenario. The more specific you are, the better the result. Include:
- Key steps and sequence
- Roles, departments, or systems involved
- Handoffs, delays, inventory buildup, or tools used
- Known pain points, customer touchpoints, or goals
After entering your description, click Analyze with AI (or the equivalent button). The system processes your input, identifies activities, flows, wait times, value-adding vs. non-value-adding elements, and auto-generates a structured VSM.
3. Exploring the AI-Generated Value Stream Map
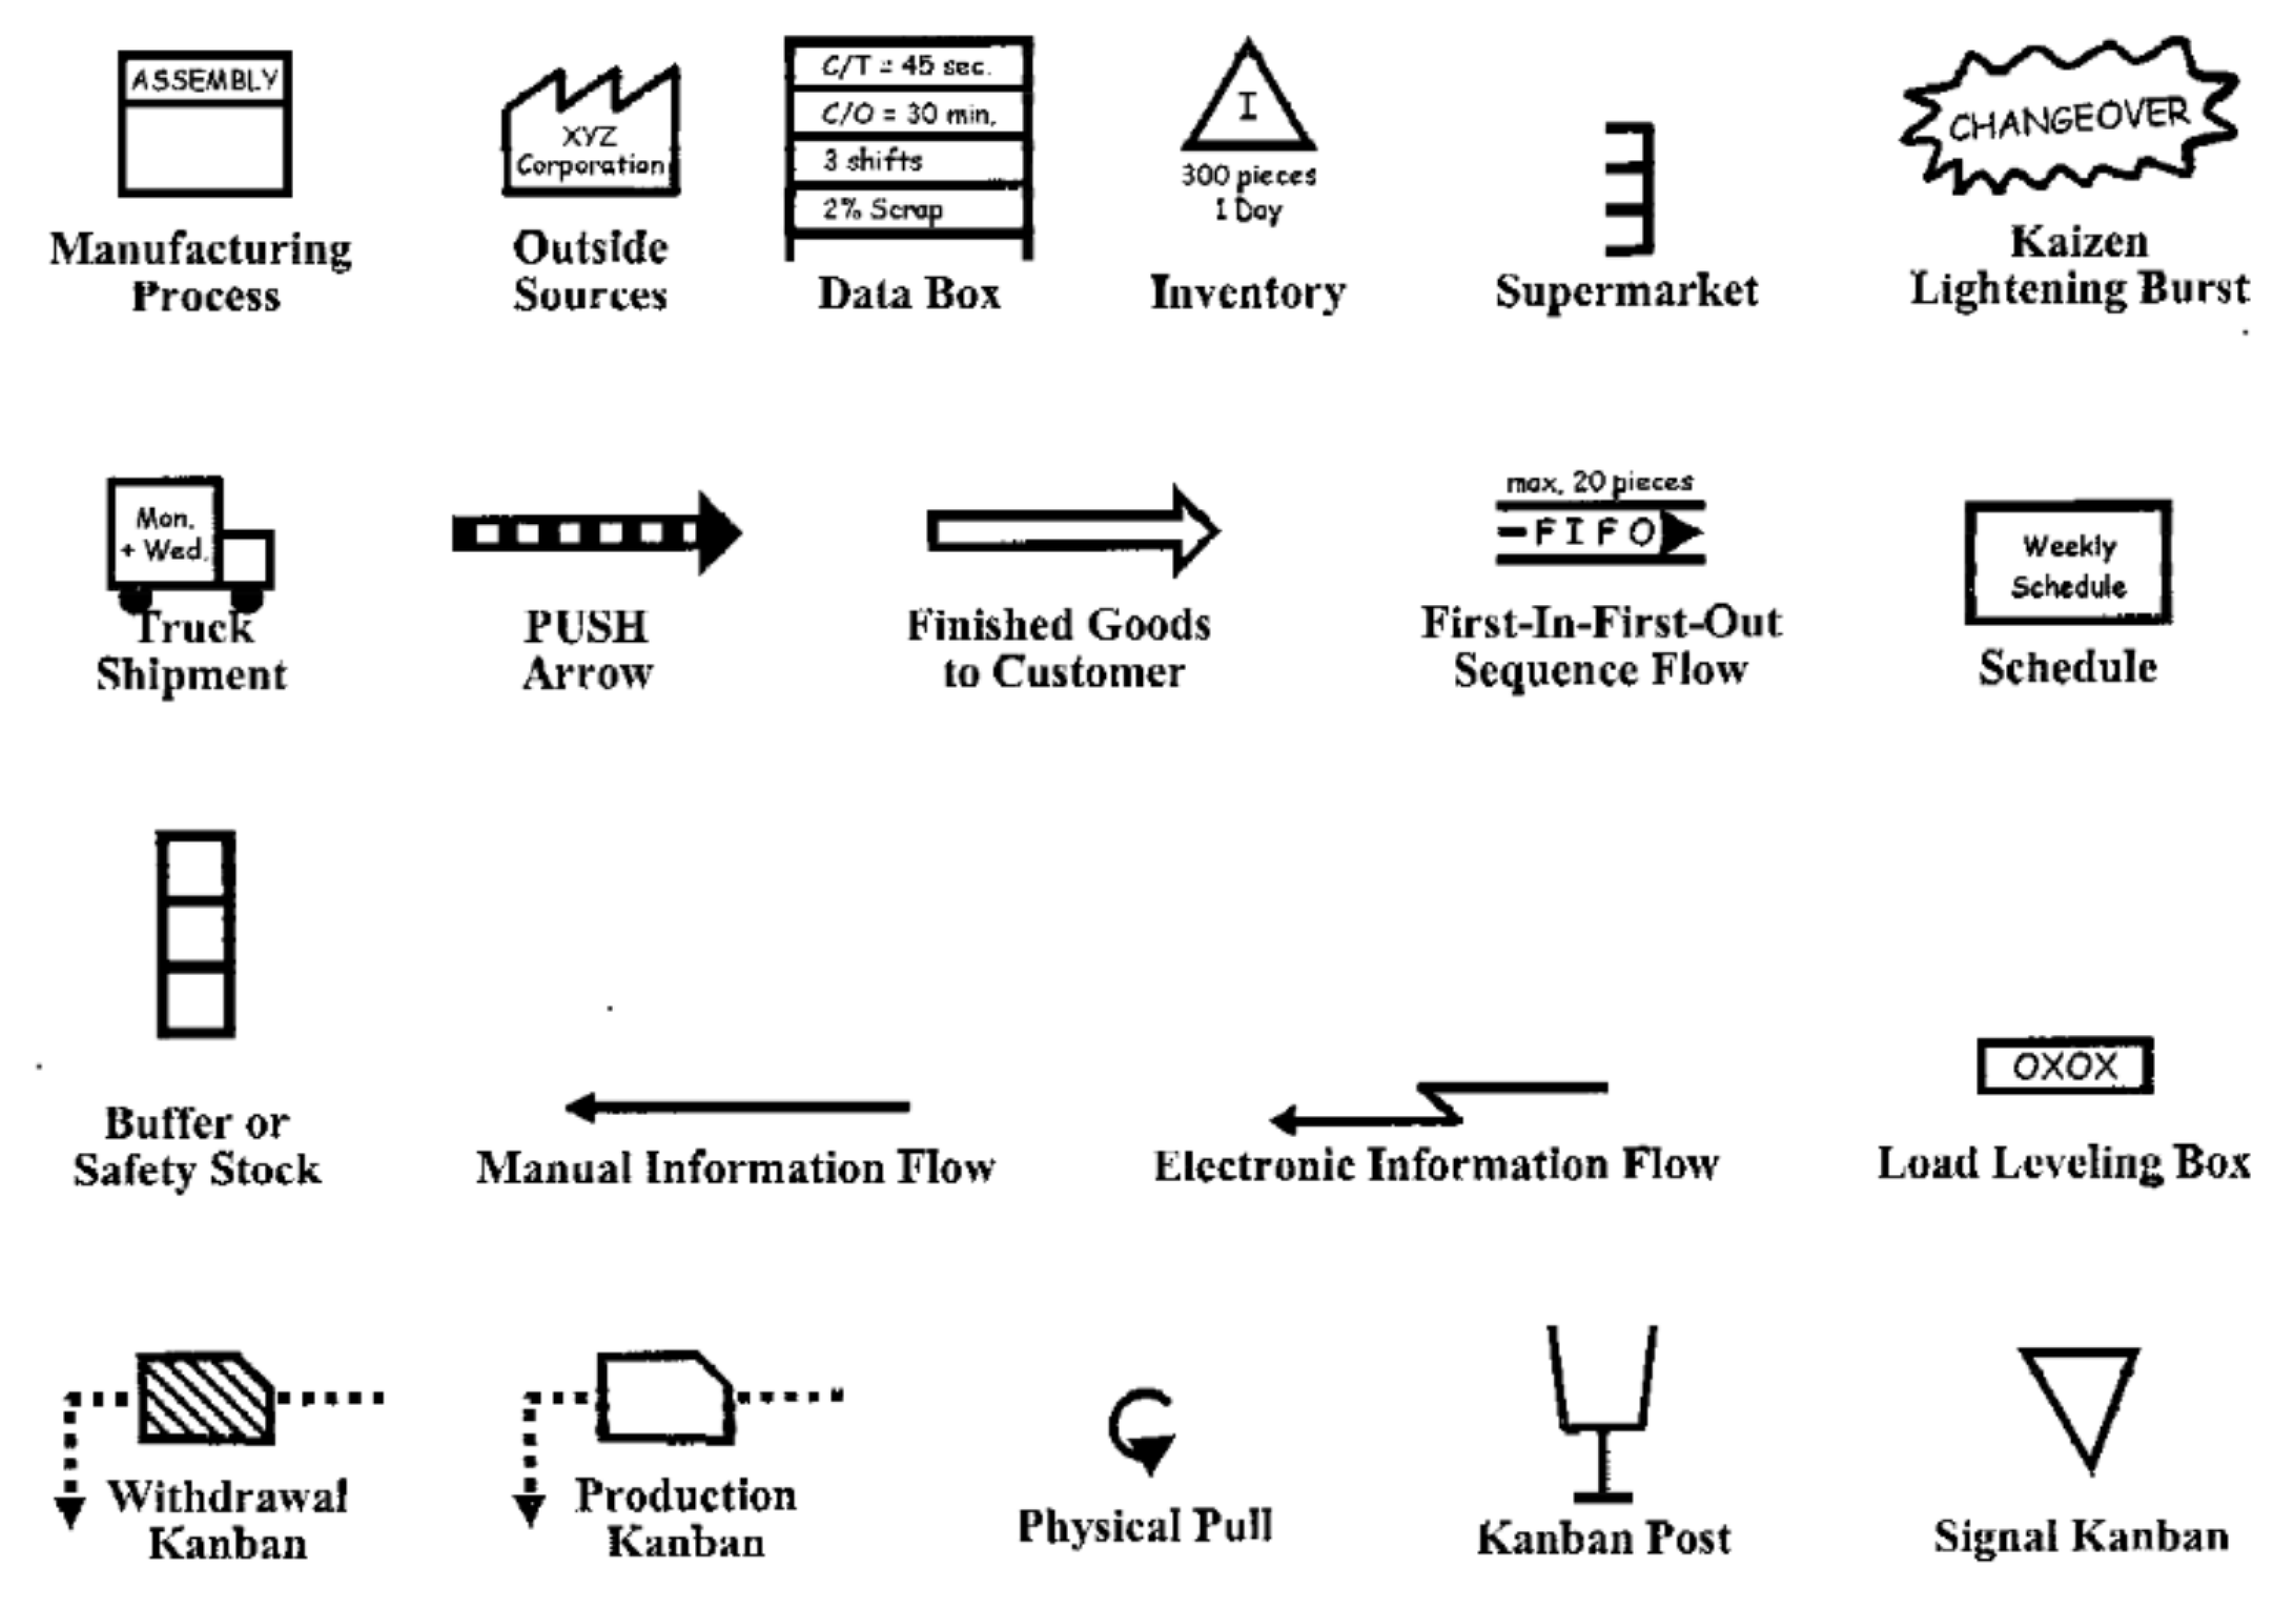
The result is a professional, fully formatted value stream map that follows standard Lean notation.
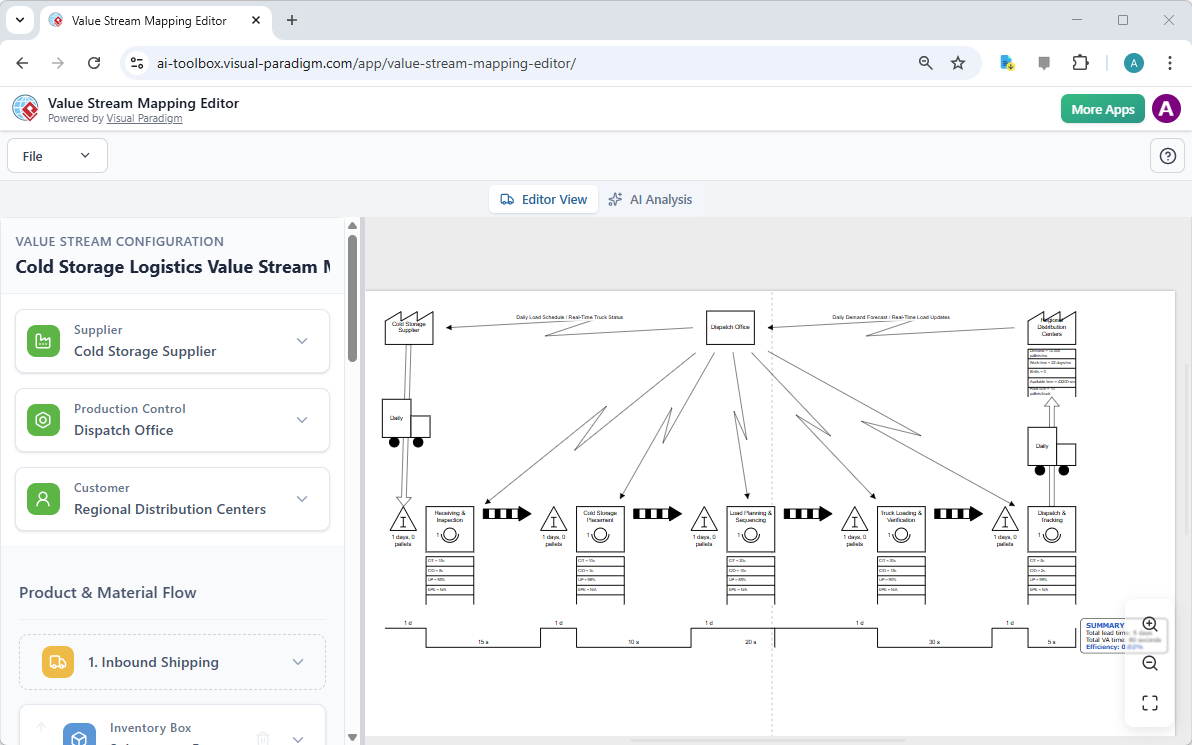
You will typically see:
- Supplier and customer icons at the start and end
- Process boxes with embedded data (cycle time, changeover time, staff, uptime %)
- Inventory/queue symbols showing wait times or quantities
- Material and information flows (push/pull arrows, electronic vs. manual)
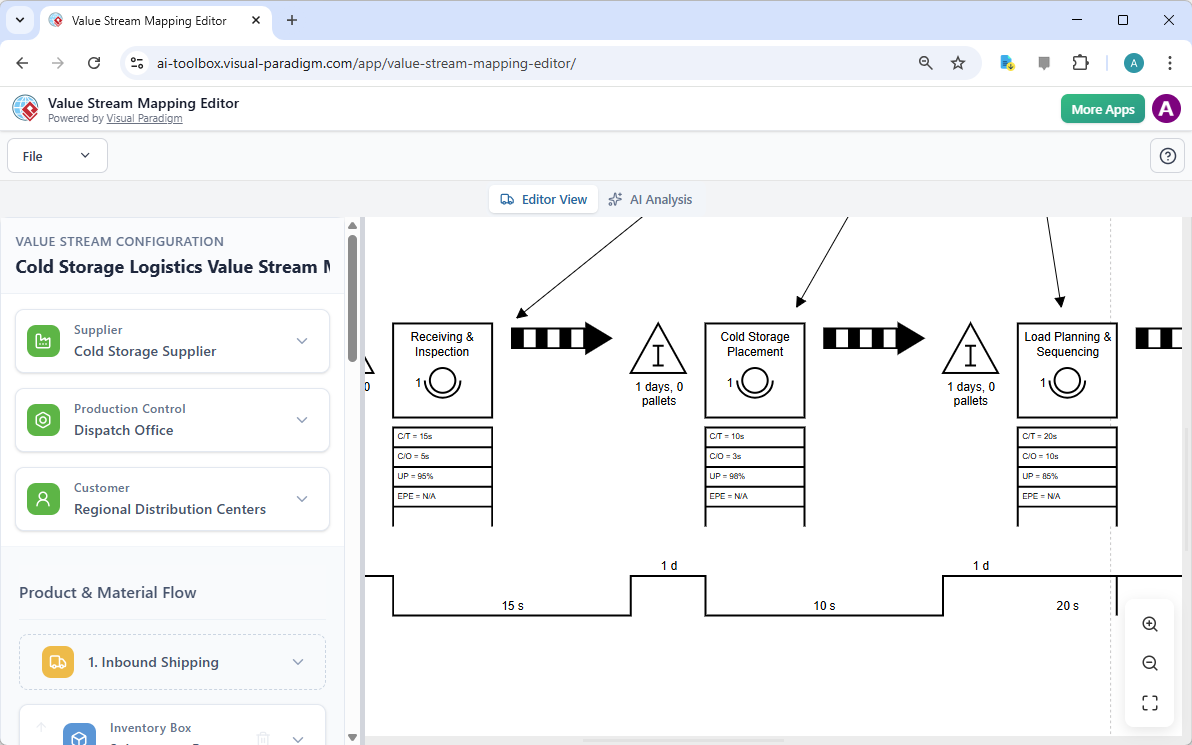
- A bottom timeline separating value-added time from total lead time
- Potential Kaizen (improvement) markers
Zooming in reveals crisp details on every element, making it easy to spot inefficiencies at a glance.
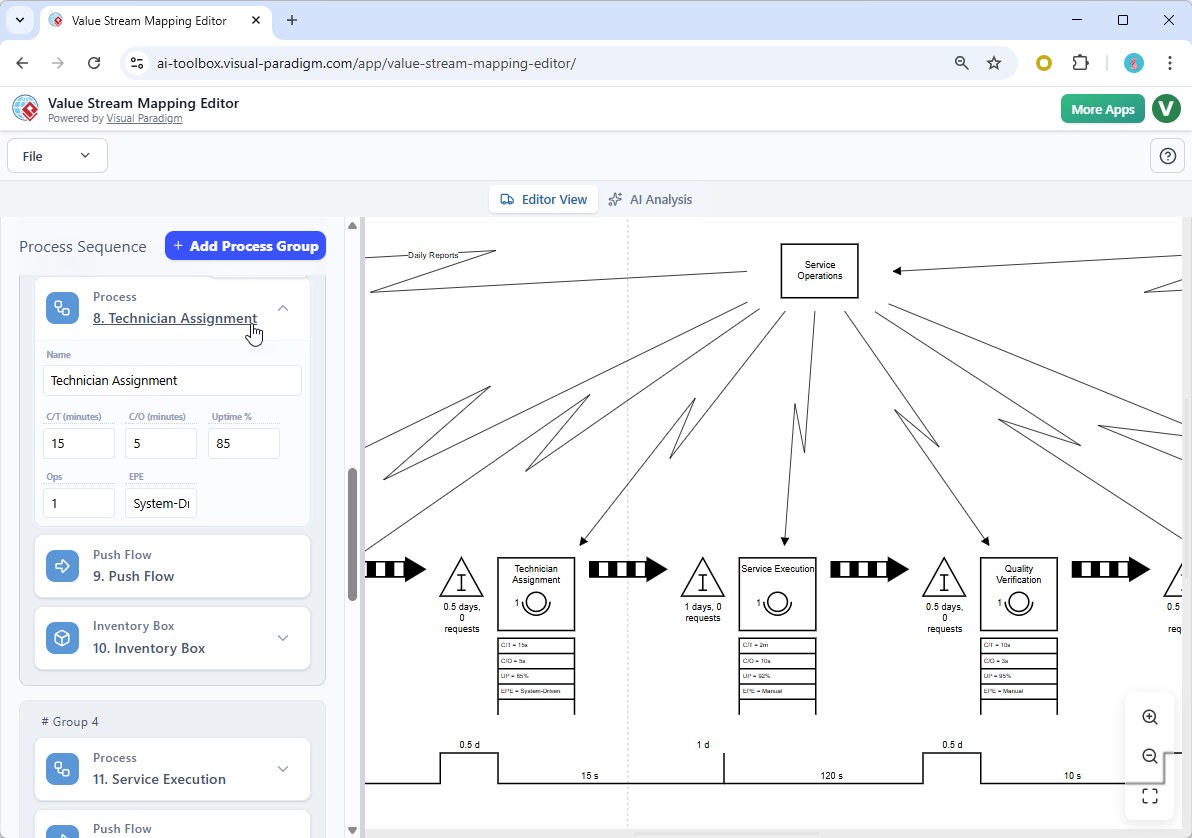
4. Editing and Customizing the Diagram
No generated map is perfect on the first try—refinement is straightforward.
A configuration pane usually appears on the left side of the screen. Select any element (process box, inventory triangle, connector, etc.) to:
- Edit names, metrics (cycle time, wait time, batch size, % complete/accurate)
- Add or remove steps and connections
- Insert Kaizen bursts for improvement ideas
- Adjust layout, alignment, or flow direction
- Use the symbol library for manual additions
This side-by-side setup (properties left, canvas right) supports fast, iterative updates based on real data or team feedback.
5. Performing AI-Powered Analysis
With your map finalized (or even in draft form), switch to the AI Analysis tab or view.
Here, the tool offers various analysis types, such as:
- Waste detection and quantification
- Bottleneck identification
- Value-added vs. non-value-added time breakdown
- Lead time and efficiency metrics
- Future-state suggestions
- Executive-level summaries
Select the desired report(s) and let the AI evaluate the diagram’s structure, timings, and logic to produce actionable insights.
6. Reviewing and Sharing AI-Generated Reports
The output is a polished, data-rich report tailored to different audiences.
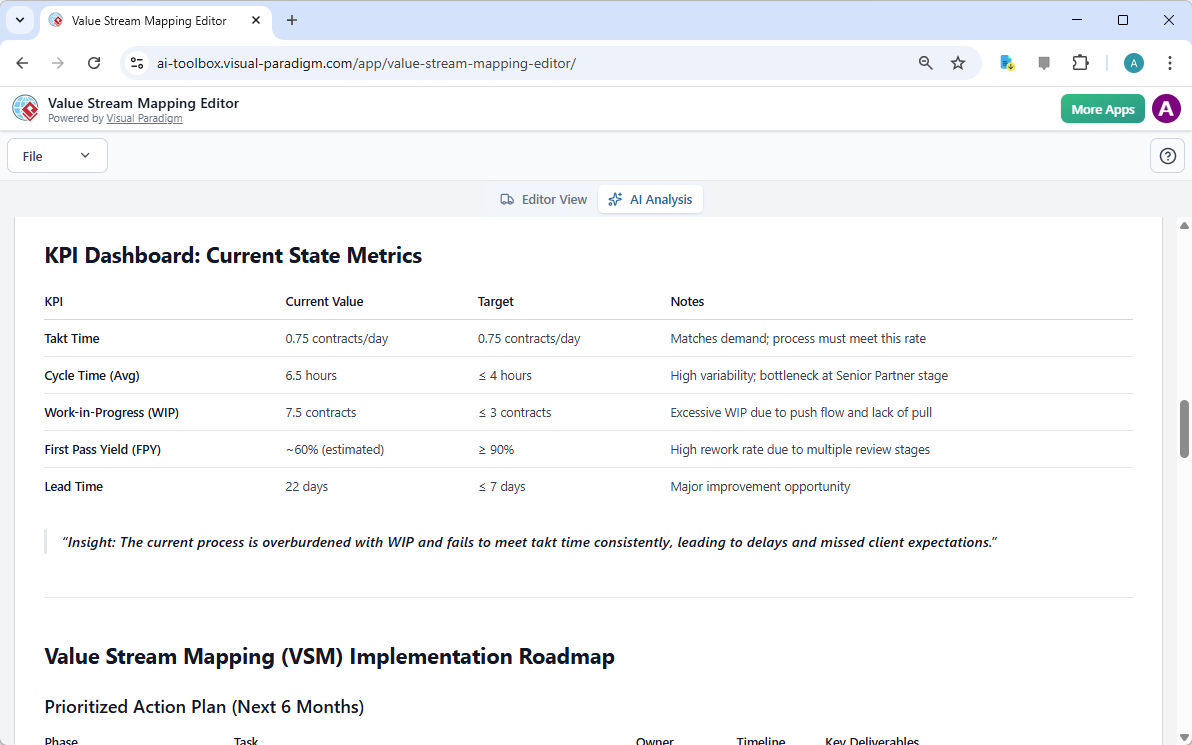
An Executive and Strategic report, for example, might include:
- High-level performance overview
- KPI dashboard (total lead time, process efficiency %, inventory levels, etc.)
- Visual charts (Pareto waste analysis, timeline summaries)
- Prioritized opportunities
- Strategic recommendations linked to business outcomes (cost savings, speed, quality)
Reports can be exported as PDF, images, or shared directly for team reviews, presentations, or continuous improvement initiatives.
Tips for Maximum Value
- Rich prompts win — Detailed, concrete descriptions in step 2 yield stronger initial maps.
- Validate & iterate — Use AI output as a smart draft; overlay actual measured data and refine manually.
- Hybrid workflow — Combine AI generation → manual tweaks → AI analysis → future-state planning.
- Leverage templates — Great for standard domains when you want consistency with Lean best practices.
- Focus on metrics early — Accurate cycle, wait, and changeover times unlock meaningful waste calculations and AI insights.
- Collaborate & export — Save versions, export visuals/reports, or integrate with other Visual Paradigm modeling tools.
This AI-enhanced editor dramatically shortens the traditional VSM workflow—from labor-intensive whiteboard sessions to rapid, intelligent mapping and analysis—empowering teams to move faster from current-state visibility to meaningful Lean improvements.
If you’re new to value stream mapping, pair this tool with core Lean concepts (the eight wastes, customer value focus, current vs. future state thinking) for even greater impact. Happy mapping!
-
AI-Powered Visual Modeling and Design Solutions by Visual Paradigm: AI-driven tools for visual modeling, diagramming, and software design that accelerate development workflows.
-
Visual Paradigm – All-in-One Visual Development Platform: A unified platform for visual modeling, software and business process design, and AI-powered development tools.
-
AI Chatbot Feature – Intelligent Assistance for Visual Paradigm Users: AI-powered chatbot that delivers instant guidance, automates tasks, and boosts productivity in Visual Paradigm.
-
Visual Paradigm Chat – AI-Powered Interactive Design Assistant: An interactive AI interface for generating diagrams, writing code, and solving design challenges in real time.
-
AI Textual Analysis – Transform Text into Visual Models Automatically: AI analyzes text documents to automatically generate UML, BPMN, and ERD diagrams for faster modeling and documentation.
-
Visual Paradigm AI Chatbot Enhances Multi-Language Support …: AI chatbot supports multiple languages, enabling seamless diagram generation in Spanish, French, Chinese, and more.
This post is also available in Deutsch, Español, فارسی, Français, English, Bahasa Indonesia, 日本語, Polski, Portuguese, Ру́сский, Việt Nam, 简体中文 and 繁體中文.