


Project management has long relied on traditional tools to visualize timelines, dependencies, and task flows. However, the manual creation of PERT charts—designed to model complex project schedules with probabilistic timing and critical path analysis—has remained a time-consuming, error-prone process. Enter Visual Paradigm’s AI PERT Chart Generator, a breakthrough in AI-driven project planning that transforms natural language project descriptions into professional, accurate, and dynamically editable PERT diagrams in seconds.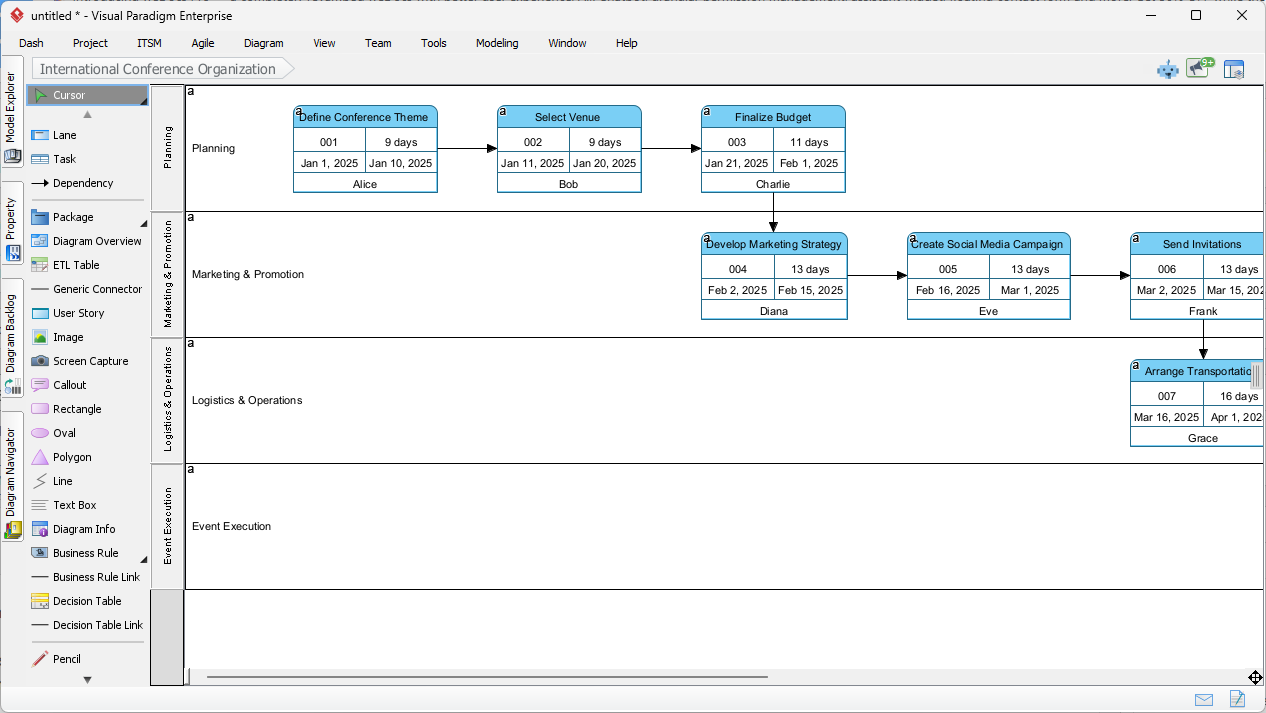
Why Traditional PERT Charts Fall Short
Classically, creating a PERT chart involves multiple sequential steps: defining activities and milestones, establishing precedence relationships, estimating durations using three-point estimates (optimistic, most likely, pessimistic), and performing forward and backward passes to determine the critical path. These steps are not only tedious but highly susceptible to human error—especially when projects scale in complexity.
For instance, organizing an international conference or launching a new software product requires managing interdependent tasks across phases such as planning, vendor coordination, speaker booking, marketing, logistics, and execution. A single misstep in dependency logic or duration estimation can cascade into schedule drift, resource overprovisioning, or missed deadlines.
How the AI PERT Chart Generator Works
Visual Paradigm’s AI-powered PERT toolleverages large language models trained on structured project management data to interpret unstructured natural language inputs and generate a fully compliant PERT diagram with logical integrity and technical accuracy.
Two Access Paths: Desktop and Online
- Visual Paradigm Desktop (Enterprise Edition)
The desktop application provides full access to the AI Diagram Generation suite. Users begin by entering a detailed, context-rich prompt describing the project lifecycle, including key tasks, dependencies, durations, and resources. For example:
“Plan a global tech conference: Begin with venue selection and budgeting. After finalizing the budget, secure speakers; marketing begins only after speaker confirmation. Include three-point estimates for venue logistics and travel arrangements. Assign Alice for budgeting, Bob for vendor coordination.” - The AI parses this input and constructs a PERT chart with clearly defined nodes, activity arrows, swimlanes, and task assignments. It automatically infers logical sequences and dependencies, ensuring that no task appears before its prerequisites are satisfied.
- Visual Paradigm Online AI Chatbot
Accessible via chat.visual-paradigm.com, this no-install, browser-based interface enables real-time brainstorming and quick prototyping. Users can describe their project in conversational language, and the AI generates a PERT chart instantly—often accompanied by a structured representation (e.g., PlantUML code) for transparency and reuse. Ideal for agile teams, remote meetings, or stakeholders unfamiliar with formal modeling tools.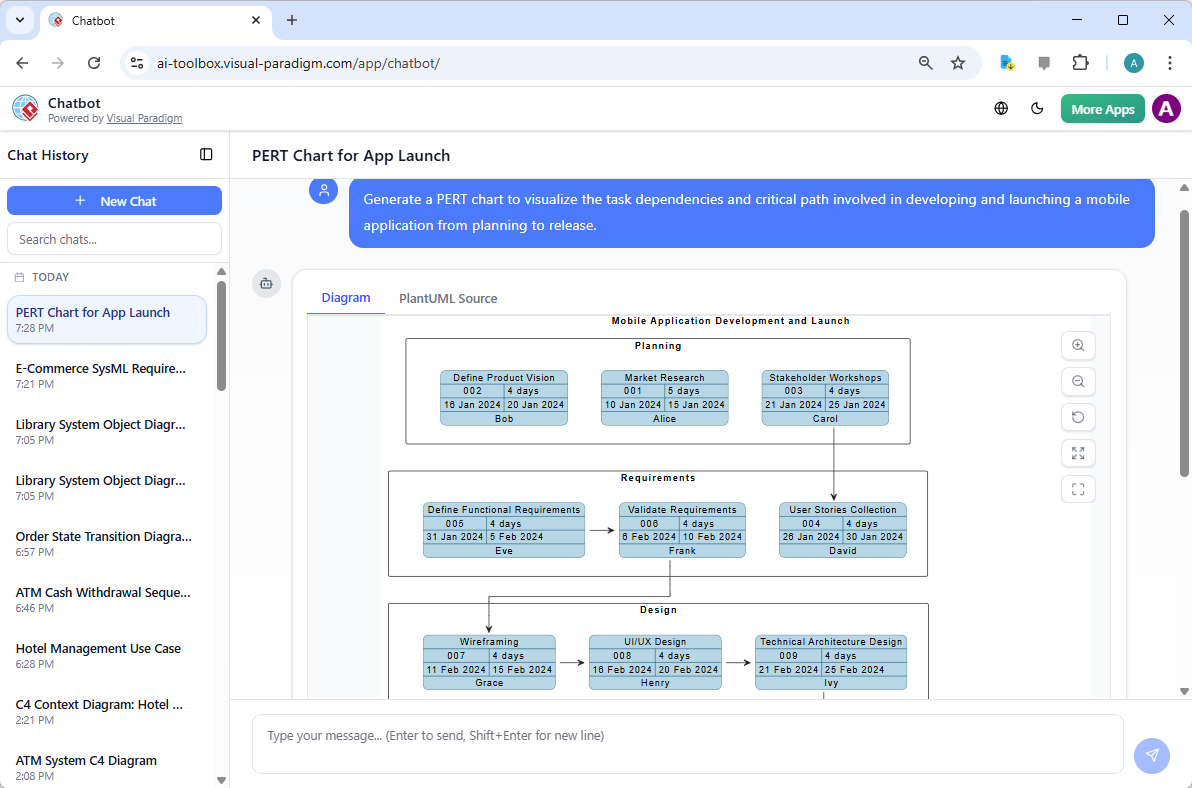
Key Elements Automatically Generated
| Element | Description |
|---|---|
| Swimlanes | Organizes tasks by phase (e.g., Planning, Marketing, Logistics, Execution) to improve readability and team accountability. |
| Task Nodes & Durations | Each activity is represented with a labeled node, including task ID, estimated duration, and duration type (e.g., 45 days, 3-point estimate). |
| Dependency Arrows | Arrows indicate precedence relationships (e.g., “Marketing starts after Speakers Are Confirmed”), enforcing logical sequence. |
| Resource Assignments | Names or roles are assigned to tasks (e.g., “Alice: Budgeting”) to support team coordination and responsibility tracking. |
Advanced Capabilities Beyond Visualization
Visual Paradigm’s AI does not stop at creating a diagram—it builds a fully analytical project model. The generated PERT chart functions as an intelligent scheduling engine with these advanced features:
- Automatic Critical Path Detection
Using the Critical Path Method (CPM), the AI computes the longest path through the network and highlights tasks with zero float. This identifies the sequence of activities that, if delayed, will directly impact the project completion date. - Probabilistic Scheduling with PERT Formulas
The tool supports the classic PERT formula:
TE = (O + 4×ML + P) / 6
Where O = optimistic, ML = most likely, P = pessimistic. This enables risk-aware planning by accounting for uncertainty in task durations. - Forward and Backward Pass Calculations
The AI performs internal calculations to determine early and late start/finish times for each activity, enabling float detection and non-critical path identification. - What-If Scenario Analysis
Users can modify the natural language prompt to simulate risk scenarios—for example, increasing the pessimistic estimate for a high-uncertainty task like supply chain management. The tool regenerates the chart instantly, showing how schedule durations and critical paths shift under different assumptions. - Seamless Format Conversion
Generated PERT charts can be exported or converted into Gantt views, resource histograms, or timeline reports, enabling cross-functional use in agile, waterfall, or hybrid project environments. - Standards Compliance
The output adheres to industry-standard PERT notation (e.g., event nodes, activity-on-arrow), making it suitable for formal documentation, audit trails, and presentation to stakeholders including PMP-certified project managers and governance boards.
Real-World Use Cases and Workflows
Workflow 1: Rapid Concept-to-Plan Transition
- Open the AI Diagram Generator in Visual Paradigm Desktop.
- Input a project narrative describing the key activities and dependencies.
- Generate and review the AI-built PERT chart in real time.
- Refine the chart—adjust durations, modify dependencies, or add new milestones—before saving to the project repository.
Perfect for early-stage project scoping or agile sprints where teams need quick visual alignment.
Workflow 2: Risk Modeling & Scenario Planning
- Build a baseline PERT chart using realistic three-point estimates.
- Create variant scenarios with pessimistic values for uncertain tasks (e.g., logistics, procurement).
- Compare total project durations and identify new critical paths.
- Use the findings to inform risk mitigation strategies or contingency planning.
Particularly useful in high-risk environments like global product launches or international event planning where external factors can significantly affect timelines.
Key Advantages for Project Teams
- Accelerated Planning: Up to 80% of the diagramming and structural work is automated, freeing teams to focus on strategic decisions, risk assessment, and stakeholder communication.
- Improved Accuracy: Eliminates common human errors in manual dependency mapping and duration estimation.
- Enhanced Accessibility: Teams with no prior diagramming experience can generate professional PERT charts through simple prompts.
- Team Collaboration: Charts are saved in Visual Paradigm repositories, enabling multi-user editing, version control, and real-time feedback.
- Strategic Insight: The critical path and float analysis provide concrete data for prioritization, resource allocation, and timeline optimization.
Getting Started: A Step-by-Step Guide
Begin your journey with one of these accessible entry points:
- Download the Full Desktop Edition from Visual Paradigm’s official download page. This includes full AI Diagram Generation capabilities, task management, and integration with other modeling tools.
- Try the Online AI Chatbot at chat.visual-paradigm.com. No installation required. Ideal for quick prototyping, idea validation, or on-the-fly decisions during meetings.
- Explore Tutorials and Templates in the Visual Paradigm Help Center. Pre-built templates for event planning, software launches, and construction projects can accelerate onboarding.
Conclusion: The Future of AI-Enhanced Project Management
Visual Paradigm’s AI PERT Chart Generator is not just a tool—it’s a paradigm shift. By merging generative AI with the rigor of PERT methodology, it enables project managers and technical teams to transform abstract project narratives into actionable, data-driven timelines. This innovation reduces planning friction, enhances strategic clarity, and improves team agility in dynamic environments.
Whether you’re managing a high-stakes international conference or leading the development of a next-generation software product, this tool empowers you to plan smarter, respond faster, and deliver with confidence—ushering in a new era of intelligent project management.
Articles and resources related to Visual Paradigm’s AI capabilities and PERT Chart tools for project management:
-
Pert Chart Tool – Visual Paradigm Online: A powerful online tool designed to help project managers visualize task dependencies, estimate timelines, and manage project schedules effectively.
-
Complete PERT Chart Tutorial – Visual Paradigm: A step-by-step tutorial guiding users through creating and using PERT charts in the cloud to plan and manage complex projects efficiently.
-
Pert Chart User Guide – Visual Paradigm: Detailed documentation covering how to create, edit, and utilize PERT charts within the desktop software for robust project management.
-
Free PERT Chart Templates – Visual Paradigm: Access a collection of professionally designed templates to kickstart project planning with minimal setup.
-
Pert Chart Tutorial – Visual Paradigm Knowledge Base: An in-depth resource explaining the purpose, construction, and application of PERT charts in real-world project management scenarios.
-
Enhanced PERT Chart Features – Visual Paradigm: Explore advanced capabilities such as dynamic scheduling, critical path analysis, and seamless integration with project timelines.
-
Project Management Guide – Visual Paradigm User Guide: A comprehensive guide to the platform’s project management suite, including PERT charts, Gantt charts, and resource allocation tools.
-
Pert Chart for Project Management – Cybermedian: This article provides practical insights and real-world online examples for using PERT charts to improve project planning.
-
Integrating PERT Charts with RACI Roles in Task Management: A practical guide on combining PERT charts with RACI roles to enhance timeline accuracy and accountability in management workflows.
-
Visual Paradigm AI Suite: A Comprehensive Guide: This overview details how the platform’s AI Chatbot supports the generation of business diagrams, explicitly including PERT charts, within the modeling environment.
This post is also available in Deutsch, Español, فارسی, Français, English, Bahasa Indonesia, 日本語, Polski, Portuguese, Ру́сский, Việt Nam, 简体中文 and 繁體中文.