


The Unified Modeling Language (UML) is a modeling language that can be used for any purpose. The primary goal of UML is to establish a standard for visualizing the design of a system. It looks a lot like designs in other branches of engineering.
UML is a visual language rather than a programming language. UML diagrams are used to depict a system’s behavior and structure. UML is a modeling, design, and analysis tool for software engineers, businesspeople, and system architects. Unified Modelling Language was approved as a standard by the Object Management Group (OMG) in 1997. Since then, OMG has been in charge of it. In 2005, the International Organization for Standardization (ISO) accepted UML as a standard. UML has been updated throughout time and is examined on a regular basis.
What is UML?
The Unified Modeling Language (UML) was developed to establish a common visual modeling language for the architecture, design, and implementation of large software systems’ structure and behavior. UML has applications outside of software development, such as industrial processes.
It consists of many types of diagrams and is similar to blueprints used in other domains. UML diagrams, in general, depict the boundaries, structure, and behavior of a system, as well as the objects contained within it.
Although UML is not a programming language, there exist tools that produce code in multiple languages using UML diagrams.
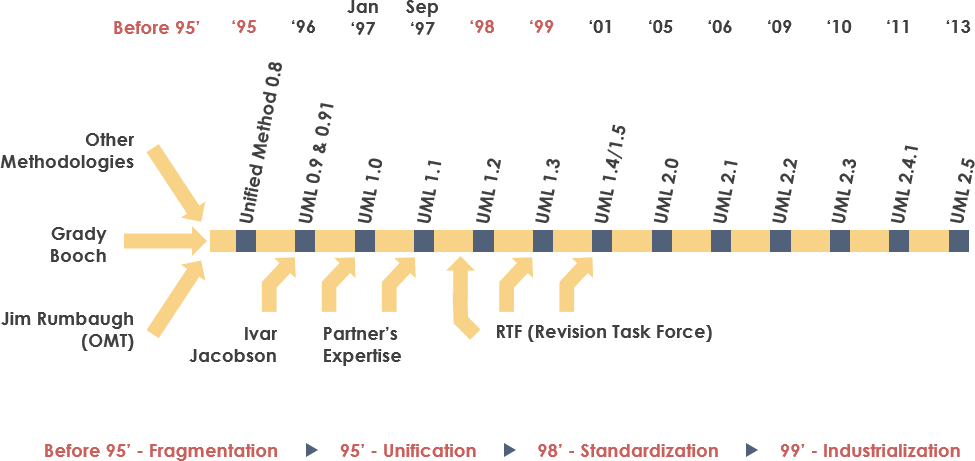
History of UML
The UML arose from the bafflement that surrounded software development and documentation. There were a variety of techniques to represent and document software systems throughout the 1990s. As a result, three Rational Software software developers created the UML in 1994-1996. It was later recognized as a standard in 1997, and it has stayed so since then, with very minor revisions.
Is UML really necessary?
- Complex applications necessitate the collaboration and planning of various teams, which necessitates a clear and straightforward means of communication between them.
- Code is not understood by business people. As a result, UML becomes essential for non-programmers to understand the system’s basic requirements, functionality, and operations.
- When teams can visualize processes, user interactions, and the system’s static structure, they can save a lot of time.
Object-oriented design and analysis are linked to UML. To create diagrams, UML takes items and creates associations between them. The following are some examples of UML diagrams.
- A structural diagram depicts a system’s static characteristics or structure. Diagrams of structure are shown. Component diagrams, Object diagrams, Class diagrams, and Deployment diagrams are all examples of diagrams used in software development.
- A behavior diagram depicts a system’s dynamic features or behavior. Diagrams of behavior are included. Use case diagrams, state diagrams, activity diagrams, and interaction diagrams to help you visualize your ideas.
The schematic hierarchy according to UML is shown in the figure below.

Key Object-Oriented Concepts in UML
Object-oriented (OO) analysis and design have been superseded by UML.
An object is made up of data and methods that control it. The data represents the object’s current status. A class is a type of object that has a hierarchy that can be used to mimic real-world systems. The hierarchy is expressed by inheritance, and classes can be linked in a variety of ways depending on the needs.
Objects are real-world entities that exist all around us, and UML may represent basic principles like abstraction, encapsulation, inheritance, and polymorphism.
UML is capable of representing all of the concepts found in object-oriented analysis and design.
Only object-oriented notions are represented in UML diagrams. As a result, prior to learning UML, it is critical to have a thorough understanding of OO concepts.
- Class: A class defines the blueprint, i.e. the structure and functioning of an object, and is used in UML.
- Objects: Objects assist us in breaking down and modularizing complex systems. Modularity allows us to break down our system into easily understandable components, allowing us to create it piece by piece. The basic units (building blocks) of a system are objects, which are used to describe an entity.
- Inheritance: a mechanism that allows a child class to inherit the properties of its parent class.
- Abstraction: a method that shields the user from implementation specifics.
- Encapsulation: the process of putting data together and protecting it from the outside world.
- Polymorphism: a method that allows a function or entity to exist in several versions.
Additions in UML:
- The scope of the original UML definition has been increased, and software development approaches such as Agile have been added.
- Initially, UML called for nine diagrams. The number of diagrams in UML 2.x rose from 9 to 13. Timing diagram, Communication diagram, Interaction overview diagram, and Composite structure diagram are the four new diagrams. The state diagram was renamed to State machine diagram in UML 2.x.
- Software systems can now be decomposed into components and subcomponents using UML 2.x.
UML structural diagrams
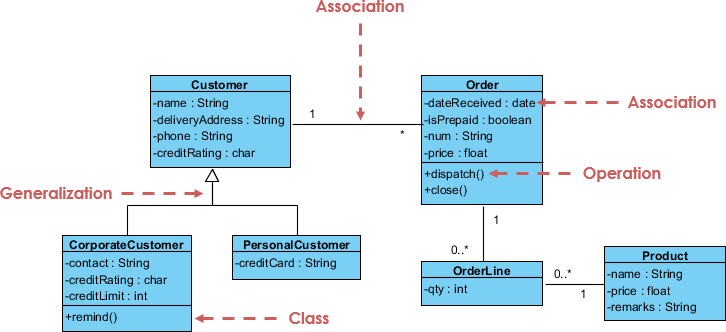
Class Diagram – The class diagram is the most extensively used UML diagram. It serves as the foundation for all object-oriented software systems. Class diagrams are used to depict a system’s static structure by displaying its classes, methods, and properties. Class diagrams also assist us in determining the links among various classes or objects.
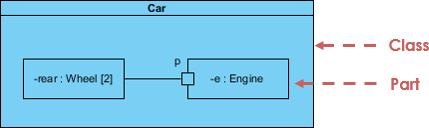
Composite Structure Diagram – Composite structure diagrams are used to illustrate a class’s internal structure as well as its points of interaction with other components of the system. The link between pieces and their configuration determines how the classifier (class, component, or deployment node) behaves. Parts, ports, and connections are used to illustrate the internal structure of a structured classifier. We can also use composite structure diagrams to model cooperation. They’re similar to class diagrams, but instead of representing the full class, they display particular elements in depth.
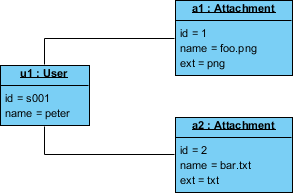
Object Diagram – An object graph can be referred to as a screenshot of the instances in a system and the relationships that exist between them. Since object diagrams describe the behavior of an object after it has been instantiated, we are able to study the behavior of the system at a particular moment in time. An object diagram is similar to a class diagram, except that it shows instances of classes in the system. We describe the actual classifiers and their relationships by using class diagrams. On the other hand, object graphs represent specific instances of classes and the relationships between them at a point in time.
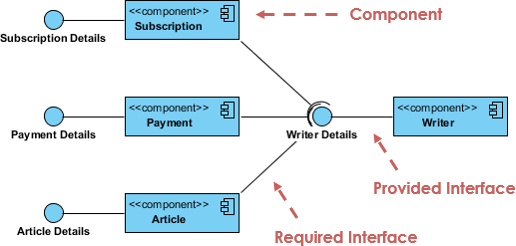
Component Diagram – Component diagrams are used to show how a system’s physical components are connected. They’re used to simulate implementation details. Component diagrams show the structural relationships between the pieces of a software system and can help us figure out if the planned development has met all of the functional requirements. When designing and building complicated systems, component diagrams are essential. The many components of the system communicate with one another through interfaces.
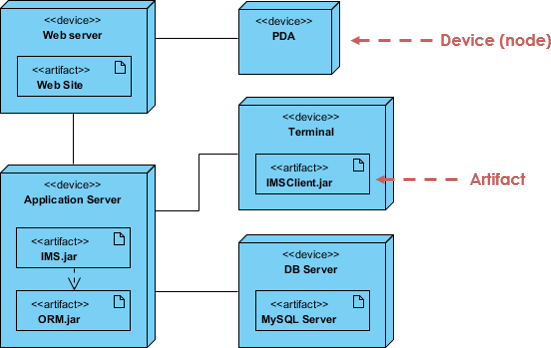
Deployment Diagram – A deployment diagram is a diagram that depicts the hardware and software of a system. It informs us of the hardware components that are there as well as the software components that are executing on them. The information generated by the system software is referred to as artifacts. They’re most commonly utilized when software is used, distributed, or deployed on numerous devices with various configurations.
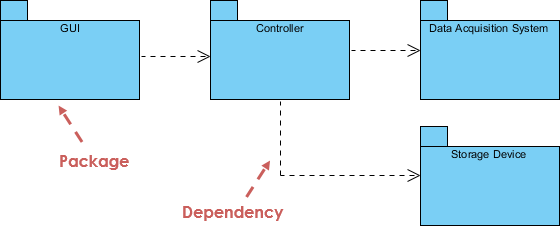
Package Diagram – Package diagrams are used to show how packages and their components are arranged. Package diagrams simply depict the interdependencies of distinct packages as well as the internal structure of packages. Packages aid in the organization of UML diagrams into meaningful groups and the comprehension of the diagrams. They’re mostly used to keep class diagrams and use case diagrams organized.
UML behavior diagrams
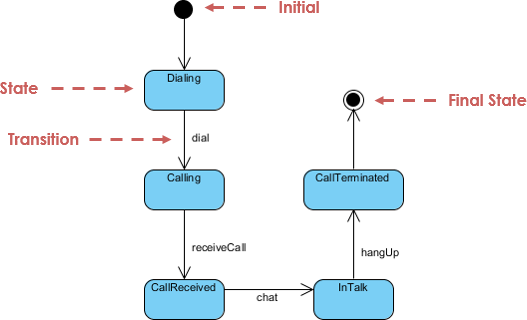
State Machine Diagram – used to portray the status of a system or a section of a system at a specific point in time. It’s a behavior diagram in which behavior is represented by a finite number of state transitions. State machines and state diagrams are other names for state diagrams. These terms are frequently interchanged. Simply described, a state diagram is a visual representation of a class’s dynamic behavior in reaction to time and changing external inputs.
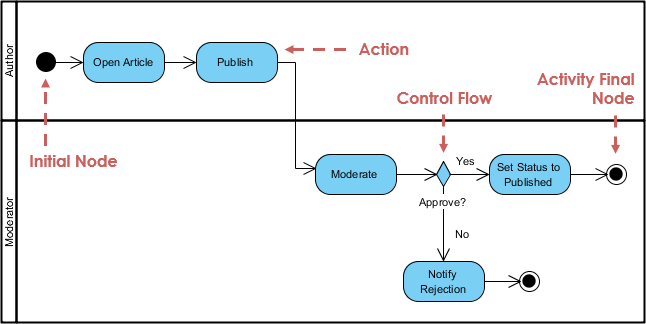
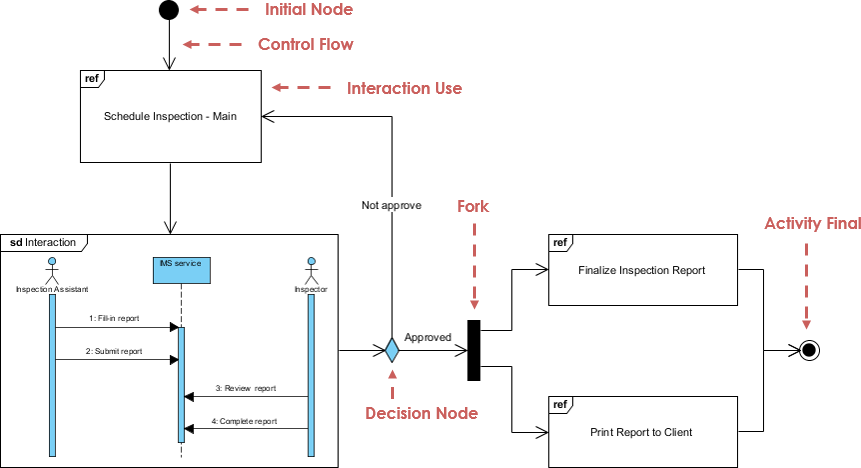
Activity Diagram – We use activity diagrams to show how a system’s control flow works. Activity diagrams can also be used to refer to the stages involved in executing a use case. Activity diagrams are used to represent sequential and concurrent activities. As a result, activity diagrams are used to visually depict the workflow. The circumstances of flow and the order in which they occur are the focus of activity diagrams. Activity diagrams are used to represent or describe the events that lead up to a specific event.
Use Case Diagram are used to describe the functionality of a system or a component of a system. They’re frequently utilized to depict a system’s functional requirements and interactions with external agents (actors). A use case is a diagram that depicts the various contexts in which a system can be applied. Use case diagrams provide us a high-level overview of what a system or element of a system performs without diving into the nitty-gritty of implementation.

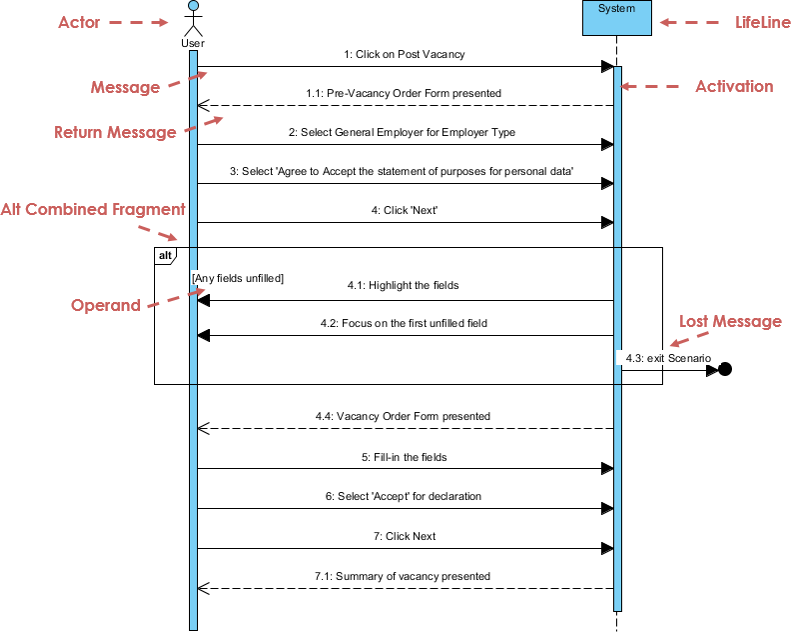
Sequence Diagram simply depicts the interactions between items in a series, i.e. the order in which these interactions take place. A sequence diagram can also be referred to as an event diagram or an event scenario. Sequence diagrams show how and in what order the components of a system work together. Businesspeople and software engineers frequently use these diagrams to document and understand the needs of new and current systems.
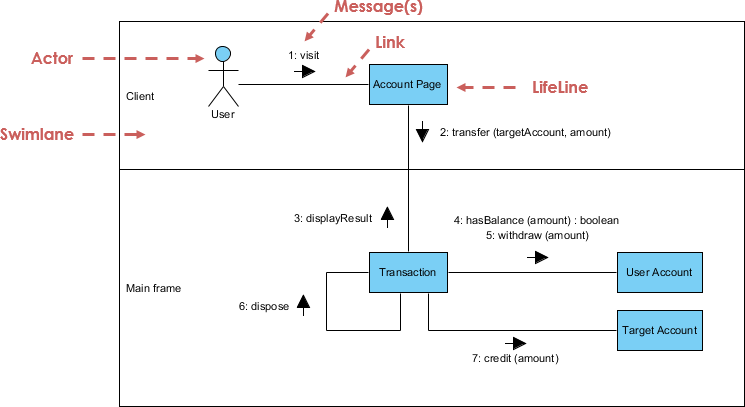
Communication Diagram (also known as collaboration diagrams in UML 1.x) are used to depict the sequential transmission of information between objects. Objects and their relationships are the focus of communication diagrams. Sequence diagrams can be used to describe similar information, but communication diagrams represent objects and linkages in their natural state.
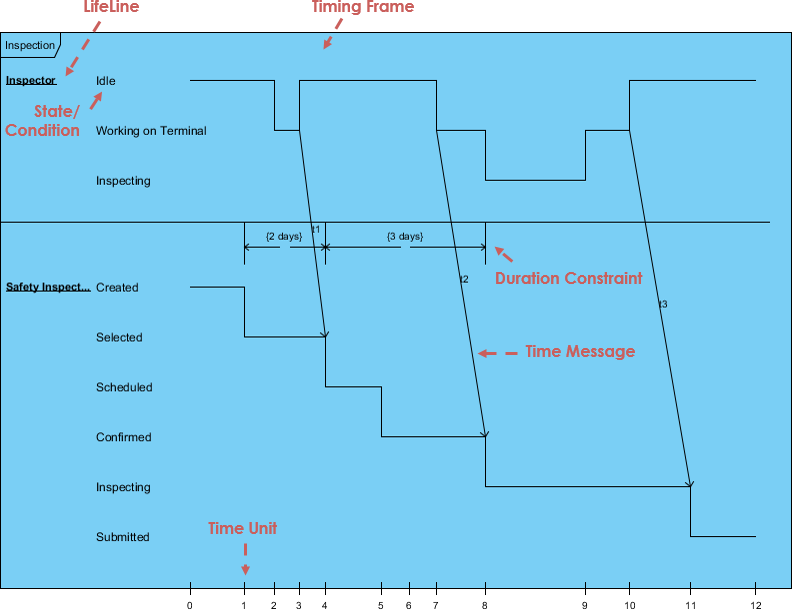
Timing Diagram – Timing diagrams are a type of sequence diagram that depicts the behavior of objects over a set period of time. They are used to depict the time and duration constraints that govern changes in an object’s state and behavior.
Interaction Overview Diagrams – An interaction overview diagram is a model of a series of events that may be used to break down complex interactions into simpler events. It’s a cross between an activity and a sequence diagram.
UML Glossary
- Abstract Class – A class that will never be instantiated. An instance of this class will never exist.
- Actor – An object or person that initiates events the system is involved with.
- Activity: A step or action within an Activity Diagram. Represents an action taken by the system or by an Actor.
- Activity Diagram: A glorified flowchart that shows the steps and decisions and parallel operations within a process, such as an algorithm or a business process.
- Aggregation – Is a part of another class. Shown with a hollow diamond next to the containing class in diagrams.
- Artifacts – Documents describing the output of a step in the design process. The description is graphic, textual, or some combination.
- Association – A connection between two elements of a Model. This might represent a member variable in code, or the association between a personnel record and the person it represents, or a relation between two categories of workers, or any similar relationship. By default, both elements in an Association are equal, and are aware of each other through the Association. An Association can also be a Navigable Association, meaning that the source end of the association is aware of the target end, but not vice versa.
- Association Class: A Class that represents and adds information to the Association between two other Classes.
- Attributes – Characteristics of an object which may be used to reference other objects or save object state information.
- Base Class: A Class which defines Attributes and Operations that are inherited by a Subclass via a Generalization relationship.
- Branch: A decision point in an Activity Diagram. Multiple Transitions emerge from the Branch, each with a Guard Condition. When control reaches the Branch, exactly one Guard Condition must be true; and control follows the corresponding Transition.
- Class: A category of similar Objects, all described by the same Attributes and Operations and all assignment-compatible.
- Class Diagram – Shows the system classes and relationships between them.
- Classifier: A UML element that has Attributes and Operations. Specifically, Actors, Classes, and Interfaces.
- Collaboration: A relation between two Objects in a Communication Diagram, indicating that Messages can pass back and forth between the Objects.
- Communication Diagram – A diagram that shows how operations are done while emphasizing the roles of objects.
- Component: A deployable unit of code within the system.
- Component Diagram: A diagram that shows relations between various Components and Interfaces.
- Concept – A noun or abstract idea to be included in a domain model.
- Construction Phase – The third phase of the Rational Unified Process during which several iterations of functionality are built into the system under construction. This is where the main work is done.
- Dependence: A relationship that indicates one Classifier knows the Attributes and Operations of another Classifier, but isn’t directly connected to any instance of the second Classifier.
- Deployment Diagram: A diagram that shows relations between various Processors.
- Domain -The part of the universe that the system is involved with.
- Elaboration Phase – The second phase of the Rational Unified Process that allows for additional project planning including the iterations of the construction phase.
- Element: Any item that appears in a Model.
- Encapsulation – Data in objects is private.
- Generalization – Indicates that one class is a subclass on another class (superclass). A hollow arrow points to the superclass.
- Event: In a State Diagram, this represents a signal or event or input that causes the system to take an action or switch States.
- Final State: In a State Diagram or an Activity Diagram, this indicates a point at which the diagram completes.
- Fork: A point in an Activity Diagram where multiple parallel control threads begin.
- Generalization: An inheritance relationship, in which a Subclass inherits and adds to the Attributes and Operations of a Base Class.
- GoF – Gang of Four set of design patterns.
- High Cohesion – A GRASP evaluative pattern which makes sure the class is not too complex, doing unrelated functions.
- Low Coupling – A GRASP evaluative pattern which measures how much one class relies on another class or is connected to another class.
- Inception Phase – The first phase of the Rational Unified Process that deals with the original conceptualization and beginning of the project.
- Inheritance – Subclasses inherit the attributes or characterics of their parent (superclass) class. These attributes can be overridden in the subclass.
- Initial State: In a State Diagram or an Activity Diagram, this indicates the point at which the diagram begins.
- Instance – A class is used like a template to create an object. This object is called an instance of the class. Any number of instances of the class may be created.
- Interface: A Classifier that defines Attributes and Operations that form a contract for behavior. A provider Class or Component may elect to Realize an Interface (i.e., implement its Attributes and Operations). A client Class or Component may then Depend upon the Interface and thus use the provider without any details of the true Class of the provider.
- Iteration – A mini project section during which some small piece of functionality is added to the project. Includes the development loop of analysis, design and coding.
- Join: A point in an Activity Diagram where multiple parallel control threads synchronize and rejoin.
- Member: An Attribute or an Operation within a Classifier.
- Merge: A point in an Activity Diagram where different control paths come together.
- Message – A request from one object to another asking the object receiving the message to do something. This is basically a call to a method in the receiving object.
- Method – A function or procedure in an object.
- Model – The central UML artifact. Consists of various elements arranged in a hierarchy by Packages, with relations between elements as well.
- Multiplicity – Shown in a domain model and indicated outside concept boxes, it indicates object quantity relationship to quantiles of other objects.
- Navigability: Indicates which end of a relationship is aware of the other end. Relationships can have bidirectional Navigability (each end is aware of the other) or single directional Navigability (one end is aware of the other, but not vice versa).
- Notation – Graphical document with rules for creating analysis and design methods.
- Note: A text note added to a diagram to explain the diagram in more detail.
- Object – Object: In an Activity Diagram, an object that receives information from Activities or provides information to Activities. In a Collaboration Diagram or a Sequence Diagram, an object that participates in the scenario depicted in the diagram. In general: one instance or example of a given Classifier (Actor, Class, or Interface).
- Package – A group of UML elements that logically should be grouped together.
- Package Diagram: A Class Diagram in which all of the elements are Packages and Dependencies.
- Pattern – Solutions used to determine responsibility assignment for objects to interact. It is a name for a successful solution to a well-known common problem.
- Parameter: An argument to an Operation.
- Polymorphism – Same message, different method. Also used as a pattern.
- Private: A Visibility level applied to an Attribute or an Operation, indicating that only code for the Classifier that contains the member can access the member.
- Processor: In a Deployment Diagram, this represents a computer or other programmable device where code may be deployed.
- Protected: A Visibility level applied to an Attribute or an Operation, indicating that only code for the Classifier that contains the member or for its Subclasses can access the member.
- Public: A Visibility level applied to an Attribute or an Operation, indicating that any code can access the member.
- Reading Direction Arrow – Indicates the direction of a relationship in a domain model.
- Realization: Indicates that a Component or a Class provides a given Interface.
- Role – Used in a domain model, it is an optional description about the role of an actor.
- Sequence Diagram: A diagram that shows the existence of Objects over time, and the Messages that pass between those Objects over time to carry out some behavior. State chart diagram – A diagram that shows all possible object states.
- State: In a State Diagram, this represents one state of a system or subsystem: what it is doing at a point in time, as well as the values of its data.
- State Diagram: A diagram that shows States of a system or subsystem, Transitions between States, and the Events that cause the Transitions.
- Static: A modifier to an Attribute to indicate that there’s only one copy of the Attribute shared among all instances of the Classifier. A modifier to an Operation to indicate that the Operation stands on its own and doesn’t operate on one specific instance of the Classifier.
- Stereotype: A modifier applied to a Model element indicating something about it which can’t normally be expressed in UML. In essence, Stereotypes allow you to define your own “dialect” of UML.
- Subclass: A Class which inherits Attributes and Operations that are defined by a Subclass via a Generalization relationship.
- Swimlane: An element of an Activity Diagram that indicates what parts of a system or a domain perform particular Activities. All Activities within a Swimlane are the responsibility of the Object, Component, or Actor represented by the Swimlane.
- Time Boxing – Each iteration will have a time limit with specific goals.
- Transition: In an Activity Diagram, represents a flow of control from one Activity or Branch or Merge or Fork or Join to another. In a State Diagram, represents a change from one State to another.
- Transition Phase – The last phase of the Rational Unified Process during which users are trained on using the new system and the system is made available to users.
- UML – Unified Modeling Language utilizes text and graphic documents to enhance the analysis and design of software projects by allowing more cohesive relationships between objects.
- Use Case: In a Use Case Diagram, represents an action that the system takes in response to some request from an Actor.
- Use Case Diagram: A diagram that shows relations between Actors and Use Cases.
- Visibility: A modifier to an Attribute or Operation that indicates what code has access to the member. Visibility levels include Public, Protected, and Private.
- Workflow – A set of activities that produces some specific result.
UML resources and references
- Unified Modeling Language – Wikipedia
- Unified Modeling Language – IBM
- The Best UML modeling tool: Visual Paradigm
- Visual Paradigm: What is Unified Modeling Language (UML)?
This post is also available in Deutsch, Español, فارسی, Français, English, Bahasa Indonesia, 日本語, Polski, Portuguese, Ру́сский, Việt Nam, 简体中文 and 繁體中文.