
“You cannot build a house without first understanding where it stands.”
— Adapted from Simon Brown, C4 Model Creator
🌍 Introduction: Why the Big Picture Matters
In software architecture, clarity begins at the top. The C4 System Context Diagram—Level 1 of the C4 Model by Simon Brown—is the foundational artifact that answers one critical question:
“Where does this system fit in the world?”
This diagram is not just a visual aid. It’s the first step in building shared understanding across teams, stakeholders, and business leaders. Whether you’re launching a greenfield project or documenting a legacy system, the System Context Diagram provides the satellite view—a high-level map of how your software system interacts with users and other systems.
This guide walks you through everything you need to know: what it is, why it matters, when to use it, how to create it, and how to avoid common pitfalls. It’s designed for architects, developers, product owners, business analysts, and even executives who want to speak the same architectural language.
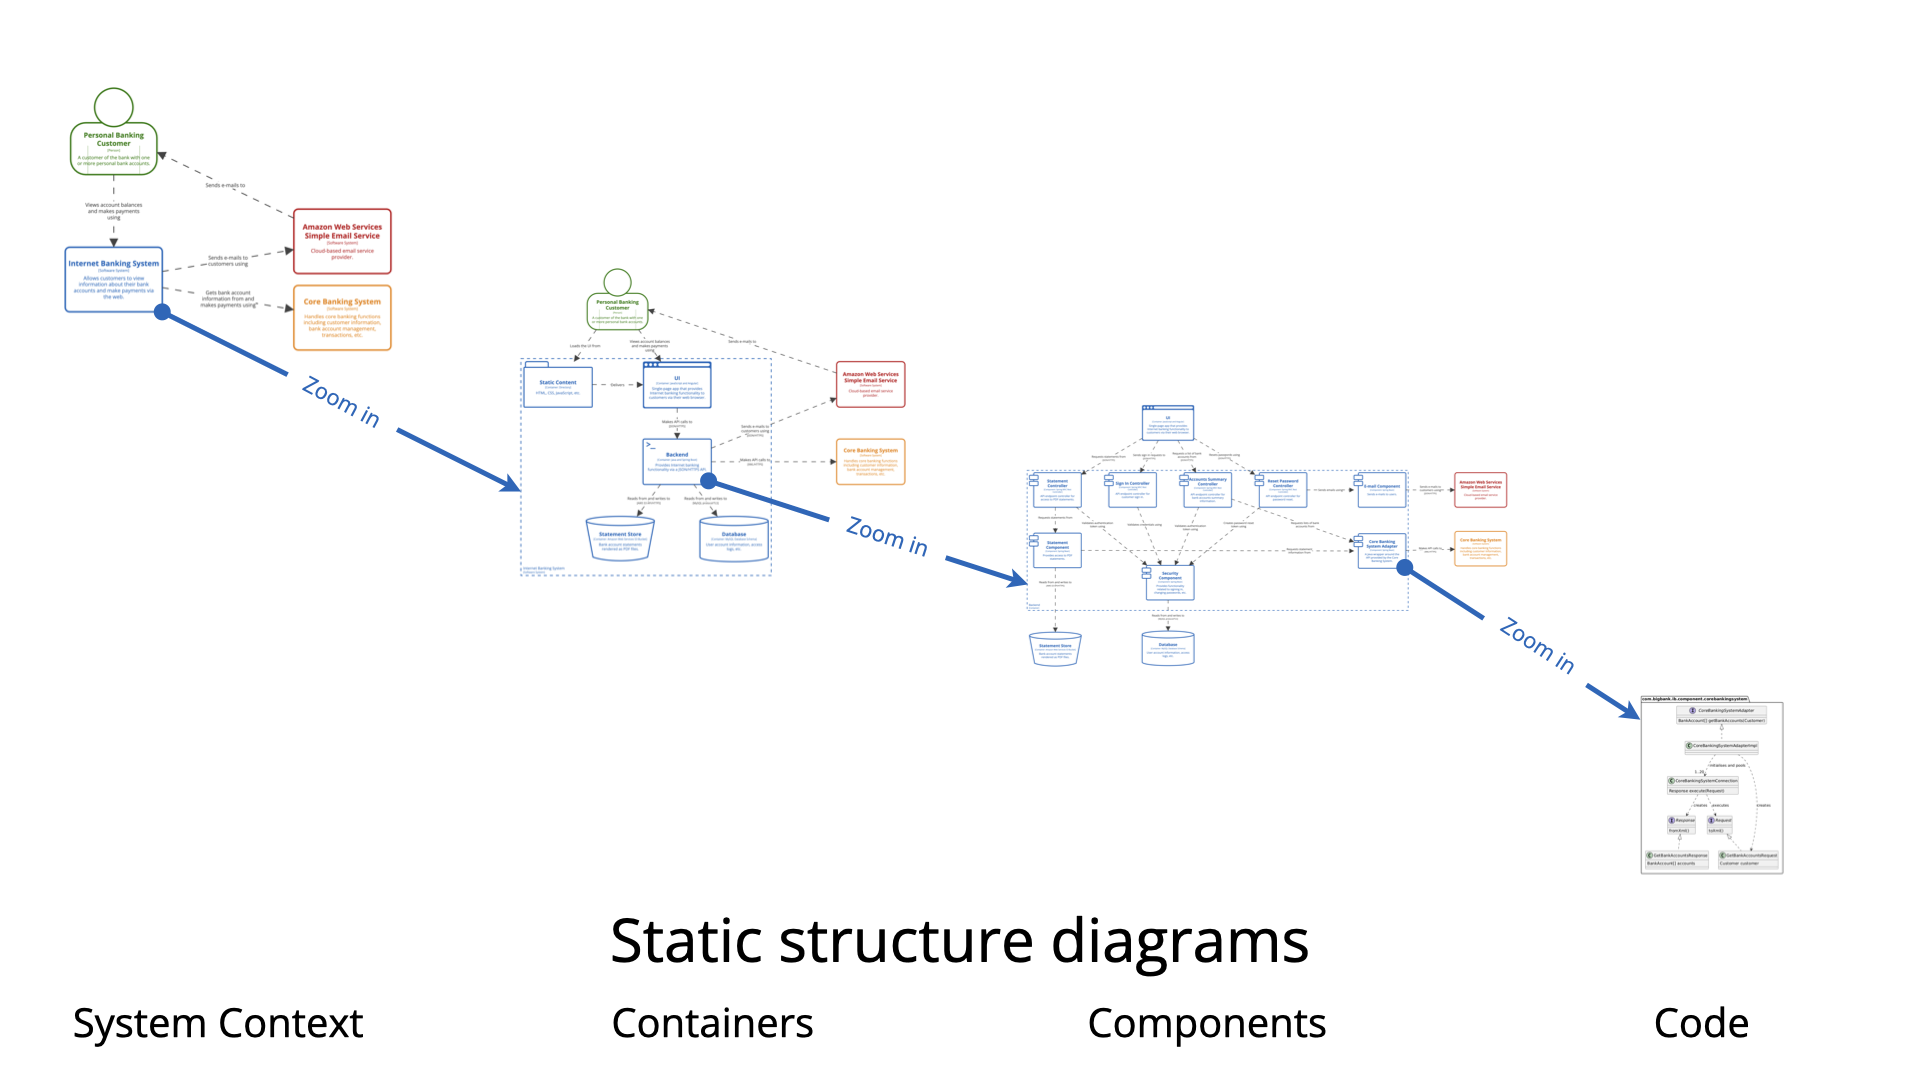
🔷 What Is a C4 System Context Diagram?
The C4 System Context Diagram (Level 1) is the highest-level view in the C4 model. It shows:
-
One software system (the one you’re building or documenting),
-
Surrounded by:
-
People (Users / Actors / Roles),
-
External software systems it directly interacts with.
-
✅ Goal: Understand the scope, boundaries, and ecosystem position of your system — without diving into implementation details.
📌 Key Characteristics
| Feature | Description |
|---|---|
| Level | C4 Level 1 – System Context |
| Focus | High-level interactions only |
| No Details | No containers, components, code, protocols, or deployment details |
| Readability | Intended for non-technical stakeholders |
| Scope | One system at a time — clear boundary |
| Size | Ideally fits on one page |
🧩 Core Elements (C4 Standard)
| Element | Notation | Purpose | Best Practice |
|---|---|---|---|
| Software System (in scope) | Box (centered, bold, colored) | The system you’re documenting | Give a clear name + short purpose |
| Person (User/Actor) | Stick figure or person icon | Roles that interact with the system | Use roles, not names (e.g., “Customer”, “Admin”) |
| External Software System | Box (different style/color) | Other systems your system talks to | Include SaaS, legacy, APIs, partner systems |
| Relationship | Arrow + label | Direction and intent of interaction | Use active-voice verbs: “Submits payment”, “Authenticates via” |
⚠️ Rule of Thumb: If it’s not directly involved in a direct interaction, it doesn’t belong here.
🎯 Why Create a System Context Diagram?
Here’s why this simple diagram has such profound impact:
| Benefit | Explanation |
|---|---|
| ✅ Aligns Stakeholders Instantly | Product owners, developers, testers, and business leaders all see the same picture. |
| ✅ Communicates with Non-Technical Audiences | Executives, auditors, and new hires can understand scope and dependencies. |
| ✅ Prevents Scope Creep | Clearly defines what’s in vs out of scope. |
| ✅ Foundation for Deeper Levels | Every container, component, and deployment diagram traces back to this one. |
| ✅ Identifies Risks Early | Reveals critical external dependencies (e.g., a third-party API with poor uptime). |
| ✅ Accelerates Onboarding | New team members grasp “where we fit” in minutes. |
💬 Simon Brown’s Advice:
“The System Context diagram is the most important diagram in your architecture documentation.”
📅 When Should You Create or Update It?
✅ Create It When:
-
Starting a new project (greenfield).
-
Documenting an existing system (brownfield).
-
Planning a major architectural shift (cloud migration, microservices).
-
Conducting architecture reviews or governance sessions.
-
Onboarding a new team or stakeholder group.
🔁 Update It When:
-
A new user role emerges (e.g., “Partner Admin”).
-
Your system starts integrating with a new external system (e.g., “Payment Processor”).
-
A system is renamed, retired, or re-scoped.
-
There’s a change in business direction or product strategy.
-
Quarterly or annual architecture refresh cycle.
🔄 Best Practice: Treat it as a living document—version it like code, store it in Git, and update it regularly.
🛠️ How to Create a Great System Context Diagram: Step-by-Step
Follow these 7 steps to build a powerful, meaningful, and stakeholder-friendly diagram.
Step 1: Define the System in Scope
Start with one clear sentence that defines your system:
“This is the Internet Banking System — it allows customers to view balances, transfer funds, and pay bills via the web.”
✅ Use active voice
✅ Keep it concise
✅ Focus on core responsibility
💡 Tip: This sentence becomes the system description in your diagram.
Step 2: Identify Users (Persons)
Ask:
“Who gets value from this system?”
Brainstorm roles, not individuals. Common examples:
-
Customer – Uses the system to manage accounts
-
Admin – Manages users and monitors transactions
-
Support Agent – Troubleshoots issues
-
Partner – Integrates with your API
-
Guest – Anonymous users browsing
✅ Use roles, not names (e.g., “Customer” not “John Smith”)
✅ Limit to 3–6 key roles
Step 3: Identify External Systems
Ask:
“What other production systems does this system directly interact with?”
Think direct integrations only — not transitive or indirect ones.
Examples:
-
Core Banking System (legacy mainframe)
-
Payment Gateway (Stripe, PayPal)
-
CRM System (Salesforce)
-
Email Service (SendGrid, AWS SES)
-
Identity Provider (Auth0, Okta, Azure AD)
✅ Only include systems your system calls or receives data from directly
✅ Avoid “we use APIs” — name the actual system
Step 4: Map High-Level Relationships
Draw arrows from users/systems to the software system (or vice versa), labeled with intent.
Use active-voice verb phrases:
-
✅ “Submits payment”
-
✅ “Views account balance”
-
✅ “Authenticates via Auth0”
-
✅ “Receives order notifications”
-
✅ “Sends confirmation email”
❌ Avoid:
“Uses HTTPS”
“Calls REST API”
“Sends data via Kafka”
Step 5: Keep It Simple & Readable
Golden Rules:
-
Max 10–12 boxes total (including your system)
-
One page only — no scrolling
-
Use consistent icons/colors:
-
People: Stick figures or person icons
-
Your system: Central box, bold, colored
-
External systems: Different color or border style (e.g., dashed)
-
📝 Add a legend explaining symbols (e.g., “Blue = External System”, “Green = Person”)
📌 Tip: If you have more than 12 boxes, consider moving to a System Landscape Diagram (Level 0) instead.
Step 6: Validate with Stakeholders
Show it to:
-
Product Owner
-
Business Analyst
-
Senior Developer
-
UX Designer
-
IT Security or Compliance Officer
Ask:
“Does this accurately reflect how the system works?”
“Are we missing any key users or integrations?”
🔄 Iterate until consensus is reached.
Step 7: Choose Your Tooling (2026 Landscape)
| Tool | Best For | Pros | Cons |
|---|---|---|---|
| PlantUML + C4-PlantUML | Code-based, Git-friendly | Free, automated, version-controlled | Learning curve |
| Structurizr | Enterprise, collaborative | Web-based, supports all C4 levels | Free tier limited |
| IcePanel | Visual, interactive | Real-time collaboration, AI-assisted | Subscription |
| Visual Paradigm AI C4 Studio | AI-powered design | Auto-generates diagrams from text | Paid |
| Draw.io / diagrams.net | Quick sketches | Free, integrates with Confluence, GitHub | Manual layout |
| Miro / Lucidchart / Excalidraw | Workshops & brainstorming | Great for whiteboarding | Not version-controlled by default |
🛠️ Recommendation: Use PlantUML with C4 extension for long-term maintainability.
🖼️ Quick PlantUML Example: Internet Banking System
@startuml
!include https://raw.githubusercontent.com/plantuml-stdlib/C4-PlantUml/master/C4_Context.puml
title Internet Banking System - System Context (Level 1)

Person(customer, "Personal Customer", "Uses internet banking to manage accounts and make payments")
Person(admin, "Bank Staff / Admin", "Manages users and monitors transactions")

System_Boundary(c4, "Internet Banking System") {
    System(ib, "Internet Banking", "Allows customers to view accounts, transfer money, pay bills")
}

System_Ext(core, "Core Banking System", "Legacy mainframe – source of truth for accounts & transactions")
System_Ext(email, "Email Service", "Sends confirmation & security emails (e.g. AWS SES)")

Rel(customer, ib, "Views balances, makes transfers, pays bills")
Rel(admin, ib, "Manages accounts, views reports")
Rel(ib, core, "Reads account data, submits transactions")
Rel(ib, email, "Sends notifications")

legend right
    C4 Context Diagram – Level 1\n
    • One software system in scope\n
    • Users (Persons) and external systems\n
    • No implementation details\n
    • High-level intent only
end legend

@enduml
✅ Output: A clean, professional, version-controlled diagram that can be rendered automatically from code.
🏆 Best Practices: Do This, Not That
| ✅ Do | ❌ Don’t |
|---|---|
| Use active-voice labels: “Submits payment”, “Authenticates via” | Use passive: “Payment is submitted” |
| Center your system | Place it off-center or in a corner |
| Keep language simple and non-technical | Use jargon like “API”, “microservices”, “Kafka” |
| Include only direct interactions | Add systems your system indirectly depends on |
| Use consistent icons/colors | Mix styles randomly |
| Version the diagram (e.g., v1.0) | Treat it as static or throw it away after creation |
| Store it in code (e.g., PlantUML file) | Save only as a PNG/PDF with no source |
🚩 Common Mistakes to Avoid
-
Adding too many boxes → Over 12 total? You may need a System Landscape Diagram (Level 0).
-
Including technology details → No “REST”, “HTTPS”, “Kafka”, “Docker”.
-
Showing internal components → That’s Level 2 (Container Diagram).
-
Using real names instead of roles → “John Smith” → “Customer”.
-
Ignoring external systems → Missing critical dependencies like payment gateways or legacy systems.
-
Not validating with stakeholders → Risk of misalignment and rework.
📌 Final Thoughts: Start Here, Build Upward
The System Context Diagram is not just the first step — it’s the most important.
It’s the foundation upon which all other architectural decisions are built. A well-crafted Level 1 diagram:
-
Prevents misunderstandings
-
Reduces rework
-
Speeds up onboarding
-
Enables better decision-making
🏁 Pro Tip: Before creating any deeper diagrams (Containers, Components, Code), always start with the System Context Diagram.
📚 Further Reading & Resources
-
📘 C4 Model Official Site: https://c4model.com
-
📄 C4 Model Documentation: https://github.com/c4model/c4-model
-
🧩 C4-PlantUML Library: https://github.com/plantuml-stdlib/C4-PlantUML
-
🧠 Visual Paradigm C4 Guide: https://www.visual-paradigm.com/guides/c4-model/
-
🎥 Simon Brown’s YouTube Talks: Search “C4 Model” on YouTube
✅ Summary: Your C4 System Context Checklist
| Task | Done? |
|---|---|
| Define system with one clear sentence | ☐ |
| Identify 3–6 key user roles | ☐ |
| Identify 3–6 key external systems | ☐ |
| Draw only direct, high-level interactions | ☐ |
| Use active-voice labels (e.g., “Submits payment”) | ☐ |
| Keep diagram readable on one page | ☐ |
| Use consistent icons/colors | ☐ |
| Add a legend | ☐ |
| Validate with stakeholders | ☐ |
| Store as code (e.g., PlantUML) | ☐ |
🌟 Remember:
Great architecture starts with clarity.
Clarity starts with the System Context Diagram.
👉 Start with this diagram on your next project.
You’ll save time, avoid confusion, and build trust across teams and stakeholders.
📣 “The best architecture is the one everyone understands.”
— Inspired by Simon Brown
Download this guide as a PDF → [Link to downloadable version]
Use this template in your next project → [Link to GitHub repo with PlantUML example]
📌 Tagline:
“See the Forest Before the Trees — Master the C4 System Context Diagram.”
- Ultimate Guide to C4 Model Visualization Using Visual Paradigm’s AI Tools: This guide explains how to leverage AI-powered tools to automate and enhance C4 model visualization for faster software architecture design.
- Leveraging Visual Paradigm’s AI C4 Studio for Streamlined Architecture Documentation: This article details using an AI-enhanced studio to create clean, scalable, and maintainable software architecture documentation.
- The Ultimate Guide to C4-PlantUML Studio: Revolutionizing Software Architecture Design: This resource explores combining AI-driven automation, the C4 model’s clarity, and PlantUML’s flexibility into a single powerful tool.
- A Comprehensive Guide to Visual Paradigm’s AI-Powered C4 PlantUML Studio: This guide describes a purpose-built tool released in late 2025 that transforms natural language prompts into layered C4 diagrams.
- C4-PlantUML Studio | AI-Powered C4 Diagram Generator: This feature overview highlights an AI-driven tool designed to generate C4 software architecture diagrams from simple text descriptions.
- Generating and Modifying C4 Component Diagrams with Visual Paradigm AI Chatbot: This tutorial demonstrates using an AI-powered chatbot to iteratively create and refine component-level architecture for complex systems.
- AI-Powered C4 Diagram Generator: Core Levels and Supporting Views: This page explains how the AI generator supports the four core levels of the C4 model—Context, Container, Component, and Deployment—to provide comprehensive documentation.
- AI Diagram Generator: Complete C4 Model Support Release: This update details the integration of AI-powered features for the automated creation of hierarchical C4 model diagrams.
- C4 Model AI Generator: Automating the Full Modeling Lifecycle: This resource highlights how a specialized AI chatbot uses conversational prompts to ensure consistency across architecture documentation for DevOps teams.
- Comprehensive Review: Generic AI Chatbots vs. Visual Paradigm’s C4 Tools: This comparison explains why specialized tools like the C4 PlantUML Studio provide more structured and professional-grade results than general-purpose language models.