


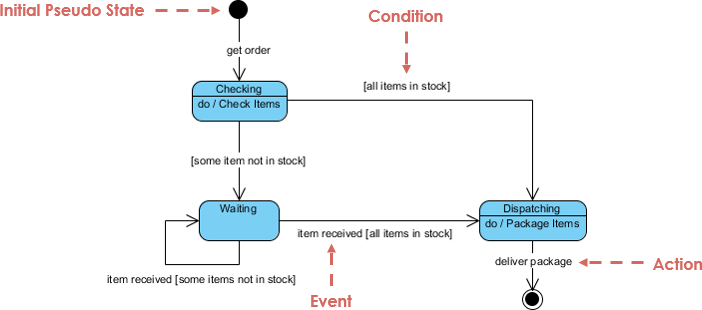
A state diagram is an abstract representation of a process. It is commonly used in computer science to model the process of programming languages, and it can also help analysts map business processes. The elements of the system are usually called objects and can change state.
These transformations in the Unified Modeling Language (UML) are tracked throughout the diagram (also known as the UML state machine diagram). UML state diagrams can capture the life cycle of objects, subsystems, and systems, and can inform the state that an object can have, and how events (such as the reception of messages, the passage of time, errors, conditions are true, etc.) will evolve over time To influence these states.
State diagram can also be used to describe the various states of an object, the transition process between states, and various events and conditions that trigger state transitions.
What is State Transition?
The flow of a state diagram is usually determined by the transitions that occur. Certain object states can be converted to redundant states. Sometimes, multiple transitions can lead to the same state, which can cause confusion. In this case, more than one box can be encapsulated in another box, which is usually called a super state. If the events and transitions in the system are complex, this format can make the state diagram easier to read.
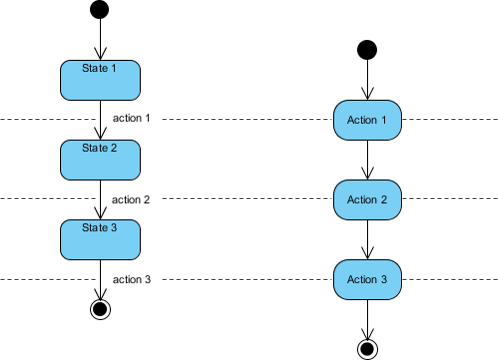
State Diagram vs Flowcharts
People often confuse state diagrams with flowcharts. The figure below shows a comparison of a state diagram with a flowchart. A state machine diagram in the Figure on the left below performs actions in response to explicit events. In contrast, the Activity diagram in the Figure of the right below does not need explicit events but rather transitions from node to node in its graph automatically upon completion of activities.
What is Activity Diagram?
Activity diagrams describe activities which involve concurrency and synchronization, which are a variation of state diagrams that focuses on the flow of actions and events. They can be used for:
- To model a human task (a business process, for instance).
- To describe a system function that is represented by a use case.
- In operation specifications, to describe the logic of an operation.
Activity Diagram vs State Machine Diagram
Activity Diagram
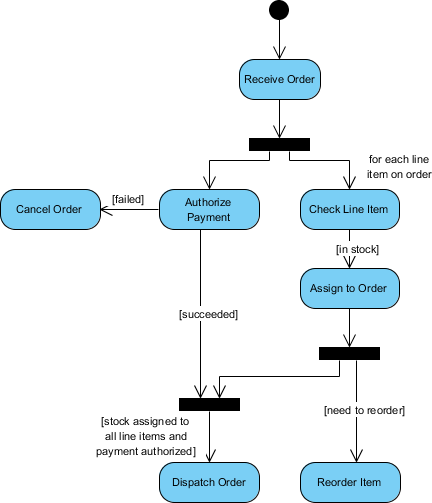
In UML semantics, Activity Diagrams are reducible to State Machines with some additional notations that the vertices represent the carrying out of an activity and the edges represent the transition on the completion of one collection of activities to the commencement of a new collection of activities. Activity Diagrams capture high level activities aspects. In particular, it is possible to represent concurrency and coordination in Activity Diagrams.
Take a look at the Activity Diagram which models the flow of actions for an incident. Such an Activity Diagram focuses on the flow of data within a system.
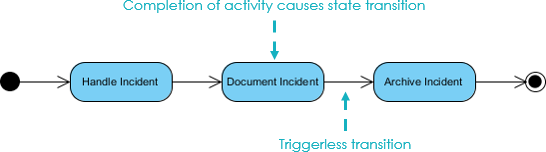
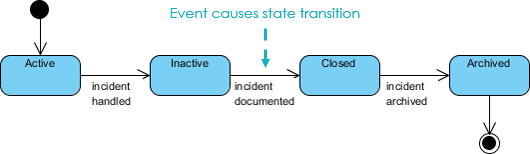
State Machine Diagram
In State Machines the vertices represent states of an object in a class and edges represent occurrences of events. The additional notations capture how activities are coordinated. Objects have behaviors and states. The state of an object depends on its current activity or condition. A State Machine Diagrams shows the possible states of the object and the transitions that cause a change in state.
Take a look at the State Machine Diagram below. It models the transitioning of states for an incident. Such a state diagram focuses on a set of attributes of a single abstraction (object, system).
Try to Draw UML State Machine Diagram Now
You’ve learned what a State Machine Diagram is and how to draw a State Machine Diagram. It’s time to draw a State Machine Diagram of your own. Get Visual Paradigm Community Edition, a free UML software tool, and create your own State Machine Diagram with the free State Machine Diagram tool. It’s easy-to-use and intuitive.
This post is also available in Deutsch, Español, فارسی, Français, English, Bahasa Indonesia, 日本語, Polski, Portuguese, Ру́сский, Việt Nam, 简体中文 and 繁體中文.