


Codzienne mapy, stacje MRT, przystanki autobusowe, wykresy danych w gazetach i wykresy w Excelu to wszystko infografiki. Celem jest wizualizacja danych, aby pomóc czytelnikom szybko zrozumieć i cieszyć się czytaniem danych. Jeśli jakakolwiek firma, sprzedawca lub agencja reklamowa chciałaby wyrazić swoje wyniki sprzedaży lub osiągnięcia, poniższy tradycyjny wykres byłby nudny, brakowałoby mu kontrastu i nie reprezentowałby cech branży.
Teraz infografiki stają się coraz bardziej popularne na całym świecie. Strony internetowe z wiadomościami często widzą słowo “infografika” na końcu, a gdy na nie klikniesz, zauważysz, że twoja uwaga skupia się na informacjach i tekście wewnątrz wykresu, a nie na tekście na zewnątrz.
Na przykład:
Infografiki sprawiają, że twoja prezentacja jest bardziej interesująca
Według Cliffa Atkinsona, eksperta od prezentacji, dobrze wykonana wizualna infografika ma szereg korzyści:
- Może pomóc klientom szybko zrozumieć abstrakcyjny koncept
- Wzbogac swoją prezentację
- Czytelnicy są zachęcani do dalszego zrozumienia treści obrazu
- Zrób świetną prezentację
- Użyj obrazów, aby opowiedzieć historię i wyróżnić punkt
Powszechnym nawykiem czytelniczym jest najpierw patrzenie na obrazy, a potem na tekst. Wykorzystanie tej cechy i zastosowanie jej w infografice może pomóc w lepszej komunikacji z klientem, a nawet zastąpić prezentację PowerPoint.
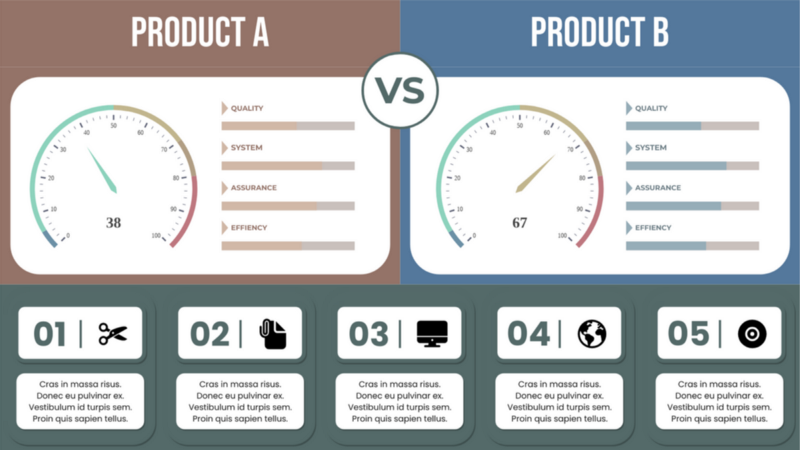
Podobnie, jeśli masz pomysł na porównanie wyników kilku sklepów, można to wyrazić w infografice, przyjmując szablon infografiki jak ten.
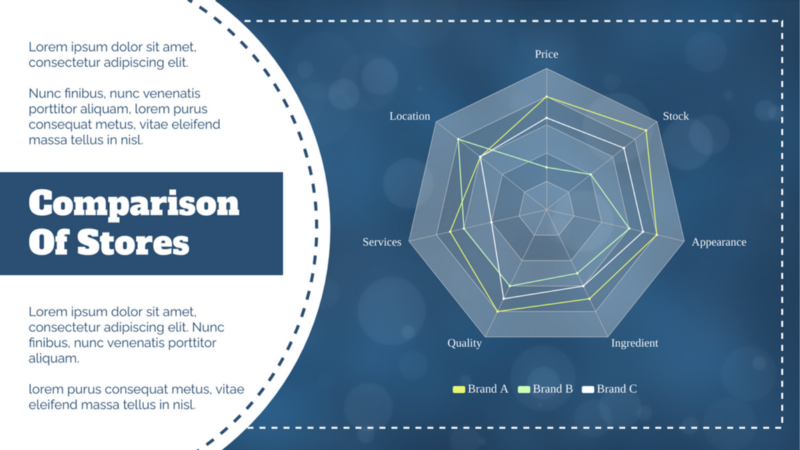
Edytuj powyższy szablon infografiki
Istnieje wiele innych gotowych szablonów prezentacji, z których możesz czerpać inspirację:

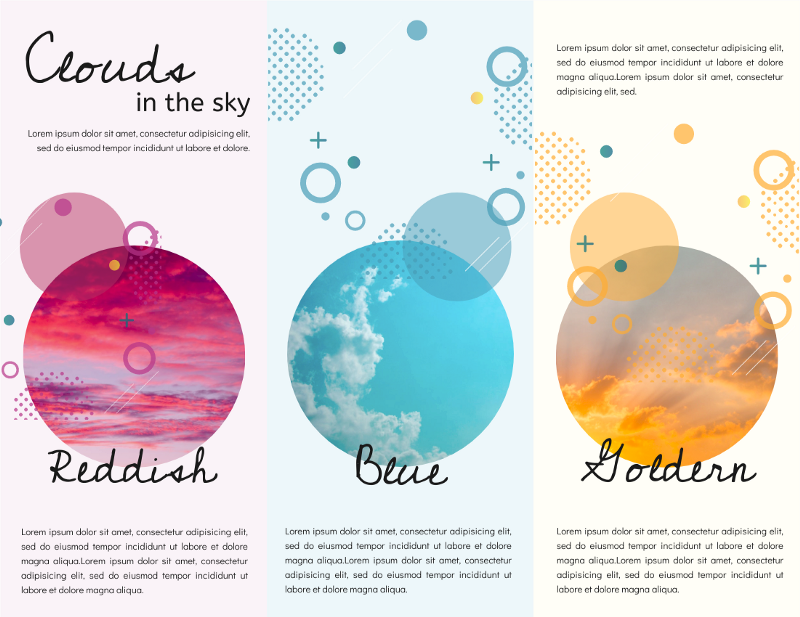
Broszura z trójdzielnym obrazem żywych chmur

Czerwona broszura na wydarzenie ślubne

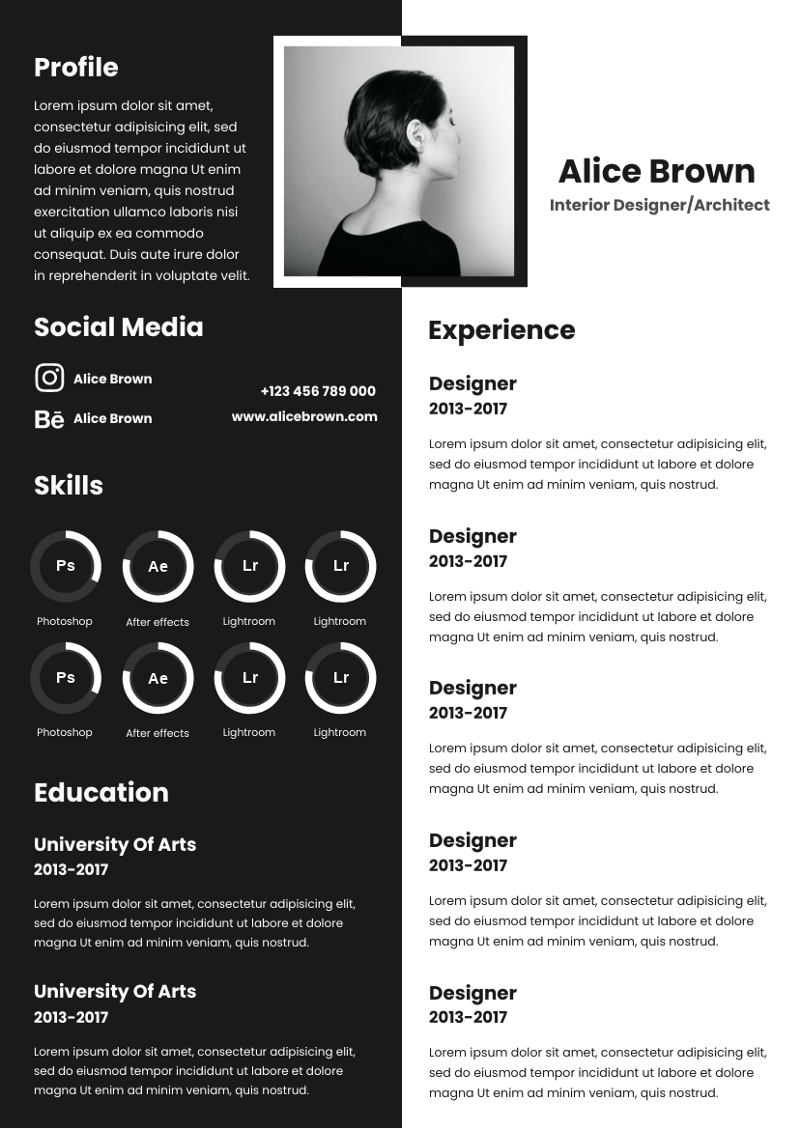
Minimalistyczne CV w formie infografiki

Izometryczny diagram konsultacji biznesowych

Izometryczny rysunek skutecznych celów finansowych

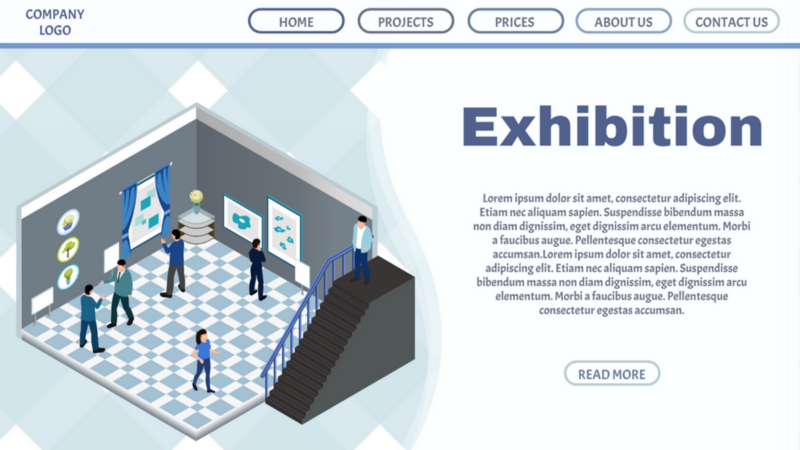
Fioletowy baner projektowania wnętrz z diagramem izometrycznym

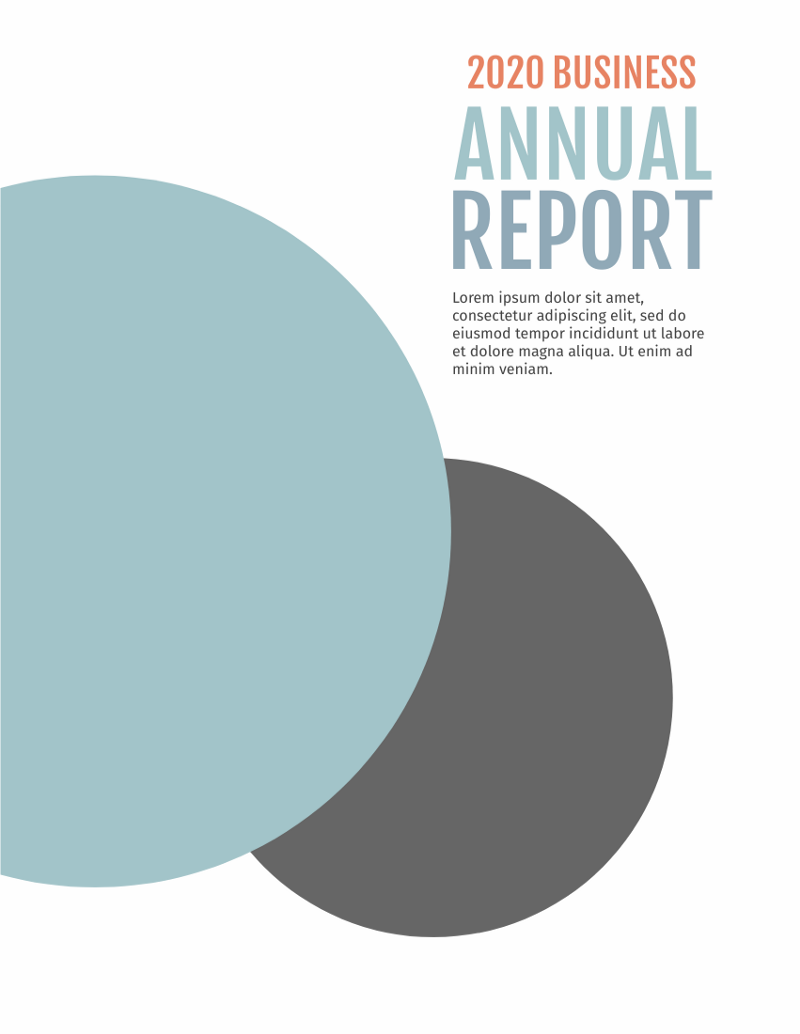
Roczny raport organizacji non-profit


Ten post dostępny jest również w Deutsch, English, Español, فارسی, Français, English, Bahasa Indonesia, 日本語, Portuguese, Ру́сский, Việt Nam, 简体中文 and 繁體中文